
Key risk events today:
US Prelim UoM Consumer Sentiment.
(Previous analysis as well as outside sources – italics).
EUR/USD:
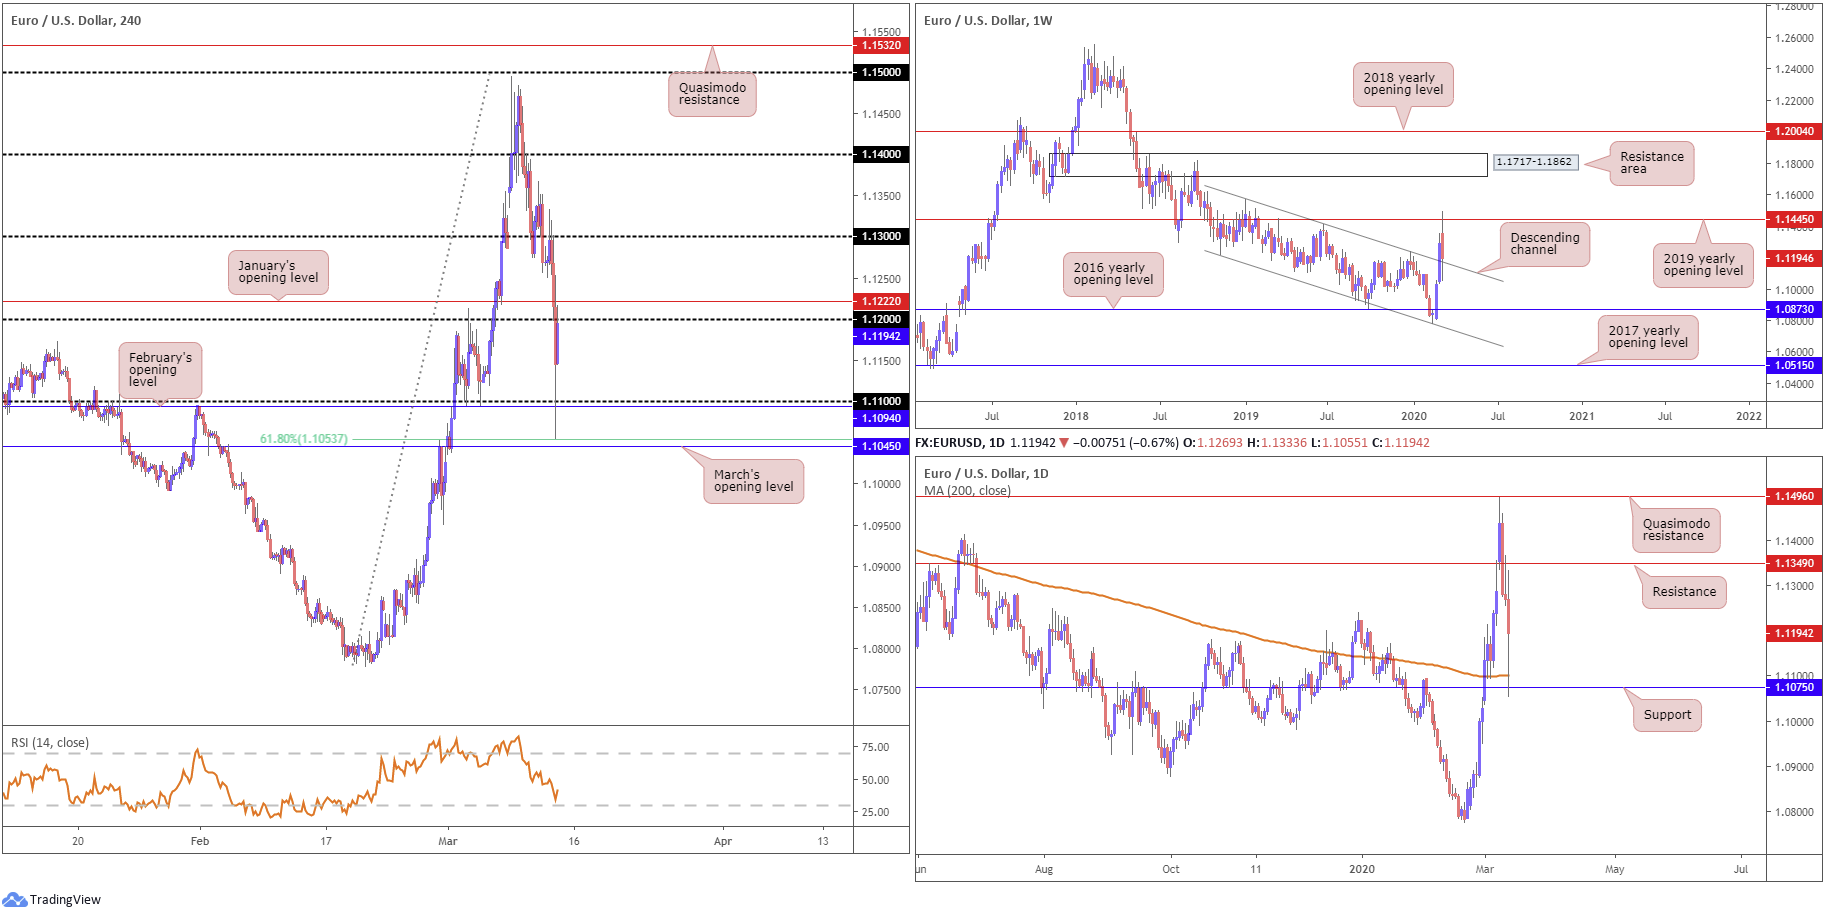
Europe’s single currency attempted a comeback against the buck off the 61.8% Fibonacci retracement ratio at 1.1053 on the H4 scale, a touch north of March’s opening level at 1.1045, after free falling from highs at 1.1333. Sell-stop-liquidity south of 1.11 was also likely triggered, with price action recently engaging 1.12 as resistance, positioned just beneath January’s opening level at 1.1222. The relative strength index (RSI) is mildly bottoming a few points ahead of oversold waters.
In terms of the European Central Bank, we saw interest rates remain unchanged, despite recent cuts by G10 peers. The ECB’s decision to stand pat suggests policymakers don’t think another cut will do much.
Technical headlines on the daily timeframe recently engaged with support coming in at 1.1075, reinforced closely by the widely watched 200-day SMA (orange – 1.1100). The rebound from this angle has been considerable, consequently reclaiming a large portion of yesterday’s losses. Resistance, with respect to the daily scale, resides around 1.1349. The story on the weekly timeframe, however, reconnected with a long-standing channel resistance-turned support, extended from the high 1.1569, after receding from the 2019 yearly opening level from 1.1445.
Areas of consideration:
Volatility remains high in the FX space, defiling many technical levels. The rebound from the 61.8% Fibonacci retracement ratio at 1.1053 on the H4 timeframe was of note, given close confluence from March’s opening level at 1.1045, daily support at 1.1075 and the 200-day SMA, as well as the weekly channel support. Well done to any traders who caught this move.
1.12 on the H4 may continue to serve as resistance, knowing January’s opening level at 1.1222 lurks close by. However, with weekly price testing channel support, and a lack of daily resistance, higher prices could be on the cards, potentially unlocking the door for bullish scenarios north of 1.12 today, targeting 1.13.
GBP/USD:
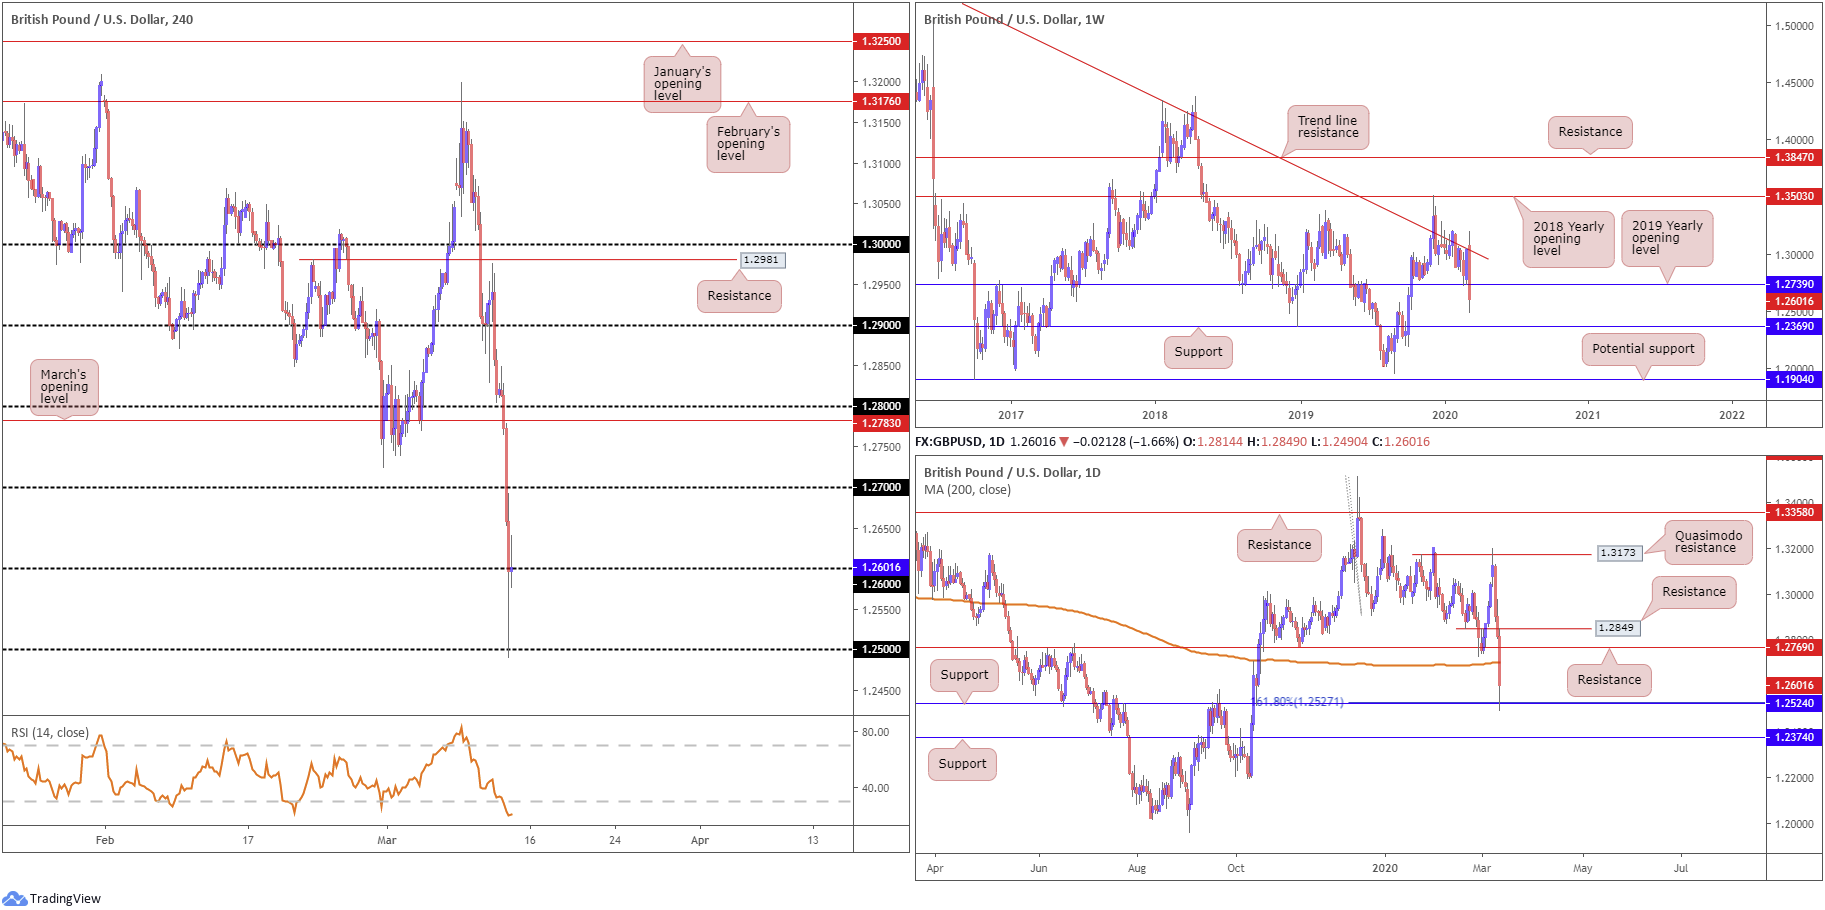
The British pound found itself under significant pressure Thursday against the US dollar, largely connected to deterioration in global sentiment stemming from coronavirus concerns. Bolstered by a pullback in the US dollar index, however, 1.25, based on the H4 timeframe, maintained position, offering GBP/USD some much-needed respite. As of writing, bulls are seen firming modestly north of 1.26, with the relative strength index showing little signs of recovery off 19.00, deep within oversold terrain.
Technical support on the daily timeframe held at 1.2524, strengthened on the back of confluence stemming from the 61.8% Fibonacci retracement ratio at 1.2527. Yesterday’s decline also dethroned the 200-day SMA (orange – 1.2703), as well as support at 1.2769, both now likely to represent resistance going forward.
Weekly price punished the 2019 yearly opening level at 1.2739 amidst recent selling, perhaps unlocking the door to further losses towards support coming in at 1.2369.
Areas of consideration:
1.26 holding as support may be on the radar for some traders today, though upside attempts could be limited by 1.2739: the 2019 yearly opening level on the weekly timeframe.
Downside south of 1.26 is an alternative direction today; however, with daily buyers making a show off support at 1.2542, further recovery may be favoured.
AUD/USD:
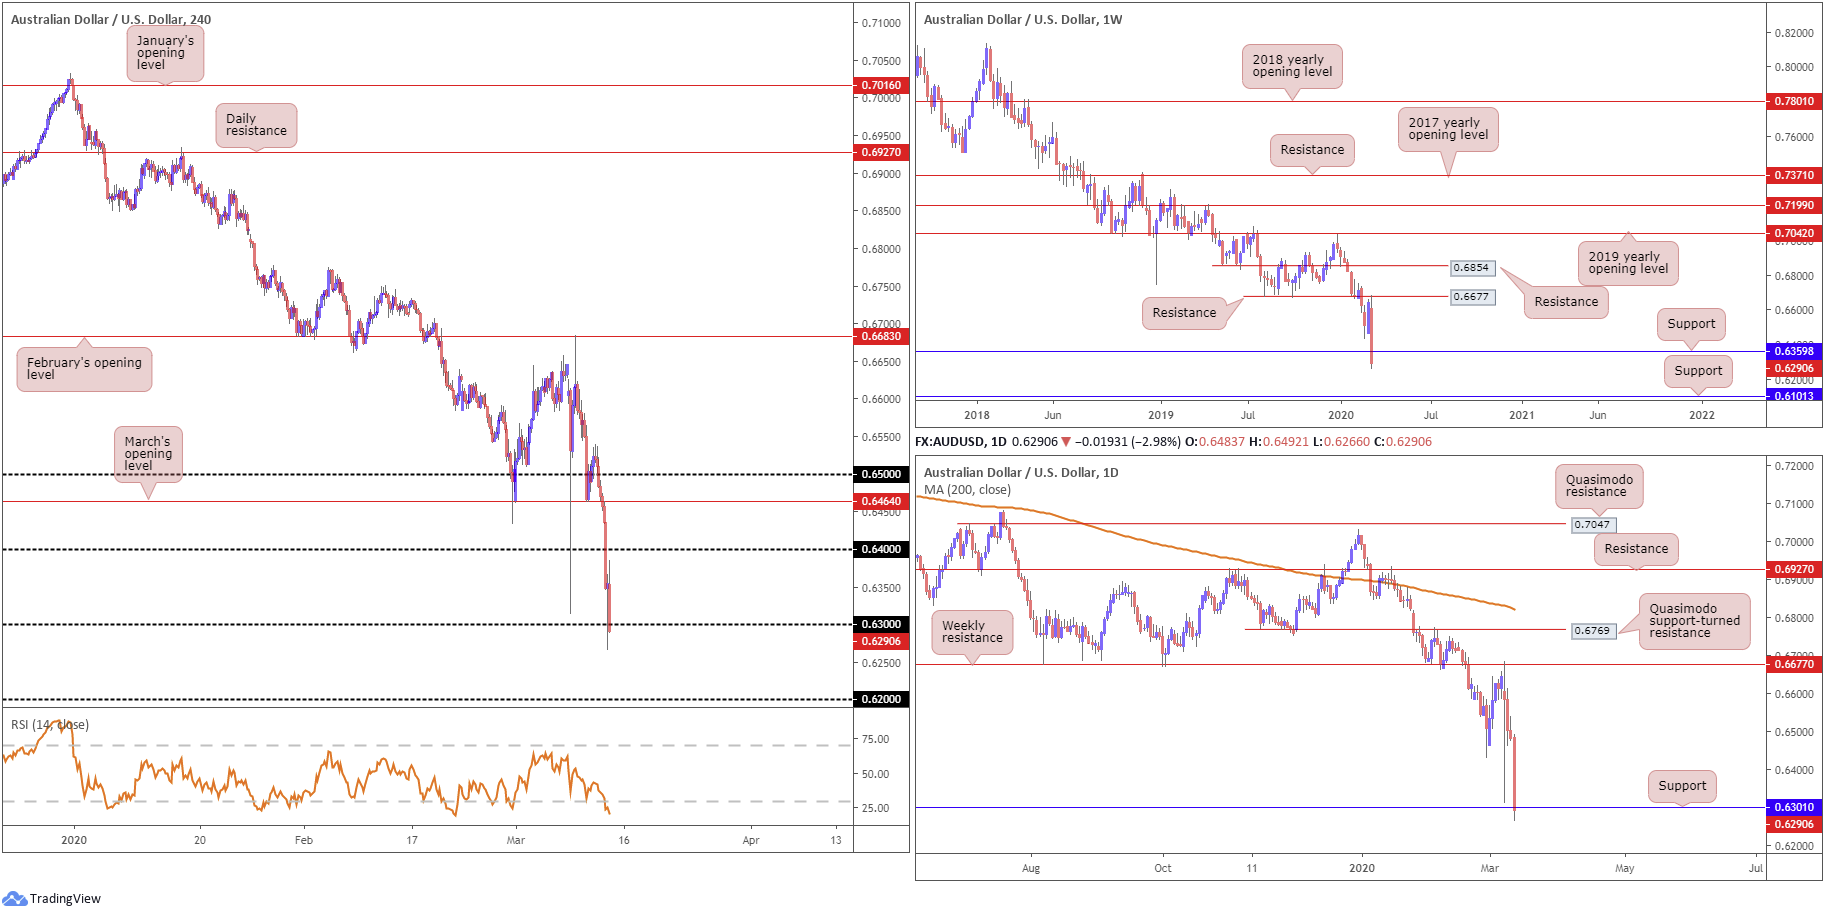
Refreshing multi-year lows at 0.6266, the Australian dollar ceded ground vs. the US dollar Thursday, down more than 170 points, or 2.6%. The US dollar is the world’s reserve currency; therefore, it tends to benefit when markets exhibit panic.
The 0.63 handle on the H4 timeframe is in motion, but displaying limited sign of bullish intent. The relative strength index (RSI), for those who follow momentum oscillators, will note the indicator dipped into oversold territory yesterday, reaching bottoms around 22.00.
Daily support at 0.6301 made an appearance, though like 0.63, shows little sign of future recovery. Of interest is the weekly timeframe, recently penetrating support at 0.6359, revealing downside potential to as far south as support registered at 0.6101, which also denotes the next downside support target on the daily timeframe, too.
Areas of consideration:
According to the primary trend and higher-timeframe structure, the outlook is not bright for AUD/USD.
H4 price closing beneath 0.63 today likely trips sell-stops from those long the round number, and draws in breakout sellers, targeting at least 0.62. The ideal scenario would be for a daily close to form beneath daily support at 0.6301, followed up with a retest at 0.63 on the H4 in the shape of a H4 bearish candlestick signal. Entry/risk can then be calculated based on this signal, with downside objectives set at 0.62, and then, with a little bit of oomph, weekly support priced in at 0.6101.
USD/JPY:
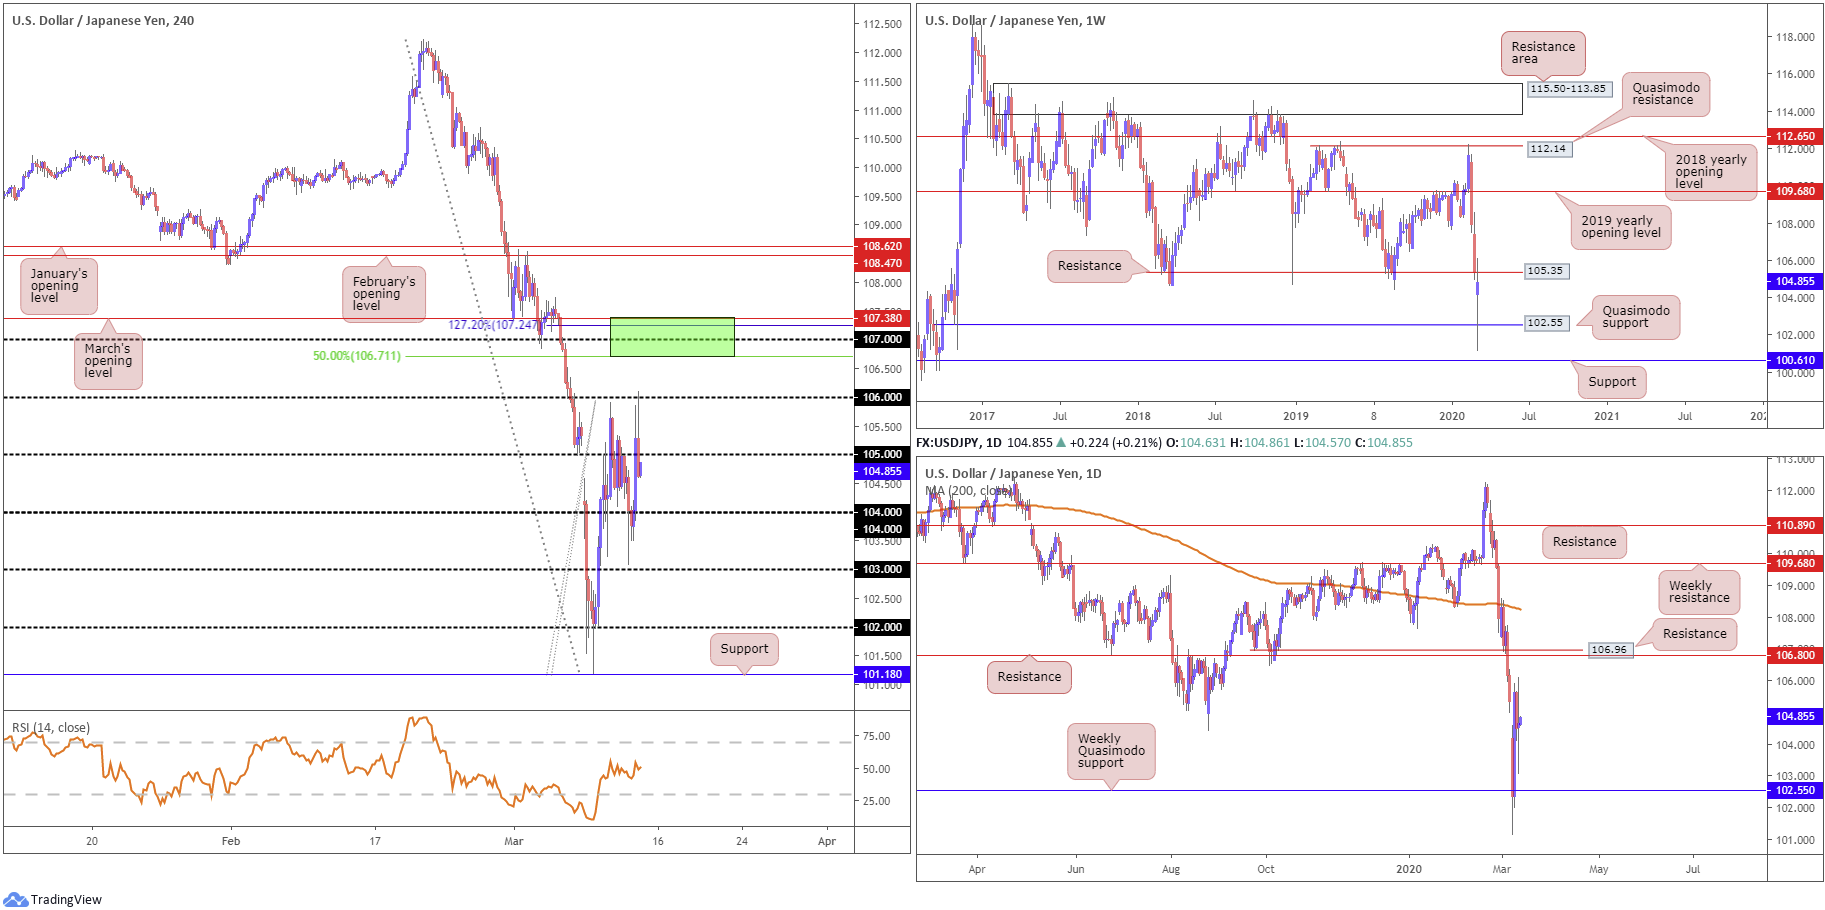
Despite another round of volatile trading Thursday, USD/JPY wrapped up the session pretty much unchanged.
A punishing sell-off across global equity markets took shape, which typically underpins demand for the safe-haven Japanese yen.
Technical structure on the H4 is largely governed by round-number figures right now, with 106 capping upside. Beyond here, an interesting port of resistance resides between March’s opening level at 107.38 and the 50.0% retracement at 106.71 (green – within holds the 107 handle and a 127.2% Fibonacci extension point at 107.24).
Movement on the weekly timeframe faded Quasimodo support at 102.55, with resistance at 105.35 containing upside. A breach realises minor swing lows potentially offering resistance, yet key resistance resides off the 2019 yearly opening level at 109.68.
A closer reading of price action on the daily timeframe shows price exhibits scope for moves higher, targeting resistance at 106.80 and 106.96, a Quasimodo support-turned resistance.
Areas of consideration:
The 107.38/106.71 area on the H4 timeframe is likely of interest for shorting opportunities today, owing to its surrounding local confluence. What’s also notable is the daily resistances at 106.96 and 106.80 converge with the area, increasing the odds a move lower may materialise, targeting the 106 handle as the initial port of call.
USD/CHF:
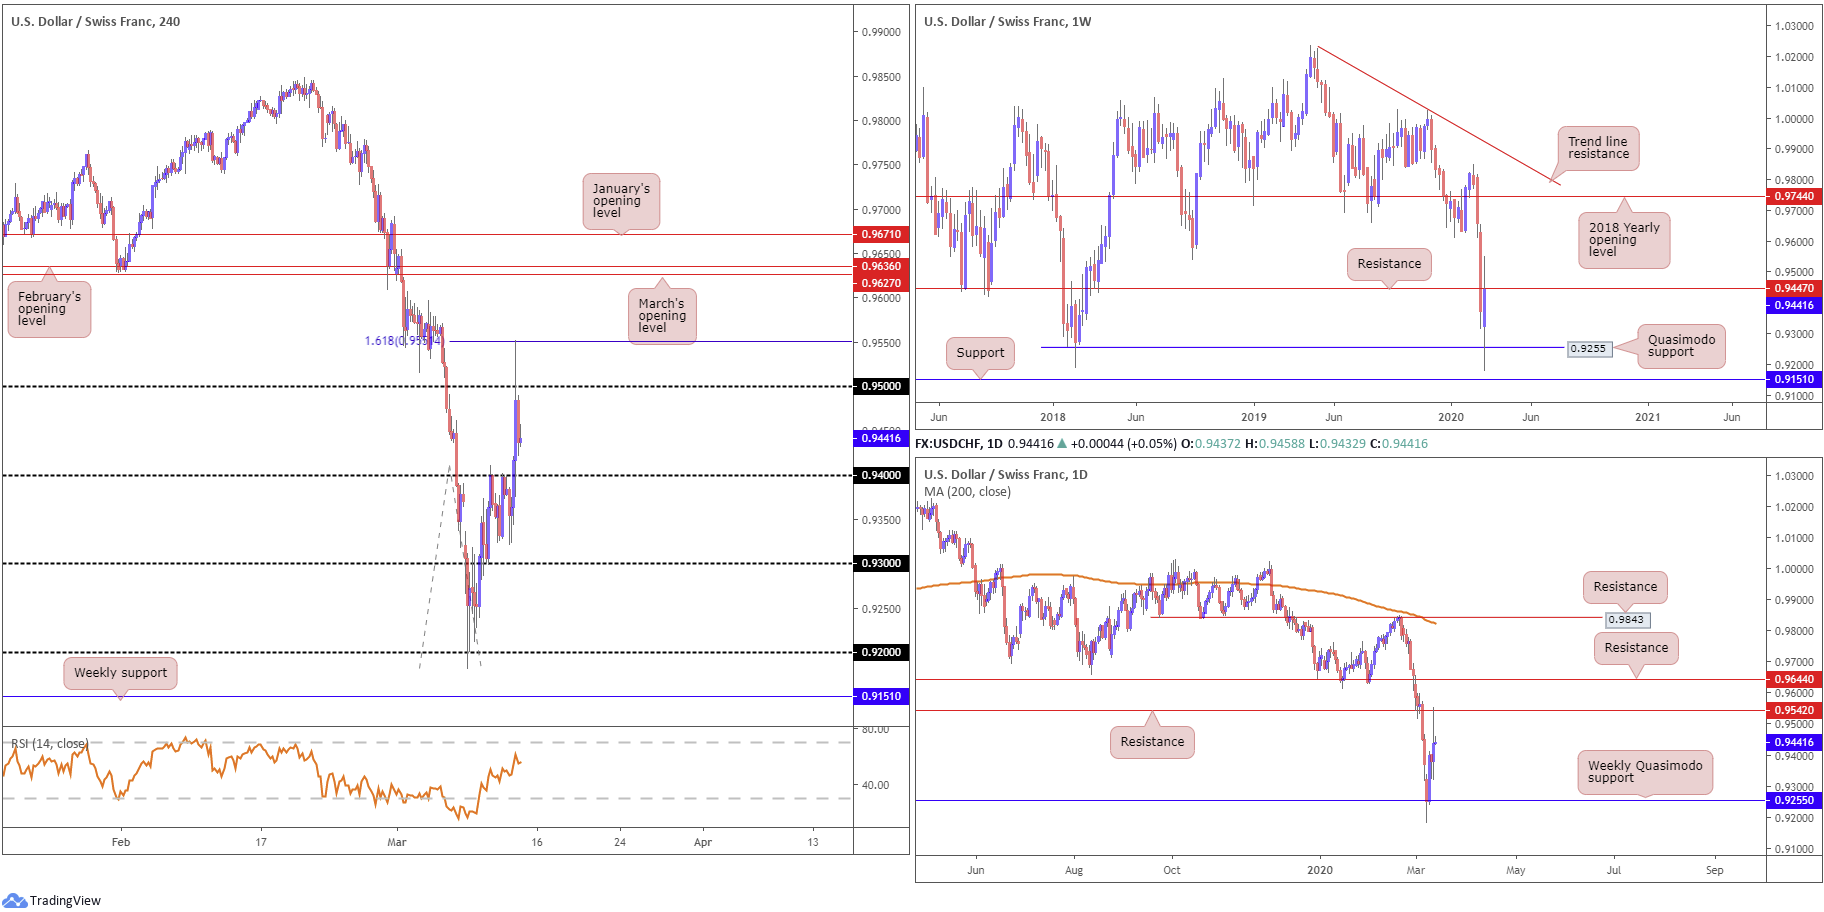
Demand for the safe-haven Swiss franc diminished Thursday, despite global risk aversion plaguing markets. The US dollar index rallied to highs at 98.31, providing fresh impetus to the USD/CHF, conquering 0.94, and whipsawing through 0.95 to a 161.8 Fibonacci extension point at 0.9550, before pulling back into New York’s close at 0.9437.The relative strength index (RSI) failed to reach overbought status, hovering a touch north of 50.00.
Quasimodo support on the weekly timeframe at 0.9255 recently capped downside, albeit after a brief spell to lows at 0.9182 (levels not seen since June 2015). Further recovery on this timeframe saw resistance from 0.9447 make an appearance, while daily price also shows resistance entered the fold at 0.9542.
Areas of consideration:
With weekly and daily timeframes underlining resistance, and exhibiting scope to explore lower prices, a test of 0.94 (H4) may be on the cards today. Entering long from this level, while it held beautifully as resistance, could only trigger a brief recovery.
A break lower, as the higher-timeframes suggest, is the more likely outcome, triggering bearish themes to 0.93, and then possibly weekly Quasimodo support at 0.9255.
XAU/USD (GOLD):
Bullion, a market that usually rallies in times of market panic, fell sharply Thursday, shedding more than 3.50%.
For traders who read Thursday’s technical briefing you may recall the following piece:
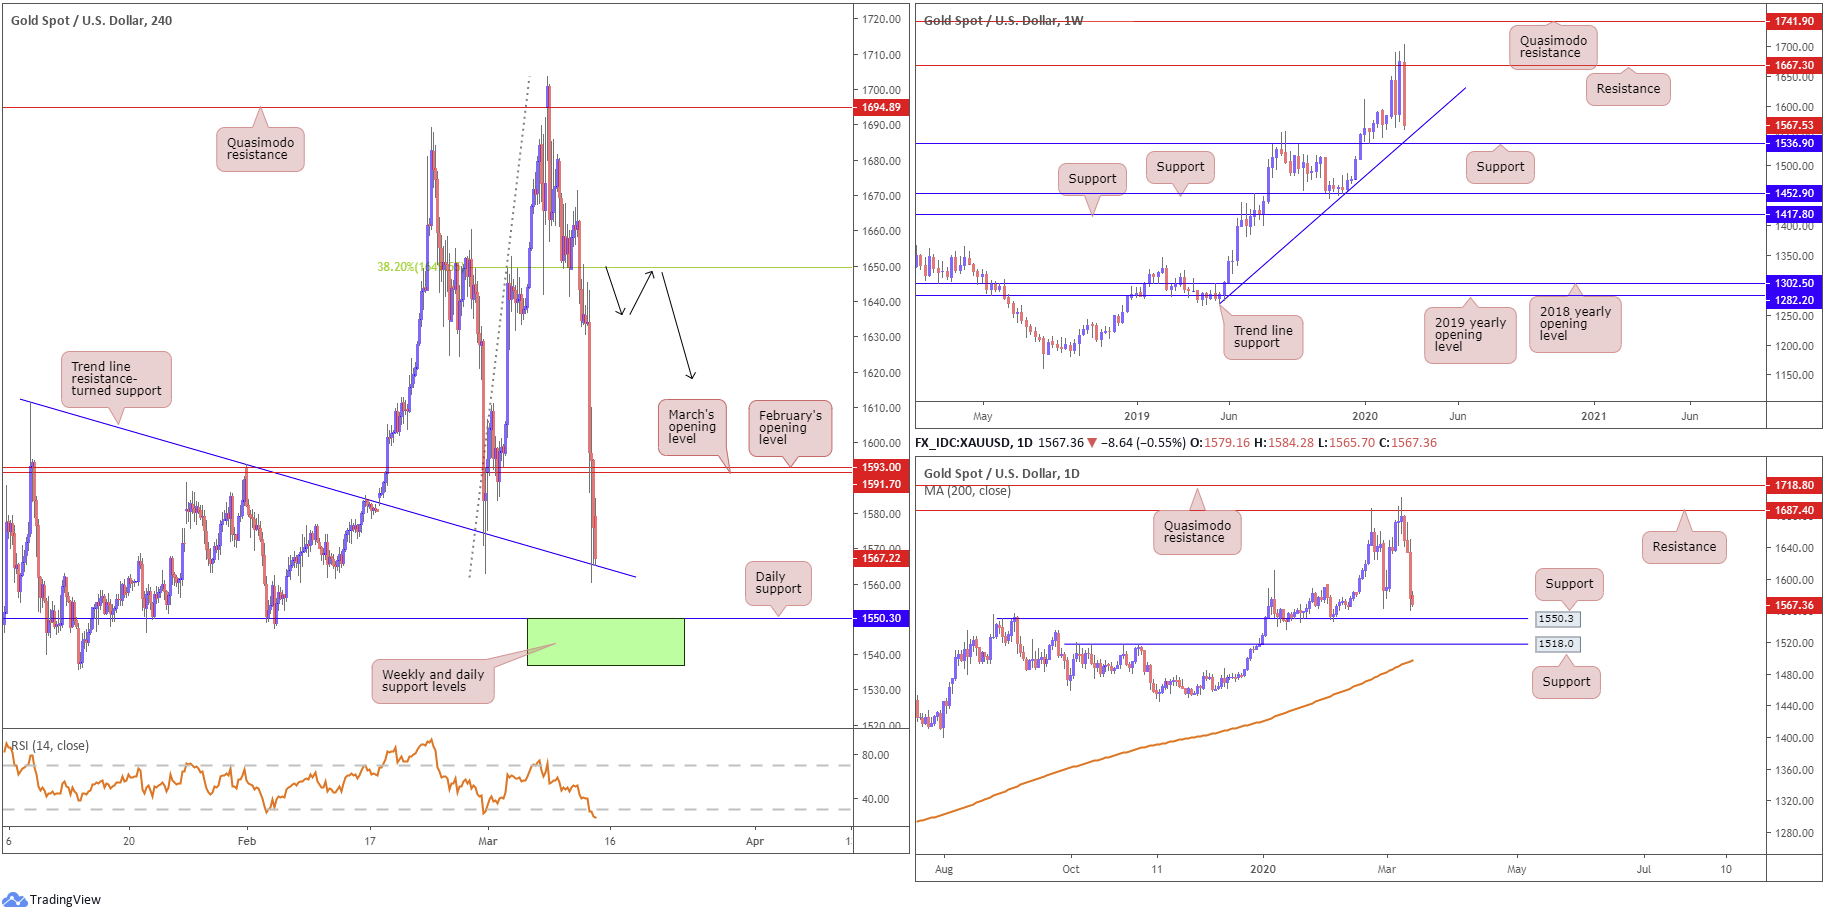
Weekly support failing to offer much of a ‘floor’ at 1667.3 (now serving resistance), as well as daily price navigating lower ground beneath resistance at 1687.4, may see further losses below 1649.9 (38.2% Fibonacci support) materialise on the H4 scale. A retest at 1649.9 will likely encourage sellers, particularly if the retest forms by way of a H4 bearish candlestick signal.
As per the black arrows on the H4 chart, price action retested 1649.9 and formed a shooting star candlestick pattern, considered a bearish signal at peaks. Well done to any readers who managed to take advantage of yesterday’s movement.
H4 structure shows March and February’s opening levels at 1591.7 and 1593.0 were taken out, leading to the unit rolling towards trend line resistance-turned support, taken from the high 1611.3, and hauling the RSI deep into oversold terrain. A push lower from here has daily support at 1550.3 to target. While over on the weekly timeframe, we can see trend line support, taken from the low 1269.6, next on tap, followed by support at 1536.9.
Areas of consideration:
Between 1536.9, the weekly support level, and 1550.3, the daily support base, traders likely expect a recovery attempt to occur, marked in green on the H4 timeframe. A move out of this zone could be sizeable, with the possibility of at least reaching March/February’s opening levels around 1590.0ish.
The accuracy, completeness and timeliness of the information contained on this site cannot be guaranteed. IC Markets does not warranty, guarantee or make any representations, or assume any liability regarding financial results based on the use of the information in the site.
News, views, opinions, recommendations and other information obtained from sources outside of www.icmarkets.com.au, used in this site are believed to be reliable, but we cannot guarantee their accuracy or completeness. All such information is subject to change at any time without notice. IC Markets assumes no responsibility for the content of any linked site.
The fact that such links may exist does not indicate approval or endorsement of any material contained on any linked site. IC Markets is not liable for any harm caused by the transmission, through accessing the services or information on this site, of a computer virus, or other computer code or programming device that might be used to access, delete, damage, disable, disrupt or otherwise impede in any manner, the operation of the site or of any user’s software, hardware, data or property.


