
EUR/USD:
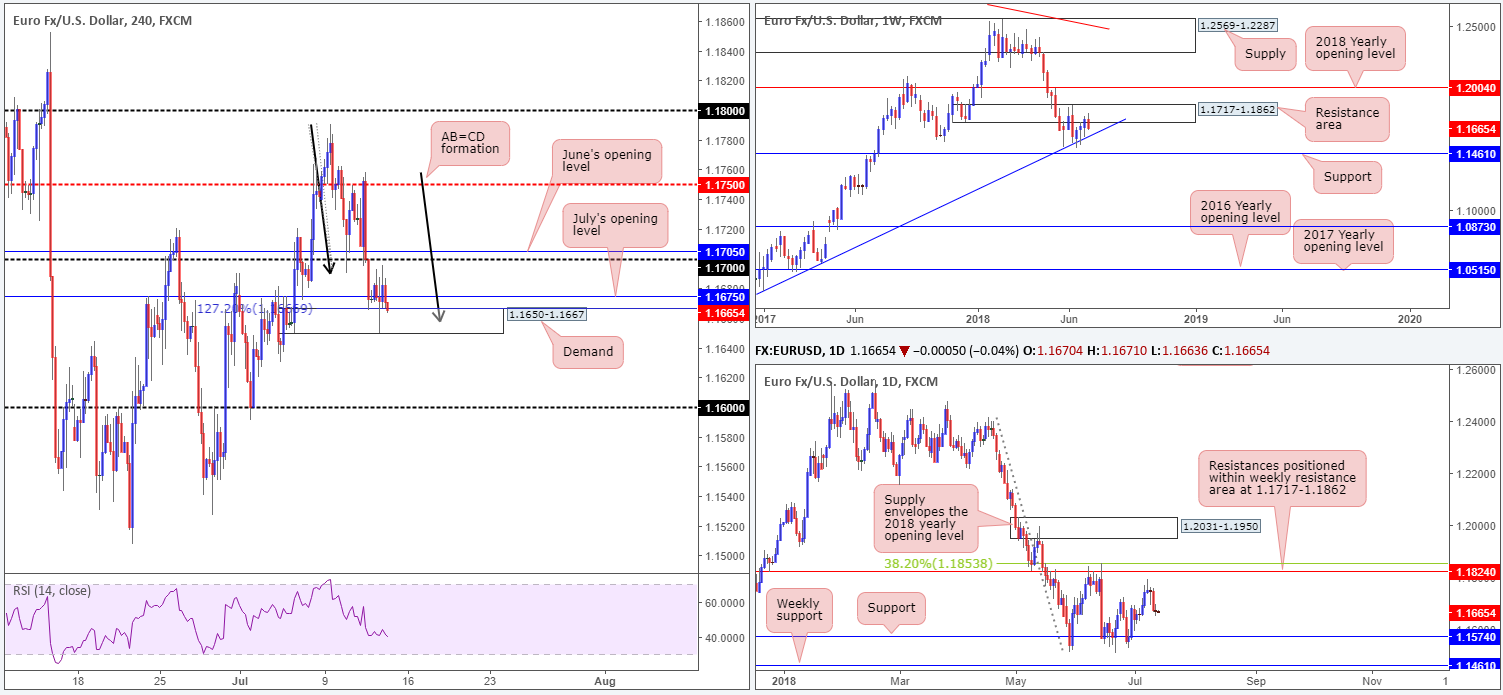
The single currency took on more of a sober approach throughout Thursday’s segment, consequently chalking up a clear-cut daily indecision candle.
H4 price remains toying with the top edge of demand at 1.1650-1.1667, which happens to converge with a H4 AB=CD (black arrows) 127.2% completion at 1.1666 and is positioned just south of July’s opening level at 1.1675. Beyond this area, the 1.16 handle is likely the next port of call.
Things over on the weekly picture, nevertheless, do not support our H4 demand. The resistance area at 1.1717-1.1862 is seen holding firm, with price action poised to retest nearby trend line support etched from the low 1.0340 (lower than our H4 zone). Further adding to this, we do not see much support stopping daily price from probing lower at least until we reach the 1.1574 mark (once again, lower than our H4 area).
In terms of economic data yesterday, US CPI posted a 0.1% m/m gain in June, below expectations of 0.2%. Core CPI was in line at 0.2%. The ECB also released its accounts of its June meeting, reiterating a dovish approach.
Areas of consideration:
Lack of interest from the buyers at H4 demand has us believing we’re potentially heading for lower levels soon.
As already highlighted above, a close below the current H4 demand likely opens downside to the 1.16 handle. Should the close be followed up with a retest of the broken H4 demand as resistance, this would, according to the overall technical picture, likely be sufficient evidence to suggest a short, targeting 1.16 (by this point, the weekly trend line support will also be in play), followed closely by daily support at 1.1574.
Today’s data points: US Prelim UoM consumer sentiment.
GBP/USD:
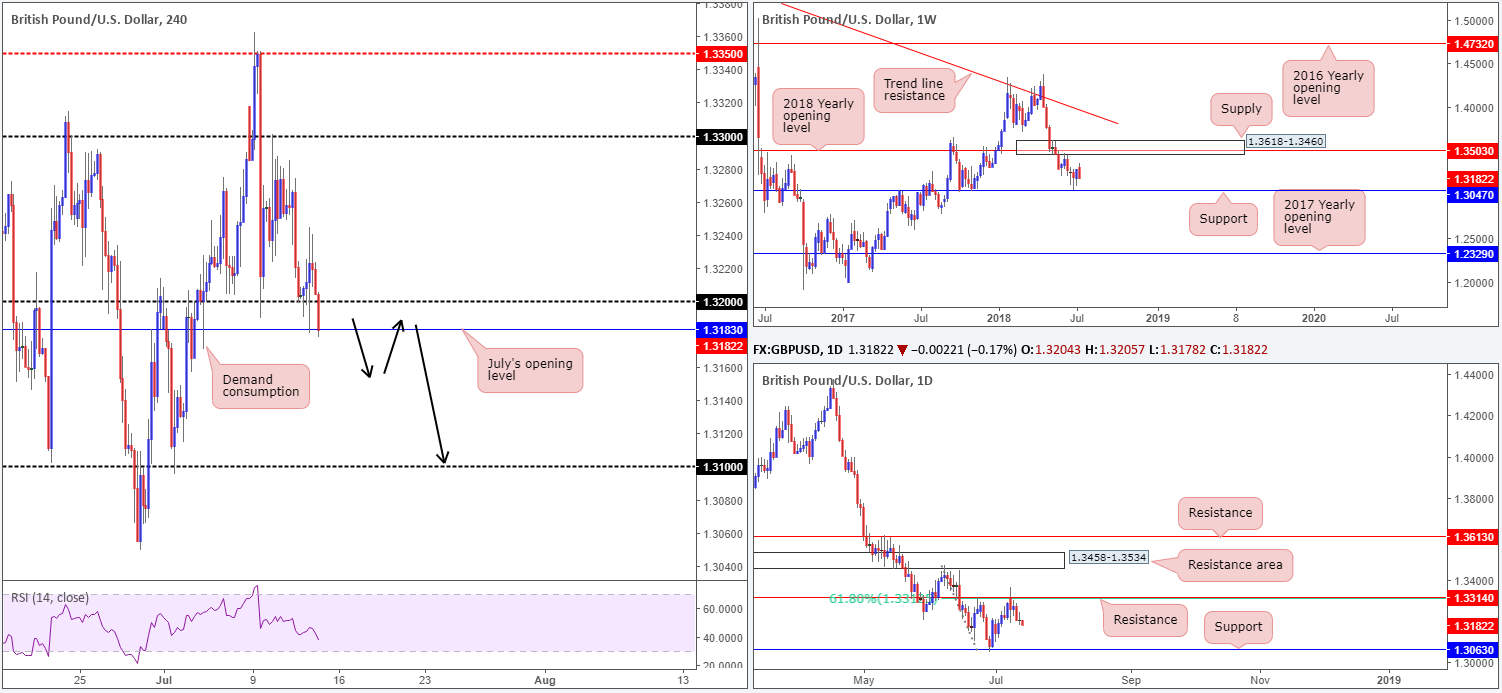
In recent sessions, traders witnessed the British pound spike to session highs of 1.3244 on the back of reasonably disappointing US inflation numbers. The move, however, was short-lived.
Despite the UK government publishing its White Paper that draws upon future relations with the European Union, GBP/USD movement was largely governed by the USD, ending the day somewhat indecisively.
As highlighted in Thursday’s briefing, although the 1.32 handle seen marked on the H4 timeframe has an additional layer of support seen beneath it at 1.3183: July’s opening level, higher-timeframe technicals suggest a move lower may be on the cards, with the closest support registered on the daily timeframe at 1.3063.
Areas of consideration:
In view of the market’s position on the higher timeframes, attempting to buy 1.3183/1.32 is a chancy move. A more conservative approach here we feel may be to wait and see if H4 price closes below 1.3183/1.32. A retest to underside of this small area that holds in the form of a full or near-full-bodied H4 bear candle would, in our humble view, be enough to attract sellers into the market, targeting the 1.31 handle, followed by daily support mentioned above at 1.3063.
Today’s data points: MPC member Cunliffe speaks; US Prelim UoM consumer sentiment.
AUD/USD:
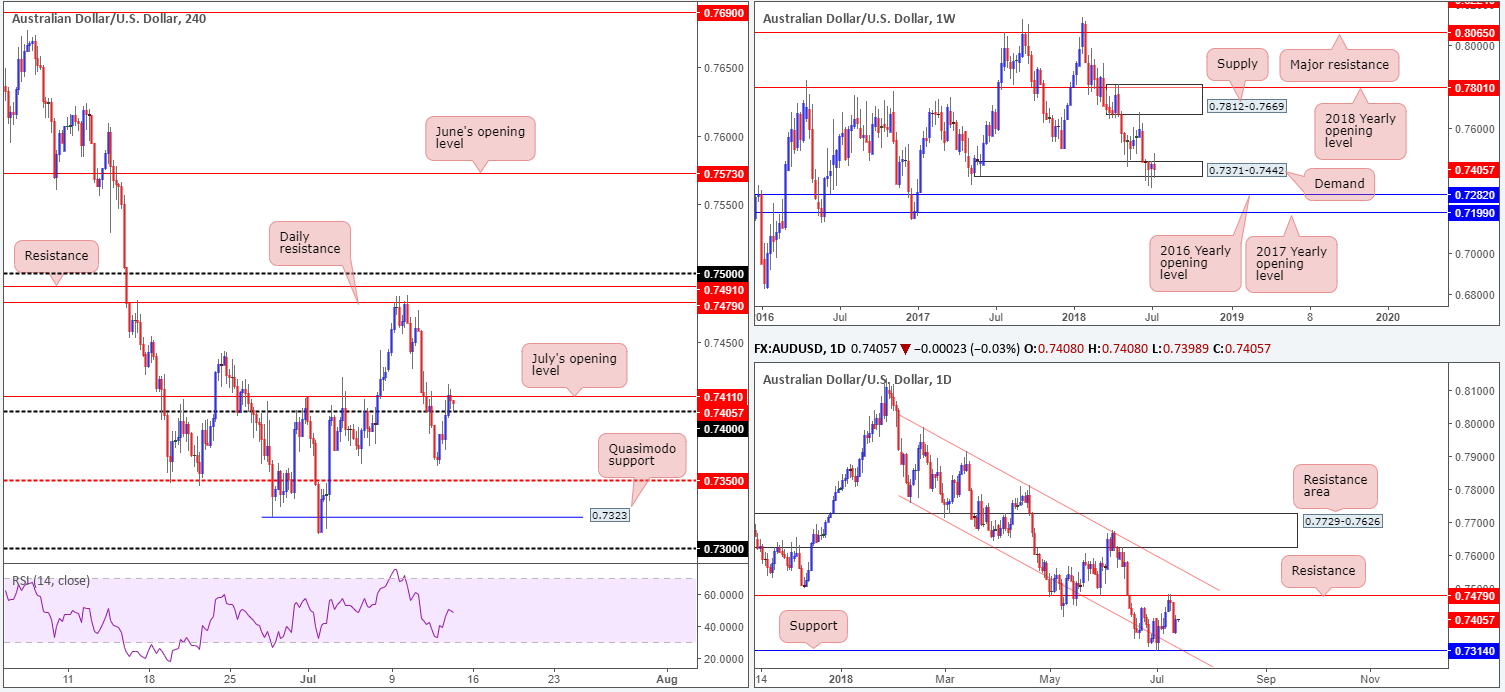
A better risk tone and stabilization in commodities helped the Aussie pare back some of Wednesday’s slide in recent trade. As you can see, the H4 candles breached the 0.74 handle and went on to clock highs of 0.7419 on the day. July’s opening level at 0.7411, however, is proving troublesome, forcing price action to retest the top edge of 0.74 this morning.
Weekly demand at 0.7371-0.7442 remains in a fragile state at the moment, opening the window to a possible test of the 2016 yearly opening level at 0.7282 sometime down the road. Daily movement, on the other hand, is seen trading mid-range between support coming in at 0.7314, which happens to converge closely with a daily channel support etched from the low 0.7758 (albeit not the prettiest one), and resistance plotted overhead at 0.7479.
Areas of consideration:
Ultimately, the team still has eyes on the 0.74 handle this morning. A H4 close (preferably full or near-full-bodied) back beneath this number would be a strong bearish cue, with downside targets set at the H4 mid-level support 0.7350, followed closely by H4 Quasimodo support at 0.7323. Why we are so bearish sub 0.74 largely stems from where we’re positioned on the higher timeframes. Weekly demand is suffering. We can all see this. On top of that, though, we also see room to probe lower on the daily timeframe to 0.7314.
Today’s data points: China trade balance; US Prelim UoM consumer sentiment.
USD/JPY:
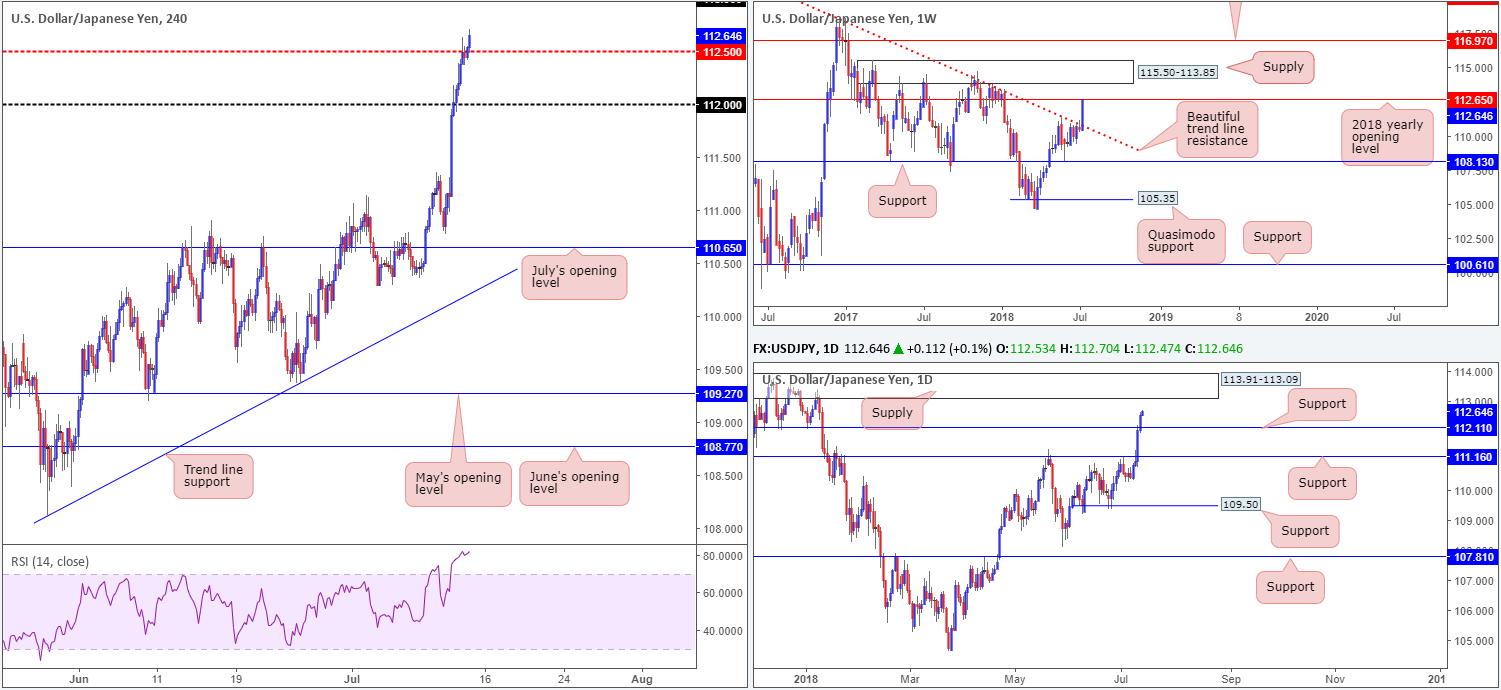
The Japanese yen extended its slump against its US counterpart on Thursday amid a more optimistic mood seen across the markets.
After crossing above the H4 mid-level resistance at 112.50 in recent trade, the next area of interest on the USD/JPY falls in around the 113 handle. That is, of course, if the buyers are able to overcome weekly resistance seen in the shape of a 2018 yearly opening level at 112.65. These levels tend to command attention, so don’t make the mistake of overlooking it! Things over on the daily timeframe, however, are supportive of higher prices until reaching supply penciled in at 113.91-113.09, following a dominant push above resistance (now acting support) at 112.11.
Areas of consideration:
According to H4 and daily structure, the pair still wants higher prices. The only grumble here, though, is weekly structure. To that end, irrespective of which direction one selects, you’ll face some form of critical structure – not the best trading conditions.
To our way of seeing things, an ideal scenario (a medium/long-term play) would be for daily price to print a bearish pin-bar formation that pierces above the weekly level and tags the lower edge of daily supply. Assuming our read is correct, the move would trip stops above the weekly barrier and offer liquidity to those looking to sell from the daily zone.
Today’s data points: US Prelim UoM consumer sentiment.
USD/CAD:
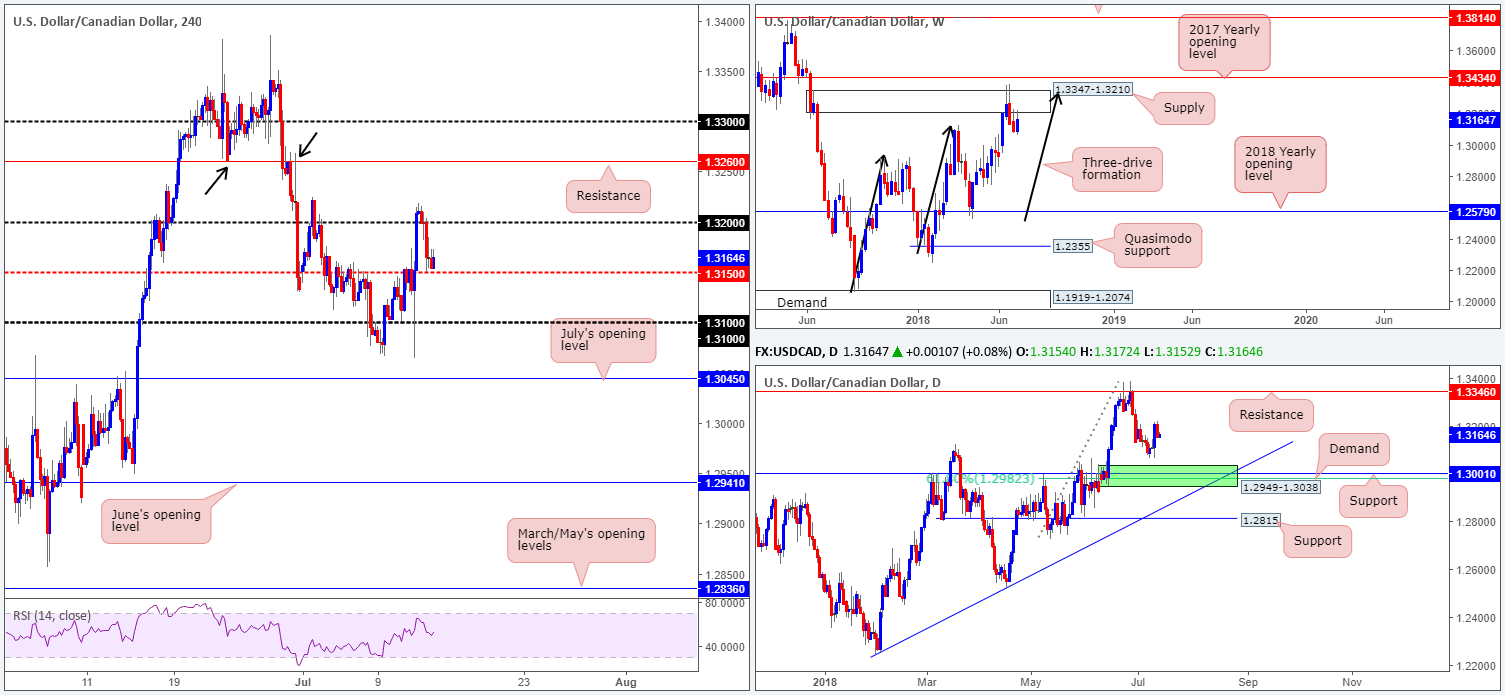
Despite tipping just above the 1.32 handle amid Wednesday’s close, the pair failed to sustain gains in early trade on Thursday. Dipping back beneath 1.32 as we headed into European hours, the pair took on a bearish stance and bottomed around the H4 mid-level support 1.3150. Buying interest from this level has been modest so far, with intraday highs of 1.3173 proving to be troublesome for lower-timeframe traders. Beyond 1.3150, there’s little support in view on the H4 scale until the 1.31 handle.
A move to the downside should not really have come as much of a surprise, considering weekly price reconnected with the underside of supply drawn from 1.3347-1.3210. Further adding to this, we don’t see much support on the daily scale until reaching 1.3001 (history dating back to Sept 2016), followed closely by a 61.8% Fib support value at 1.2982 (we can also see demand painted in green at 1.2949-1.3038 converging with these levels).
Areas of consideration:
Entering long off of 1.3150 is considered a low-probability trade, according to our read. With this in mind, attention turns to a break of 1.3150 and possible move down to 1.31. With a little bit of oomph we may even see July’s opening level at 1.3045 brought into the fray (this level sits within the top limit of daily demand mentioned above at 1.2949-1.3038).
To take advantage of a possible selloff, waiting for H4 price to close below 1.3150 and retest the level as resistance is an option. Should the retest print a reasonably solid H4 bearish candle (preferably a full or near-full-bodied formation), shorts on the close of this candle are likely to at least reach 1.31 (stops best placed above candle’s rejection wick).
Today’s data points: US Prelim UoM consumer sentiment.
USD/CHF:
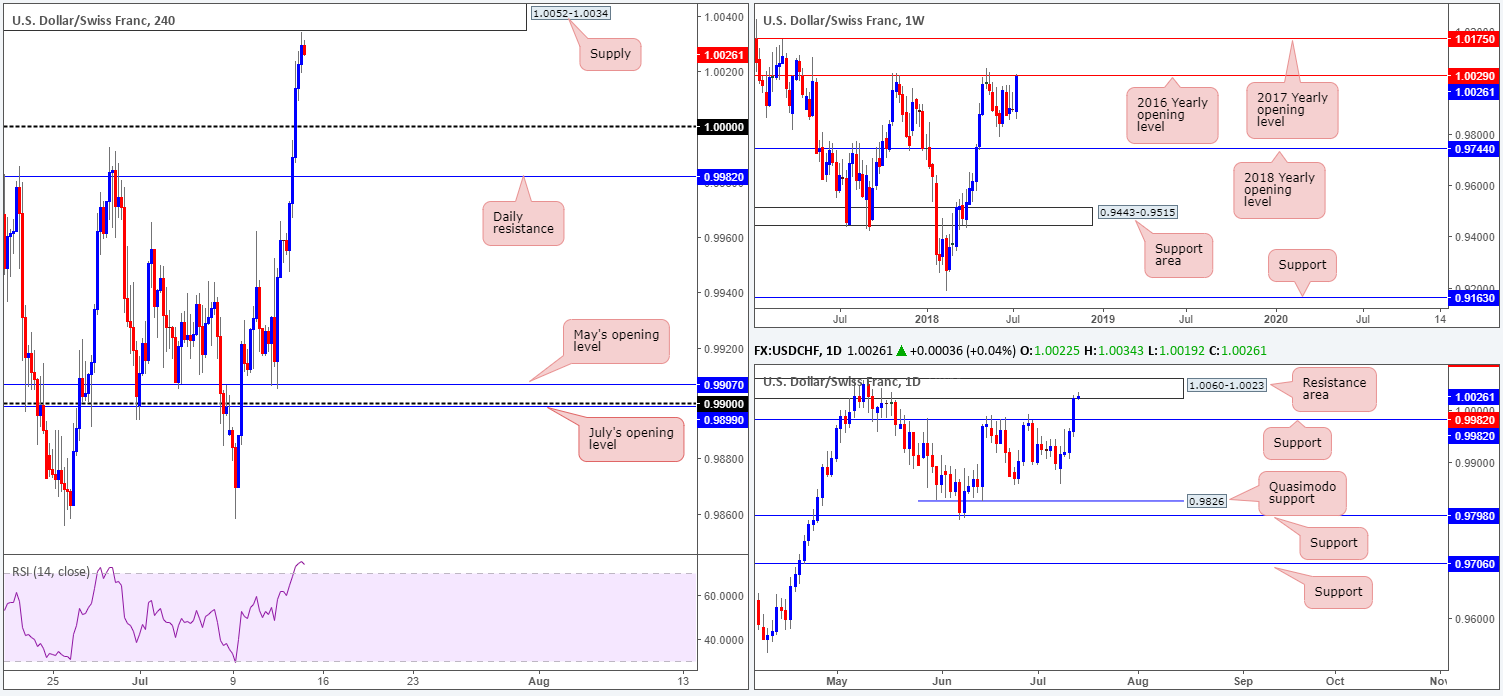
USD/CHF bulls went on the offensive once again on Thursday, extending gains for a fourth consecutive day. Diminishing demand for safe-haven assets lifted the pair above the key figure 1.0000 (parity) to just south of H4 supply coming in at 1.0052-1.0034.
Higher-timeframe flows also connected with significant structure. Weekly price shook hands with the underside of the 2016 yearly opening level at 1.0029, while daily price crossed swords with a resistance area drawn from 1.0060-1.0023 (a zone that encapsulates the noted 2016 open barrier).
Areas of consideration:
According to structure, USD demand may come to an end soon. In fact, should H4 price print a full or near-full-bodied reaction at current price, this will likely draw sellers into the market, targeting 1.0000, followed by daily support at 0.9982. Should any of our readers be interested in this move, placing stops above the candle’s rejection wick is likely best in order to achieve reasonably satisfactory risk/reward.
Today’s data points: US Prelim UoM consumer sentiment.
Dow Jones Industrial Average:
Improved risk appetite and easing concerns over trade conflict allowed the DJIA to strongly push higher on Thursday. In terms of weekly positioning, price is now seen trading above its 2018 yearly opening band at 24660. Continued support here could see a test of the weekly trend line resistance drawn from the high 25807.
A closer look at price action on the daily timeframe has brought the spotlight to daily resistance plotted at 24988, which also happens to represent a Quasimodo resistance taken from the left shoulder at 25071, seen marked with a green arrow. As you can see on the H4 timeframe, though, the candles are trading within the limits of an active sell zone formed from daily resistance mentioned above at 24988 and H4 resistance penciled in at 24891. So far, we’ve yet to see anything meaningful printed from the sellers here.
Areas of consideration:
With 24988/24891 brought back into the fray on the H4 timeframe, the team has noted to watch this area for possible shorting opportunities should H4 price chalk up a full or near-full-bodied bearish candle. We need this formation to show bearish intent. Without it, we see a potential breach of daily resistance, and even a possible move up to the noted weekly trend line resistance playing out.
Today’s data points: US Prelim UoM consumer sentiment.

XAU/USD (Gold)
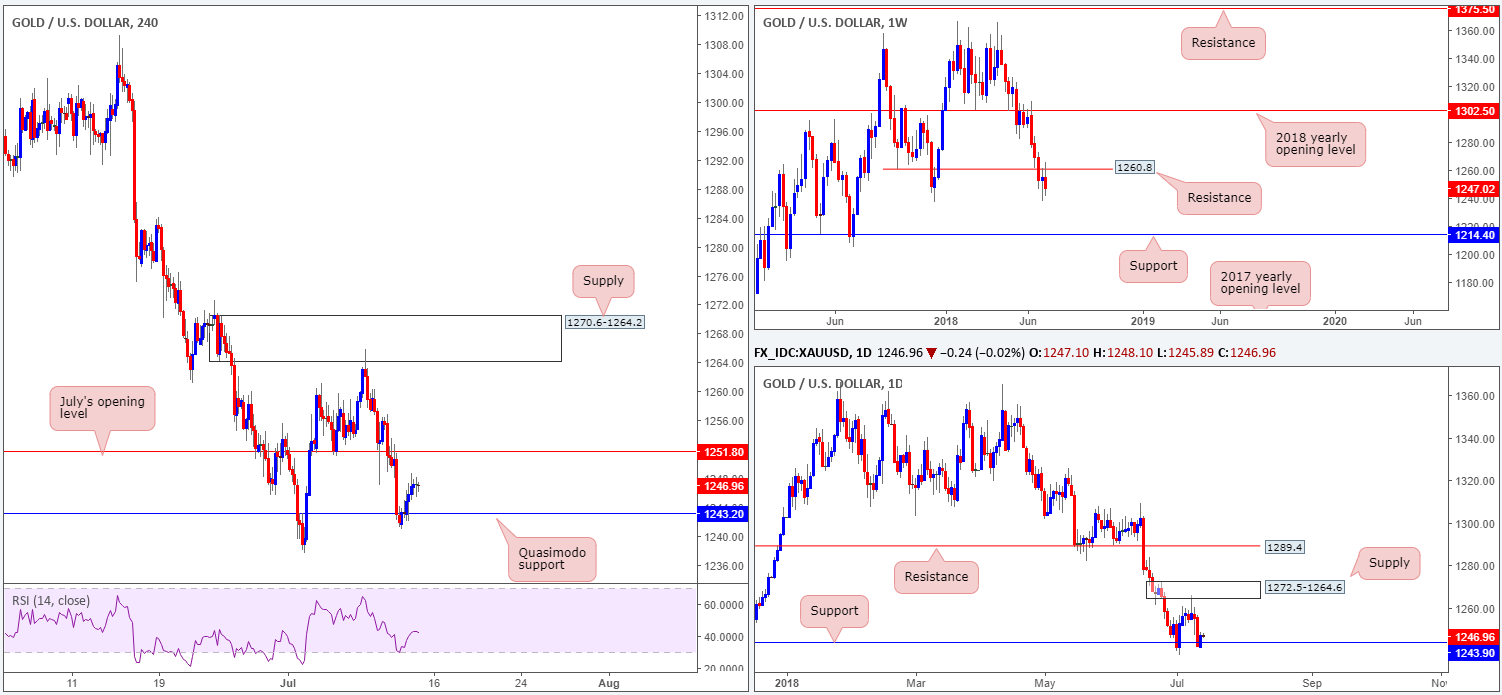
Despite a mild breach of H4 Quasimodo support at 1243.2, Thursday’s session witnessed active buyers come in to the market from here, mildly paring a portion of recent losses. It is worth pointing out, though, that the H4 level does have the backing of a daily support level at 1243.9. Further buying in this market has July’s opening level seen on the H4 timeframe at 1251.8 to target, while daily action likely has its eyes on supply coming in at 1272.5-1264.6.
Although we see room to advance in this market, let’s remember where we are coming from on the weekly timeframe: the underside of resistance at 1260.8. The response from this level thus far has been impressive. Additional selling from this point could eventually bring the yellow metal down as far as weekly support at 1214.4.
Areas of consideration:
In light of the difference of opinion being seen between the H4/daily and weekly timeframes in this market, this is a difficult market to trade. However, we will be keeping close tabs on July’s opening level mentioned above on the H4 timeframe at 1251.8 for a possible bounce lower, given how well it has held over the past couple of weeks as support/resistance.
The use of the site is agreement that the site is for informational and educational purposes only and does not constitute advice in any form in the furtherance of any trade or trading decisions.
The accuracy, completeness and timeliness of the information contained on this site cannot be guaranteed. IC Markets does not warranty, guarantee or make any representations, or assume any liability with regard to financial results based on the use of the information in the site.
News, views, opinions, recommendations and other information obtained from sources outside of www.icmarkets.com.au, used in this site are believed to be reliable, but we cannot guarantee their accuracy or completeness. All such information is subject to change at any time without notice. IC Markets assumes no responsibility for the content of any linked site. The fact that such links may exist does not indicate approval or endorsement of any material contained on any linked site.
IC Markets is not liable for any harm caused by the transmission, through accessing the services or information on this site, of a computer virus, or other computer code or programming device that might be used to access, delete, damage, disable, disrupt or otherwise impede in any manner, the operation of the site or of any user’s software, hardware, data or property.


