
Key risk events today:
US Core Retail Sales m/m; US Retail Sales m/m.
EUR/USD:
In recent hours, EUR/USD bulls strengthened their grip, elevated on the back of exit polls out of the UK which show a landslide majority in favour of PM Johnson’s Conservatives.
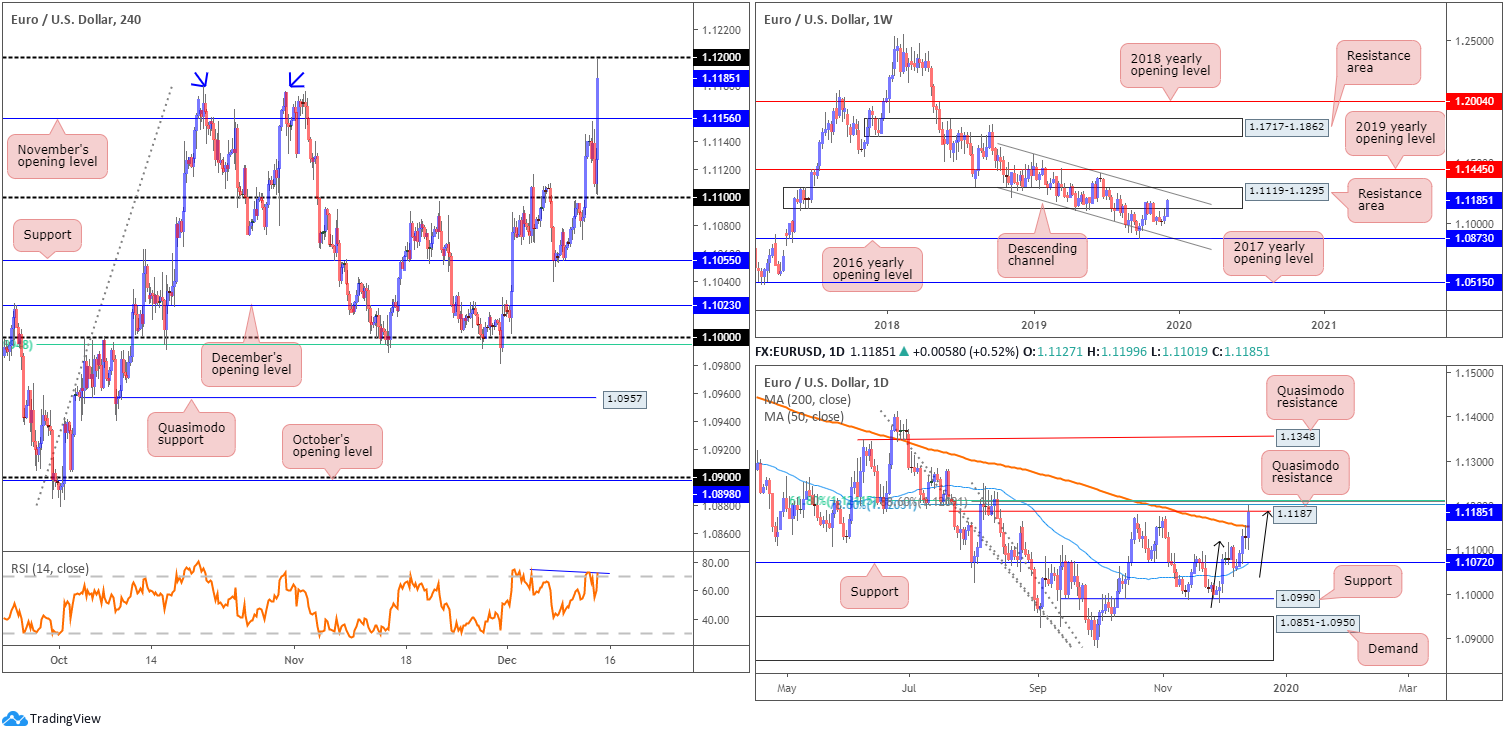
Consequently, 1.12 entered the fray as possible resistance on the H4 after price dethroned a double top formation at 1.1176 (blue arrows). The next port of call, in terms of support, falls in close by at November’s opening level drawn from 1.1156, with a break of this base exposing 1.11. Above 1.11, limited supply is evident until reaching 1.1275ish. Indicator-based traders may also wish to note the relative strength index (RSI) is producing bearish divergence out of overbought terrain (blue line).
On more of a broader perspective, the long-standing resistance area at 1.1119-1.1295 based on the weekly timeframe is under pressure. Channel resistance, extended from the high 1.1569, however, may help preserve this zone, as it intersects with the upper edge of this base.
Daily price overthrew its 200-day SMA (orange – 1.1153) in strong fashion yesterday. Although likely to inspire further buying, Quasimodo resistance at 1.1187, coupled with a Fibonacci cluster around the 1.1206 neighbourhood, may hamper upside today. What’s also notable from a technical perspective is the bearish ABCD correction (black arrows) that terminates at the aforementioned Quasimodo resistance.
Areas of consideration:
While momentum favours upside, robust resistance on weekly, daily and H4 timeframes is problematic. Clearance of 1.12 on the H4, although considered a bullish indicator among price action traders, faces immediate resistance from the daily Fibonacci cluster pattern.
Sell 1.12? It is certainly a possibility, according to market structure. However, ideally, a stop-run above 1.12 to draw in sellers from the daily Fibonacci cluster may be the stronger alternative, before pulling the trigger. This may form in the shape of a shooting star candlestick pattern. Traders are also urged to ensure risk/reward metrics offer favourable values to November’s opening level at 1.1156, the first support target.
GBP/USD:
Sterling initially dipped south of 1.31, testing the waters around 1.3050 amid dollar strength. However, a reversal was seen at the tail end of yesterday’s session as UK journalist reports aired positive vibes in favour of the Conservatives.
In recent hours, the pound surged to highs of 1.3514 as UK election exit polls show Conservatives are set to win 368 seats, Labour 191, Lib Dems 13, SNP 55, Brexit Party 0, Greens 1.
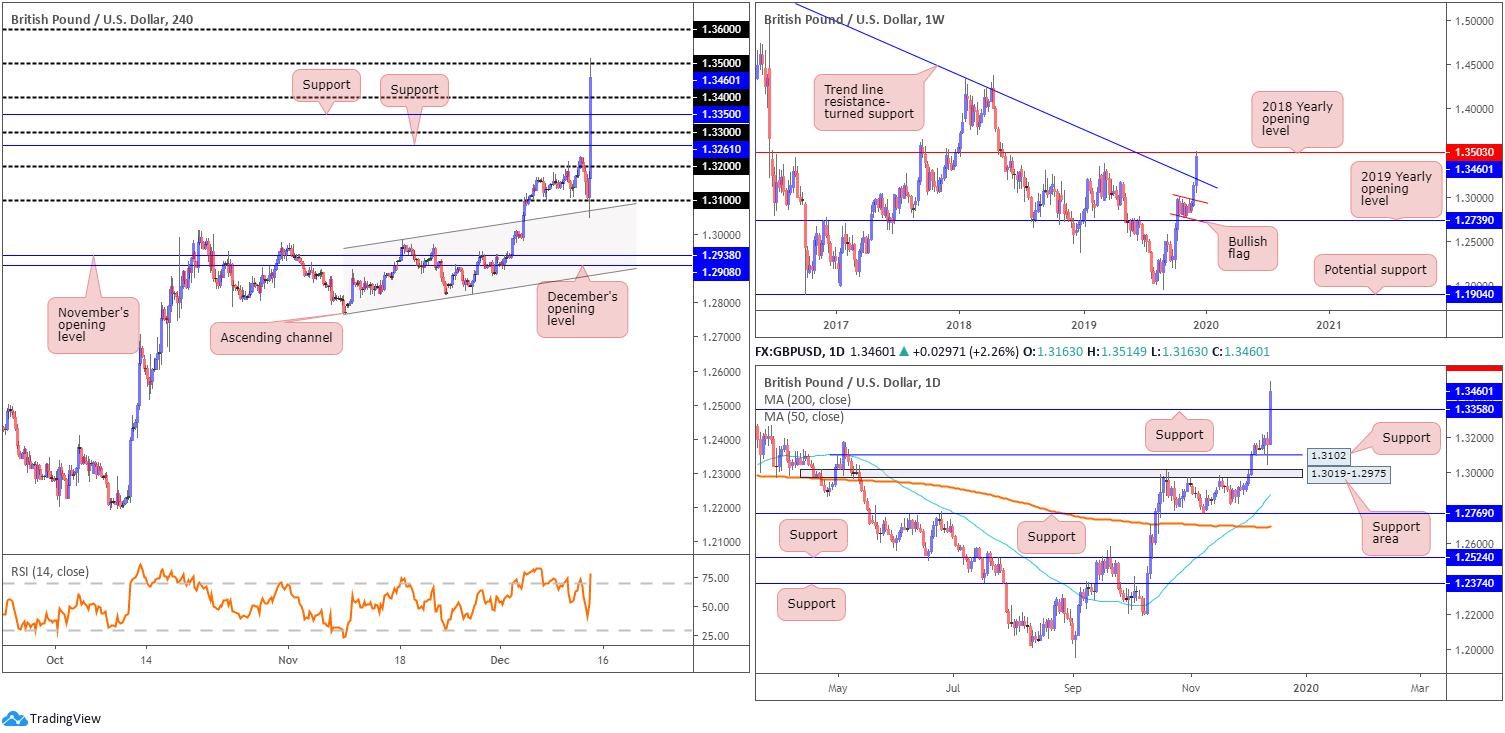
Technically, GBP/USD trades a touch beneath 1.35, as of writing. To the downside, a number of supports are visible. 1.33 and 1.34 are in view, as are two layers of support at 1.3261 and 1.3350, both of which are Quasimodo resistance-turned support. Further upside, nonetheless, could approach 1.36.
Weekly price extended gains out of the noted bullish flag pattern, formed just north of the 2019 yearly opening level at 1.2739. Note yesterday’s move higher absolutely murdered long-term buy stops above the 1.3380 March high and shook hands with the 2018 yearly opening level at 1.3503.
Daily movement also crossed above strong resistance at 1.3358 (now acting support) in recent trading, consequently exposing 1.3622 as the next upside resistance target (not visible on the screen).
Areas of consideration:
Volatility remains incredibly high in GBP markets as we enter Asia Pac hours.
The 2018 yearly opening level highlighted above at 1.3503 is likely to hold active sellers. It’s also an attractive area to fade buy stops taken from the 1.3380 March high. Weekly price shows a pullback from this angle could retest trend line resistance-turned support, extended from the high 1.5930. The threat of additional buying on the daily timeframe to 1.3622, nonetheless, may deter some traders.
AUD/USD:
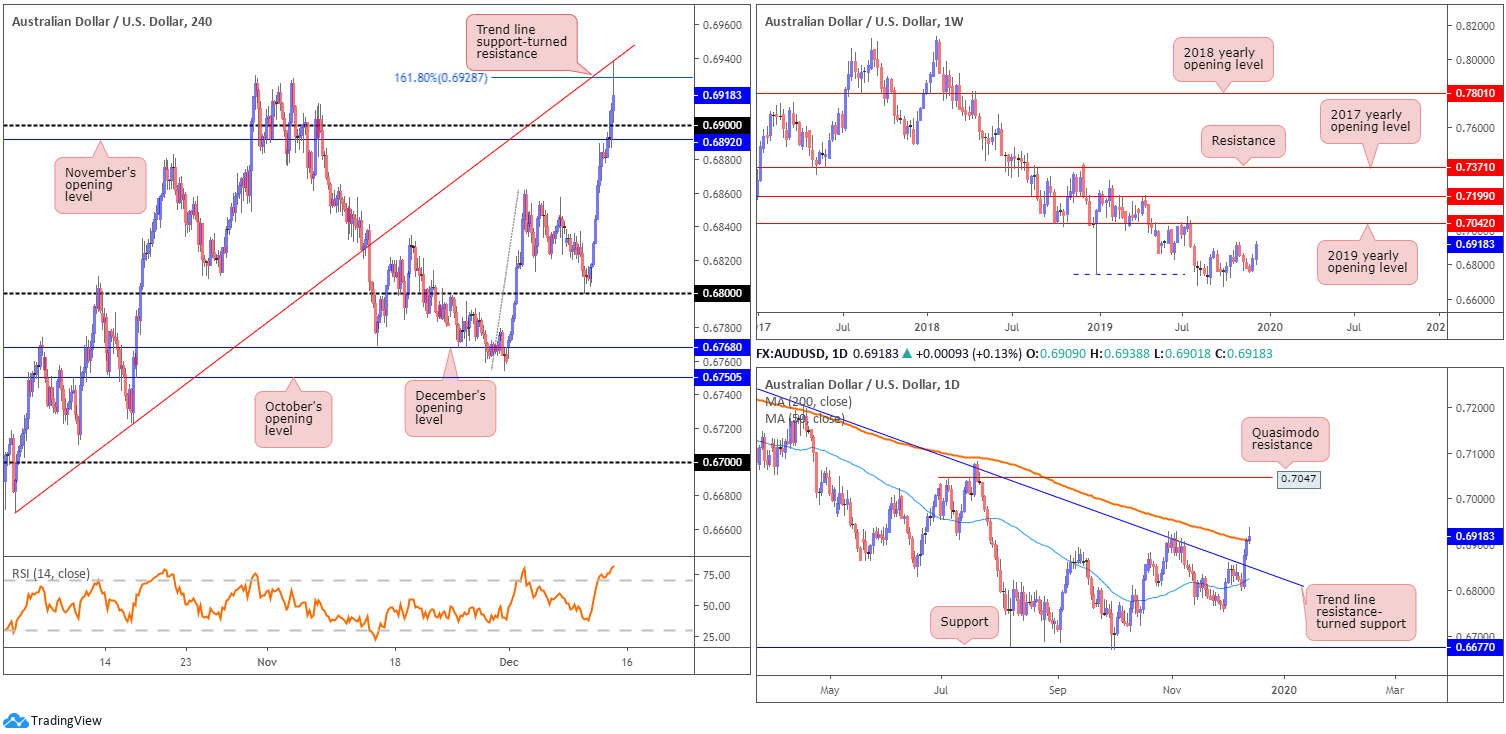
Kicking things off with a look at the weekly timeframe this morning, price action continues to step higher following September’s 0.6670 low. Continued bidding has the 2019 yearly opening level at 0.7042 to target, a robust area that has proven significant in the past.
A closer reading of price action on the daily timeframe shows the unit traded through trend line resistance, taken from the high 0.7393, and is now crossing swords with the 200-day SMA (orange – 0.6909). Note the unit has traded south of the said SMA since April 2019. A decisive move north of this value could set the stage for a run towards Quasimodo resistance at 0.7047.
Across the page on the H4 timeframe, buy stops above the 0.69 handle were tripped in recent movement, allowing an approach to trend line support-turned resistance, etched from the low 0.6670. In addition to this, resistance also forms by way of the 161.8% Fibonacci ext. point at 0.6928. November’s opening level at 0.6892 is also a noteworthy level to keep a tab on as potential support.
The relative strength index (RSI), for any indicator-based traders, trades firmly in overbought territory.
Areas of consideration:
A retest at 0.69 could be on the cards today, fuelled by selling off the current H4 trend line resistance/200-day SMA. A violation of 0.69 potentially opens the door to bearish themes, targeting 0.6855ish, followed by 0.6840, the daily trend line resistance-turned support.
USD/JPY:
USD/JPY jumped from 108.60 to 109.30 in recent trading, lifted on the back of trade headlines and a healthy rally in US Treasury yields. According to reports, China and the US struck an agreement on some tariff reductions and a delay to the tariffs that were due to come into effect on December 15th. US equities also traded firmer, with the DJIA recently recording fresh all-time peaks at 28256.
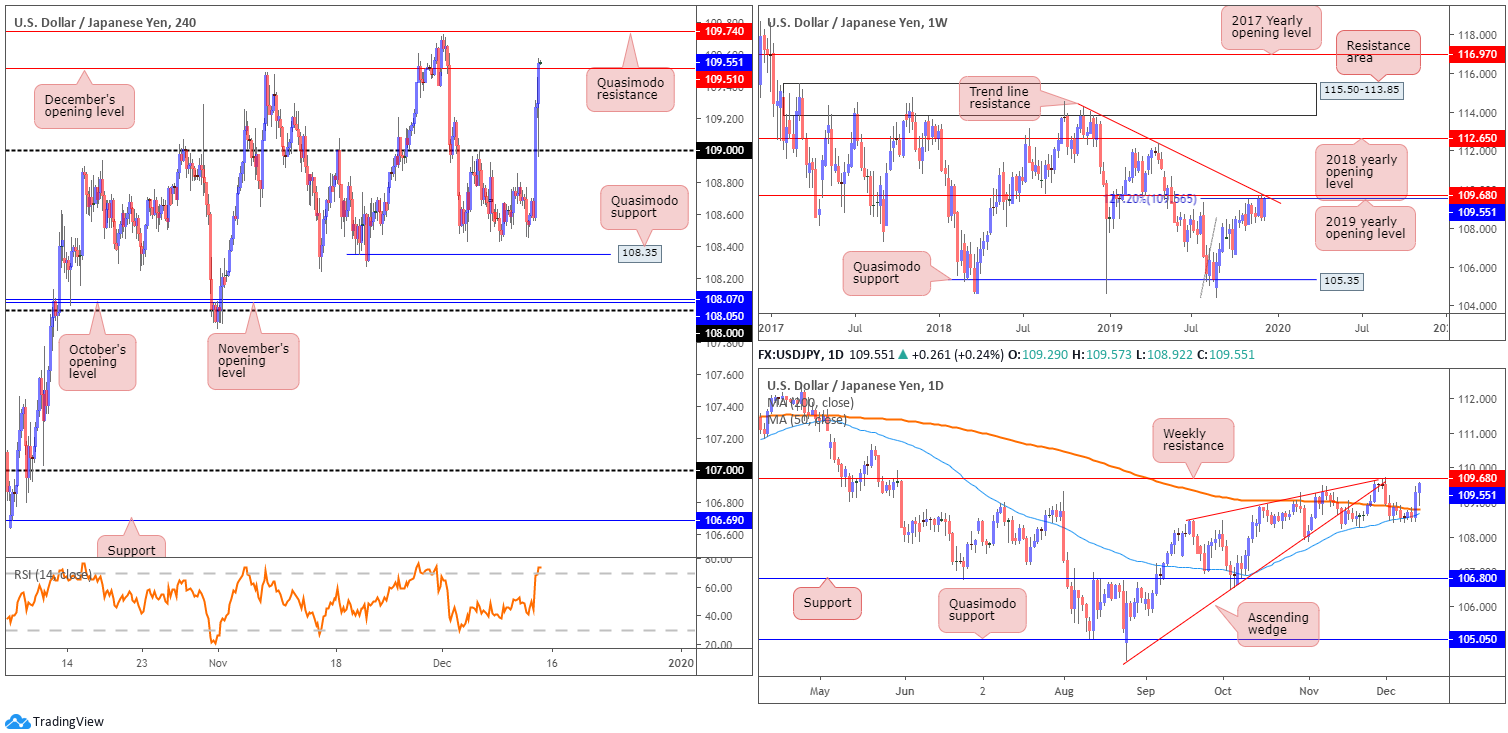
From a technical standpoint, weekly movement shows recent gains reclaimed the prior week’s losses and is touching gloves with a collection of notable resistances: a 127.2% Fibonacci ext. point at 109.56 (taken from the low 104.44), resistance formed at 109.68, the 2019 yearly opening level and trend line resistance, extended from the high 114.23.
Daily action, like weekly price, is seen approaching weekly resistance at 109.68. This follows a breakout north of the 200-day SMA (orange – 108.78).
December’s opening level at 109.51, based on the H4 timeframe, is currently under pressure. A violation of this base opens the road north to Quasimodo resistance at 109.74. It might also interest some traders to note the relative strength index (RSI) trades within overbought territory.
Areas of consideration:
H4 Quasimodo resistance mentioned above at 109.74 appears a solid platform for potential shorts today. Knowing it merges closely with weekly resistance at 109.68 adds considerable weight. Therefore, should a H4 bearish candlestick signal develop from this region today, a sell based on this pattern could certainly be an option. Ultimately, traders will be looking for a push south of December’s opening level at 109.51 from here, targeting 109 as the initial downside take-profit zone.
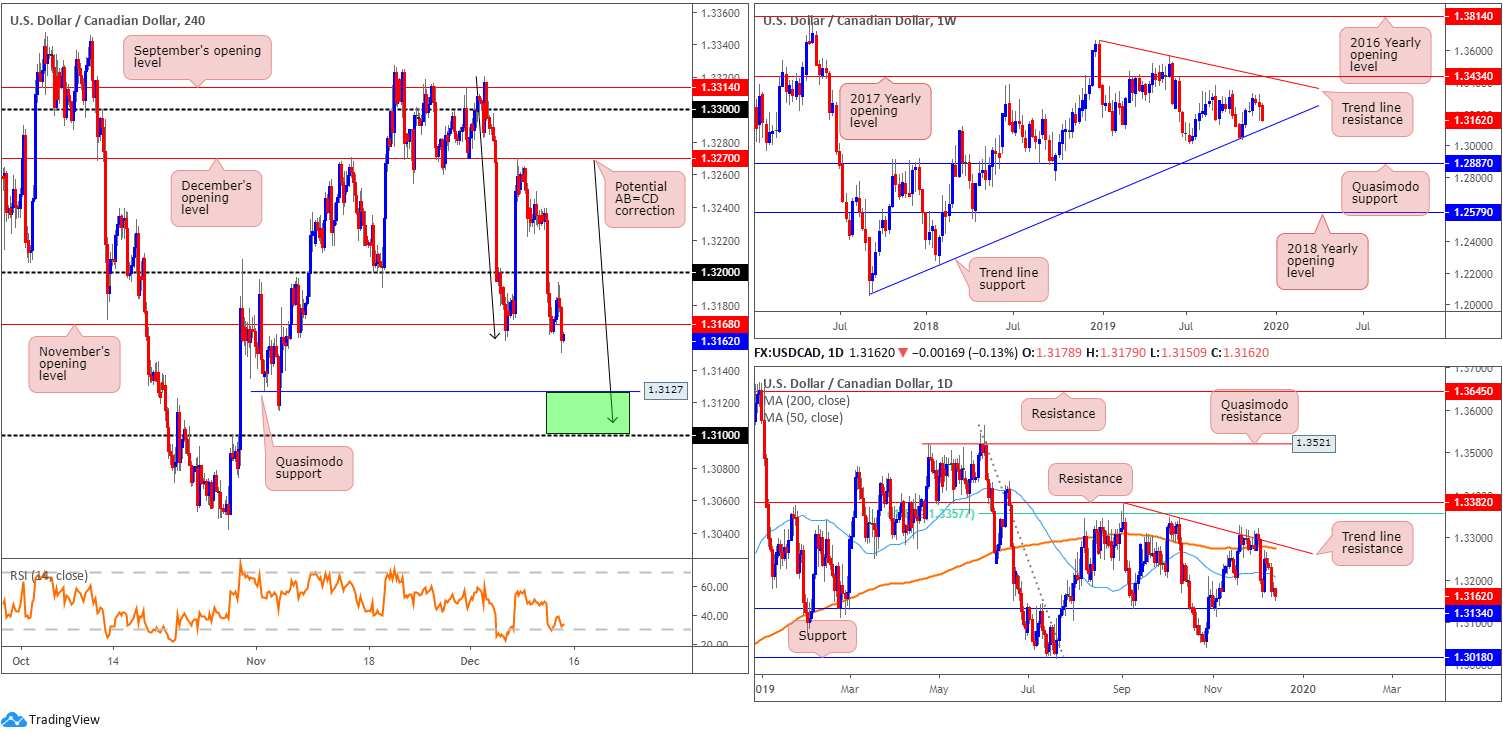
USD/CAD:
November’s opening level at 1.3168, based on the H4 timeframe, gave way in recent trade, highlighting a possible move to Quasimodo support at 1.3127, closely trailed by the 1.31 handle. Technicians may also find use in the potential AB=CD correction (black arrows), terminating a few points north of 1.31. For this reason, 1.31/1.3127 (green) marks a potential reversal zone on the H4 scale today.
Daily support comes in at 1.3134, while a weekly trend line support, extended from the low 1.2061, also intersects with the 1.31/1.3127 H4 support zone.
Areas of consideration:
Keeping things simple this morning, a H4 bullish candlestick signal formed from 1.31/1.3127 today could be enough to entice buyers into the market, with an initial upside objective set at November’s opening level 1.3168. The reason behind requiring additional candlestick confirmation is due to the fact round numbers (1.31) often fall victim to whipsaws (or stop-runs). This just helps avoid the dreaded whipsaw.
The accuracy, completeness and timeliness of the information contained on this site cannot be guaranteed. IC Markets does not warranty, guarantee or make any representations, or assume any liability regarding financial results based on the use of the information in the site.
News, views, opinions, recommendations and other information obtained from sources outside of www.icmarkets.com.au, used in this site are believed to be reliable, but we cannot guarantee their accuracy or completeness. All such information is subject to change at any time without notice. IC Markets assumes no responsibility for the content of any linked site.
The fact that such links may exist does not indicate approval or endorsement of any material contained on any linked site. IC Markets is not liable for any harm caused by the transmission, through accessing the services or information on this site, of a computer virus, or other computer code or programming device that might be used to access, delete, damage, disable, disrupt or otherwise impede in any manner, the operation of the site or of any user’s software, hardware, data or property.


