
DXY:
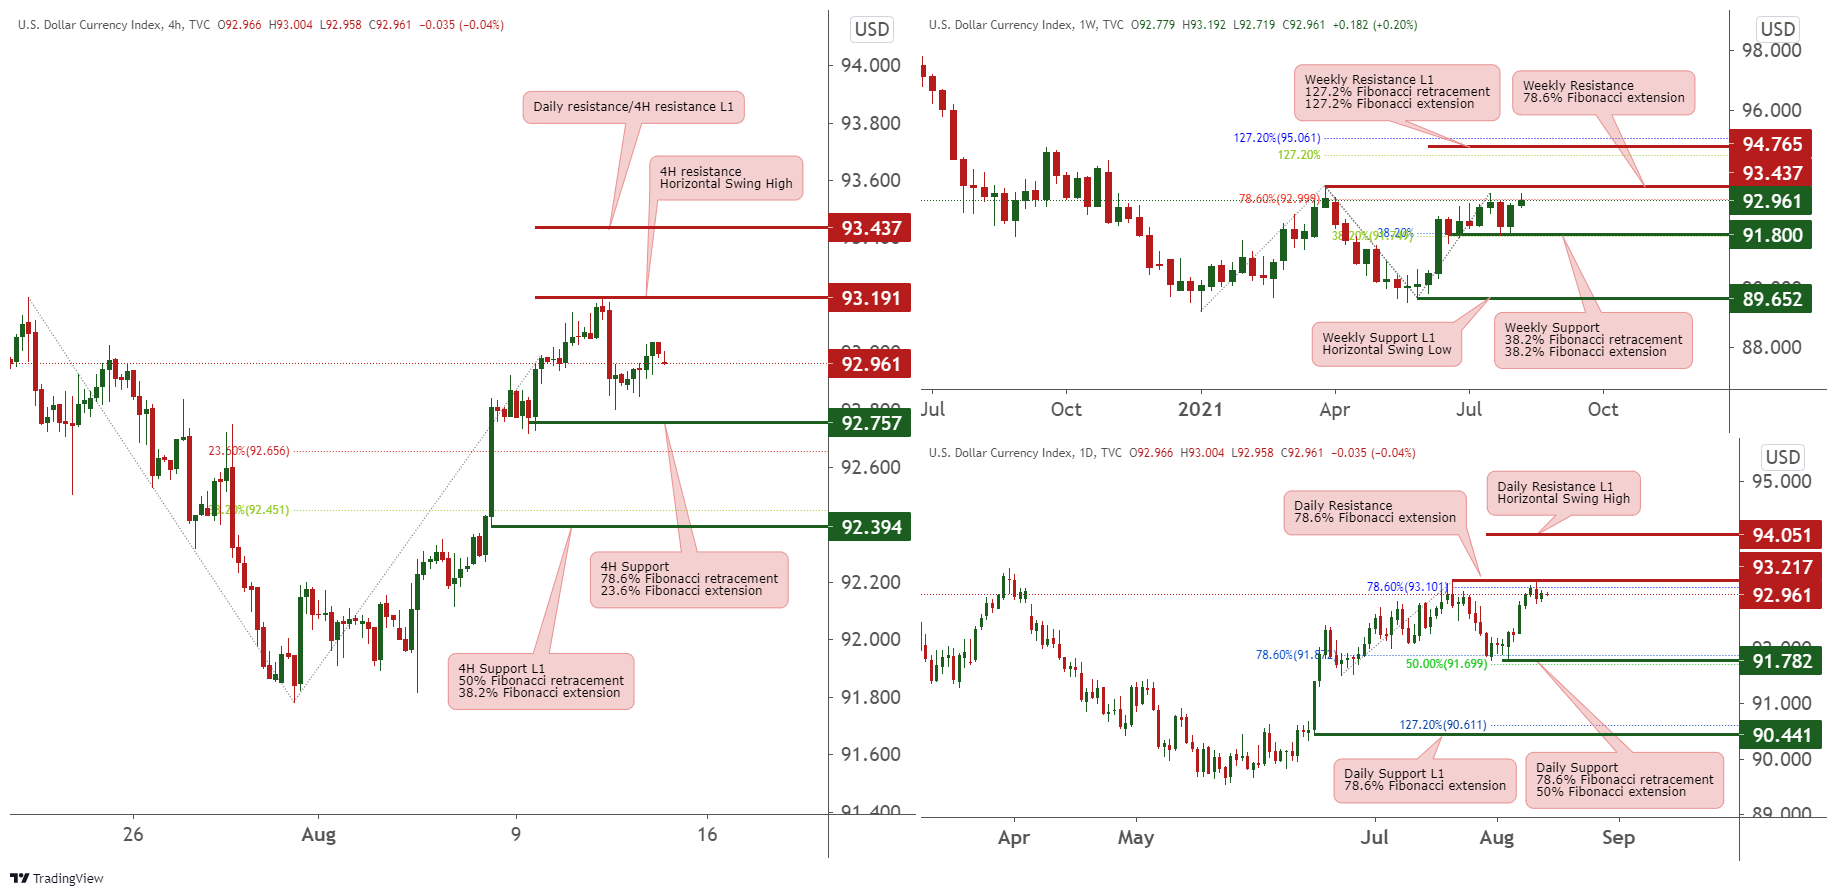
Looking at the Weekly chart price may bearish towards the weekly support at 91.8 in line with 38.2% Fibonacci retracement and 38.2% Fibonacci extension. On the other hand, price may bullish towards the weekly resistance L1 at 94.765 in line with 127.2% Fibonacci retracement and 127.2% Fibonacci extension.
On the Daily timeframe, price barish towards the daily support at 91.782 in line with 78.6% Fibonacci retracement and 50% Fibonacci extension. On the other hand, price may bullish towards the daily resistance L1 at 94.051 in line with horizontal swing high.
On the 4H timeframe, price may bearish towards the 4H support L1 at 92.394 in line with 50% Fibonacci retracement and 38.2% Fibonacci extension. On the other hand, price may bullish towards the 4H resistance at 93.191 in line with Horizontal swing high.
Areas of consideration:
- 4H resistance of 93.191
- 4H support L1 of 92.394
XAU/USD (GOLD):
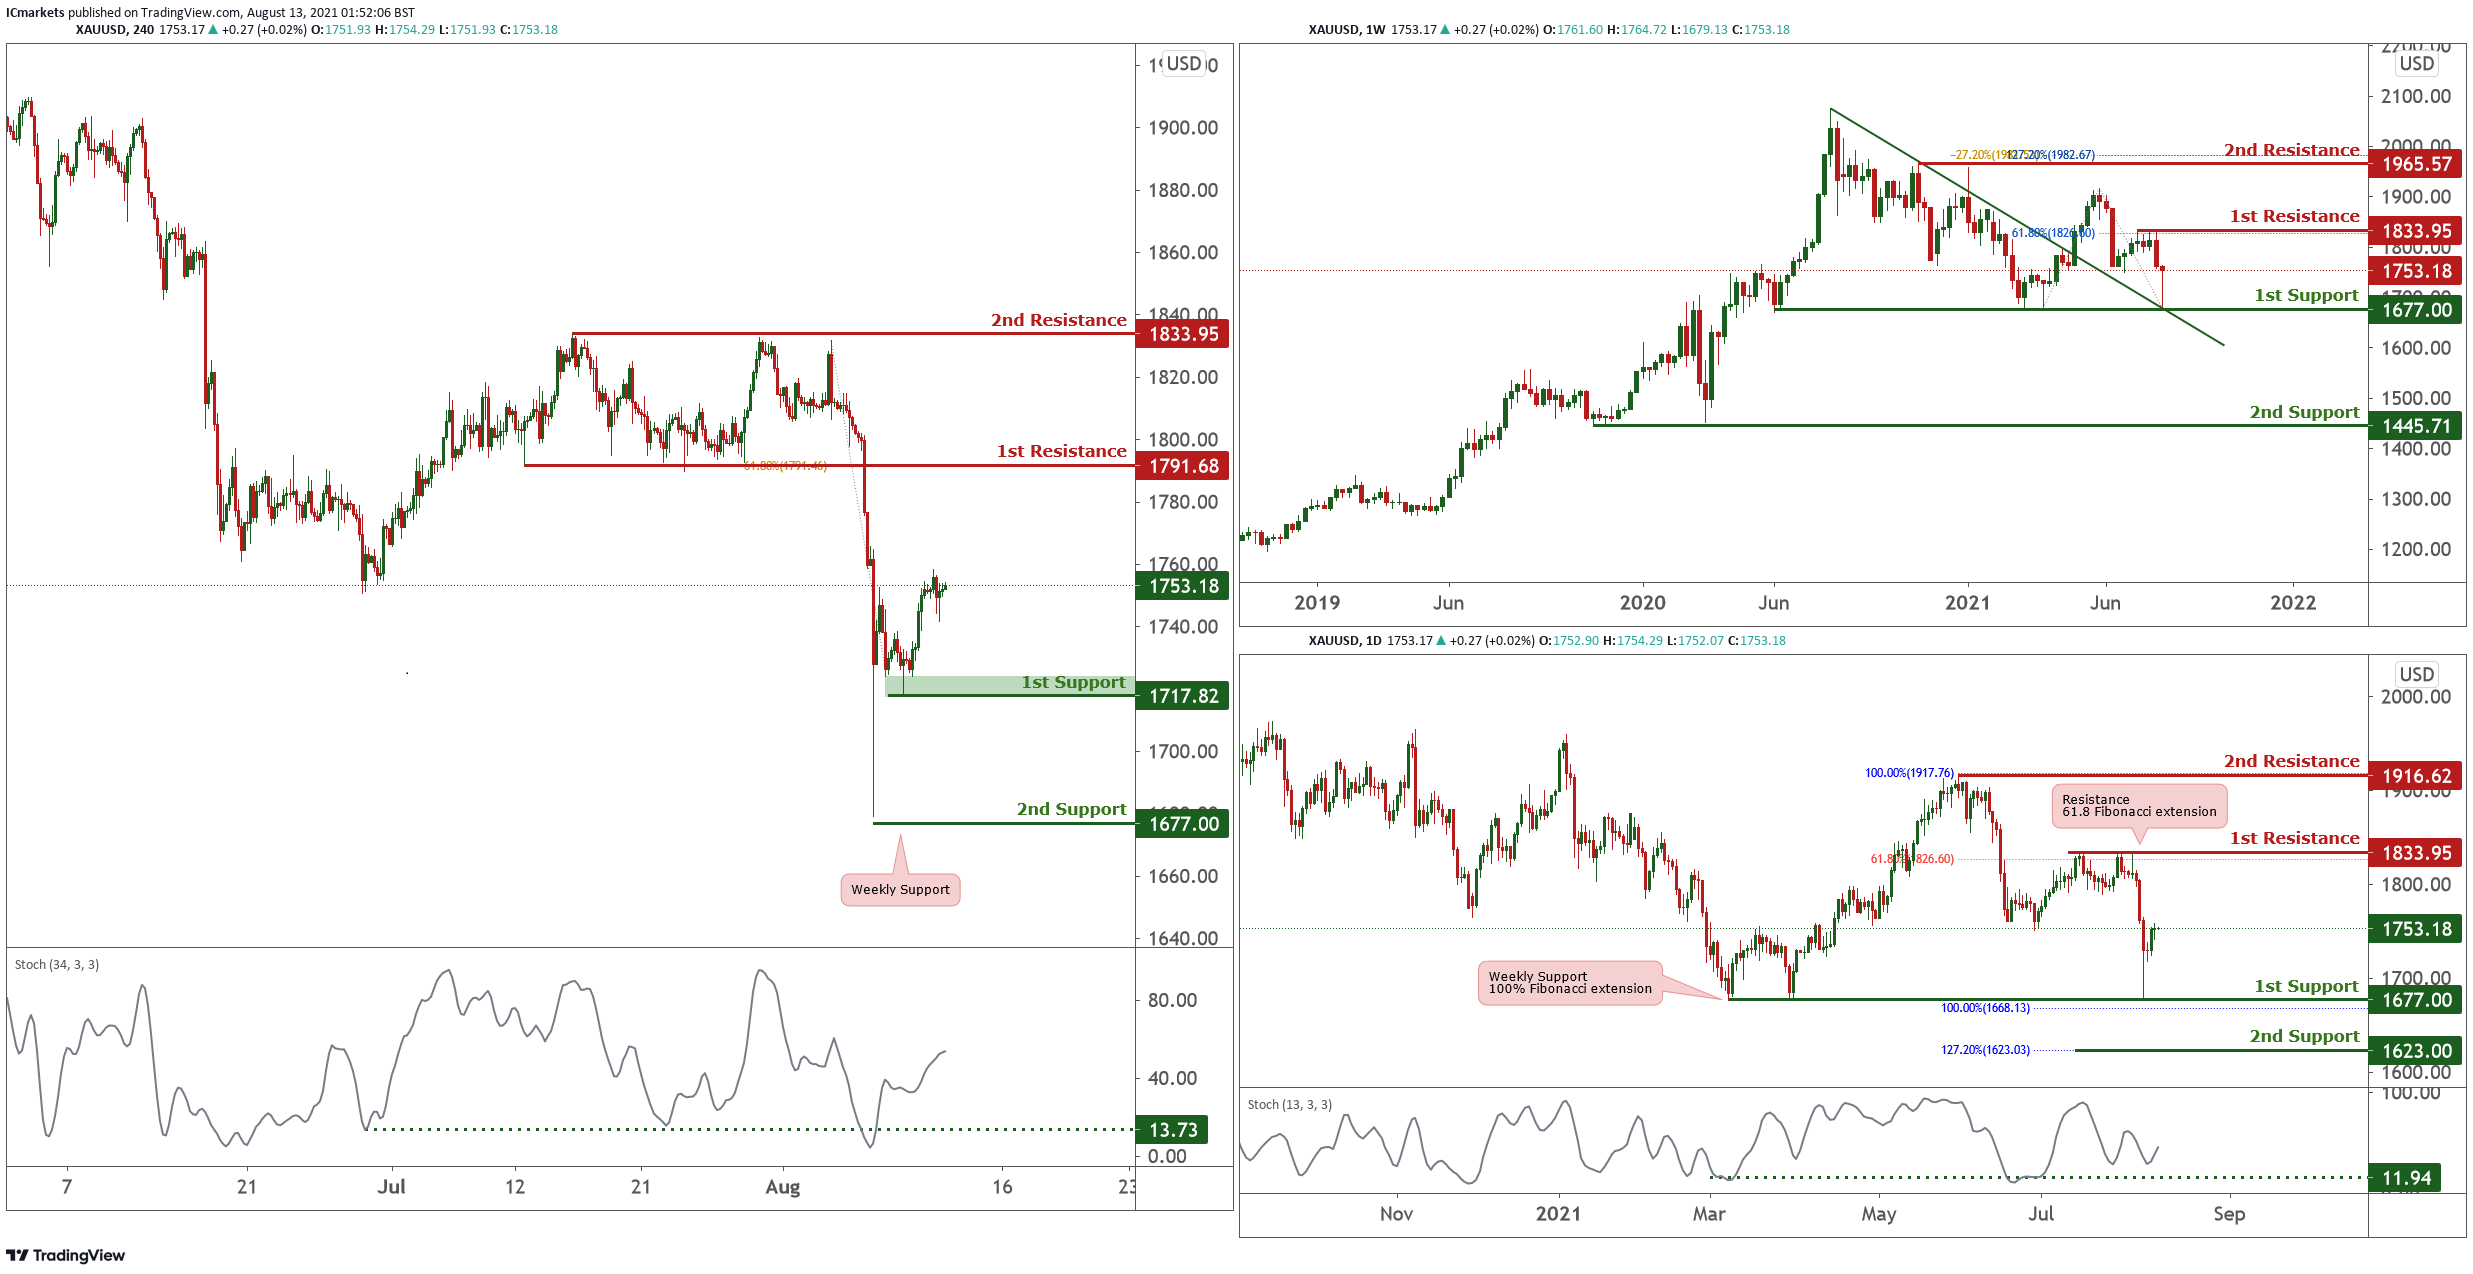
On the weekly timeframe, price dropped lower and tested descending trendline support at 1677. Price is now holding between 1833 resistance and 1677 support. These two levels would be of key interest to long term traders. A break of either of these levels should see price push higher towards next resistance at 1965 or next support at 1445. On the daily, price reacted sharply on weekly support at 1677. With stochastics reacting above support, we see a low probability bullish scenario where price may bounce towards 1833 resistance. Otherwise, breaking below 1677 will see the price drop much lower to 1623 support next.
On the H4, price drifted sideways but still holding above intraday support at 1717. With stochastics still holding above support where price bounced in the past, we still might see a short term intraday push higher towards key graphical overlap resistance at 1791. Otherwise, failure to hold above 1717 support zone will see price drop towards next daily support at 1677 instead.
Areas of consideration:
- 1717 H4 support is level to watch for bounce
EUR/USD:
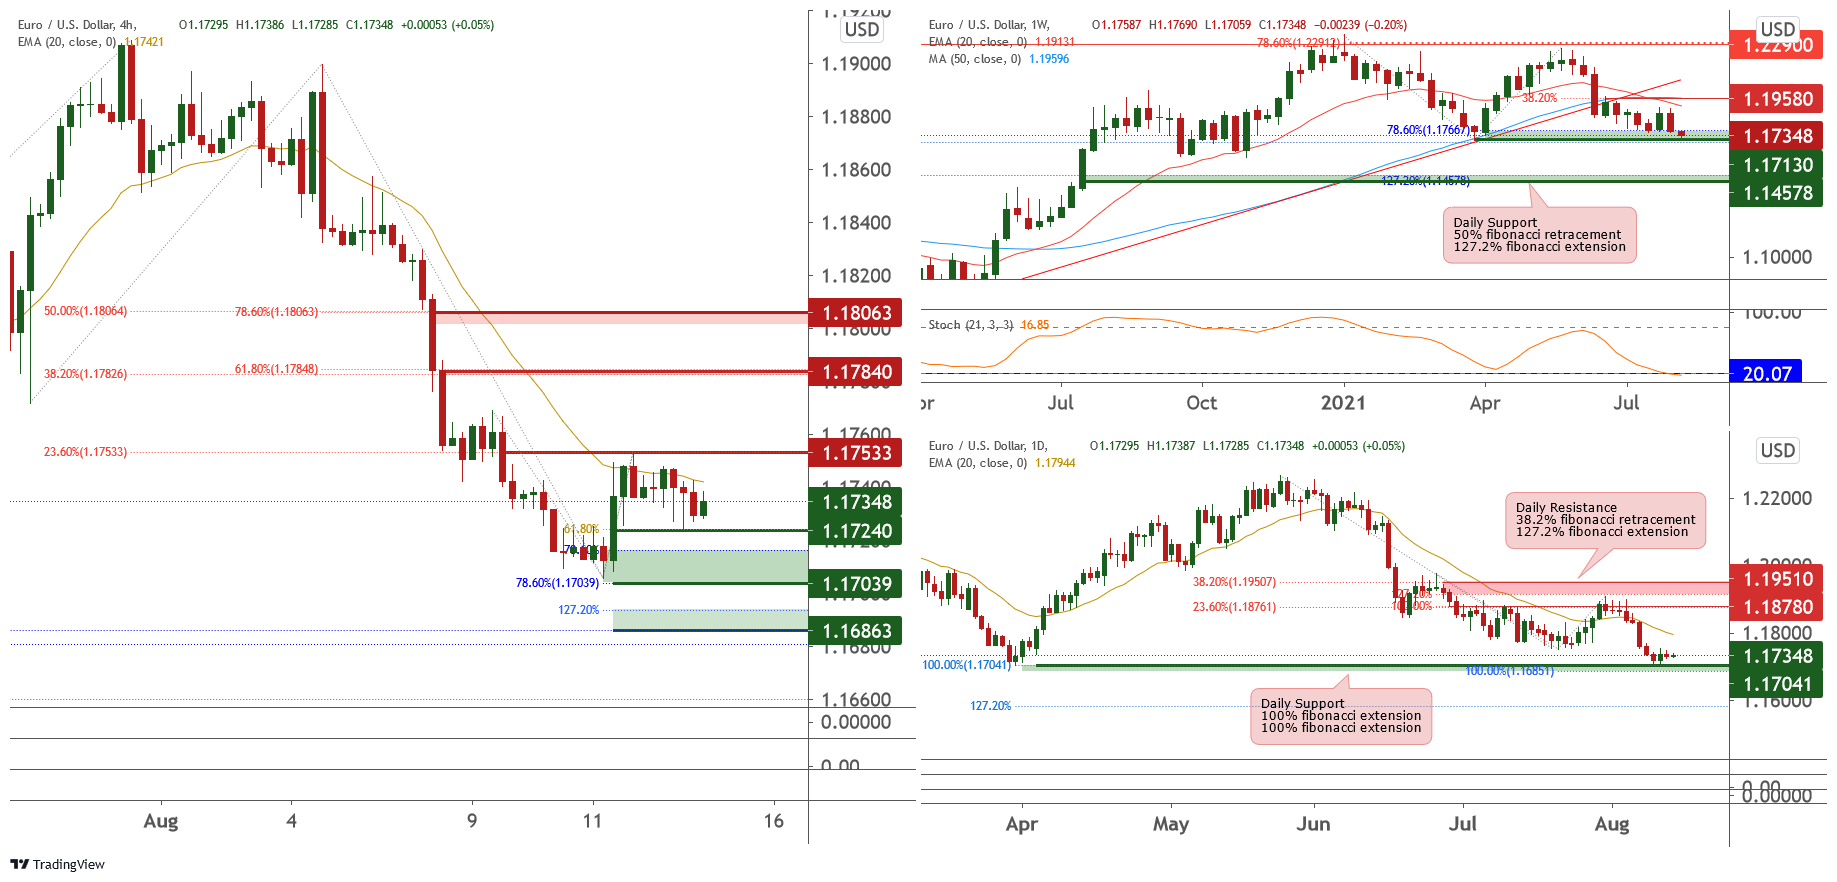
Looking at the weekly chart we can see that price has come back to test support at 1.17130, in-line with 38.2% Fibonacci retracement and 78.6% Fibonacci extension. If the price broke down from this support level, we could potentially see it swing towards support at 1.14578, in-line with 50% Fibonacci retracement and 127.2% Fibonacci extension. On the daily chart, price rebounded from support at 1.17041, in-line with 100% and 100% Fibonacci extension.
On the H4 timeframe, prices faced bearish pressure from 20EMA and resistance at 1.17533 and dropped to support at 1.17240, in-line with 61.8% Fibonacci retracement. Price could potentially drop to retest support at 1.17039, in-line with 78.6% Fibonacci retracement and 78.6% Fibonacci extension. The next support could potentially be at 1.16863, in-line with 127.2% Fibonacci retracement and 100% Fibonacci extension.
If the price bounces from here, it could potentially swing towards resistance at 1.17840, in-line with 38.2% Fibonacci retracement and 161.8% Fibonacci extension. The next resistance could potentially be at 1.18063, in-line with 50% Fibonacci retracement and 200% Fibonacci extension.
Areas of consideration:
- H4 time frame, support level at 1.17039 and 1.16863
- H4 time frame, resistance level at 1.17840 and 1.18063
USD/CHF:
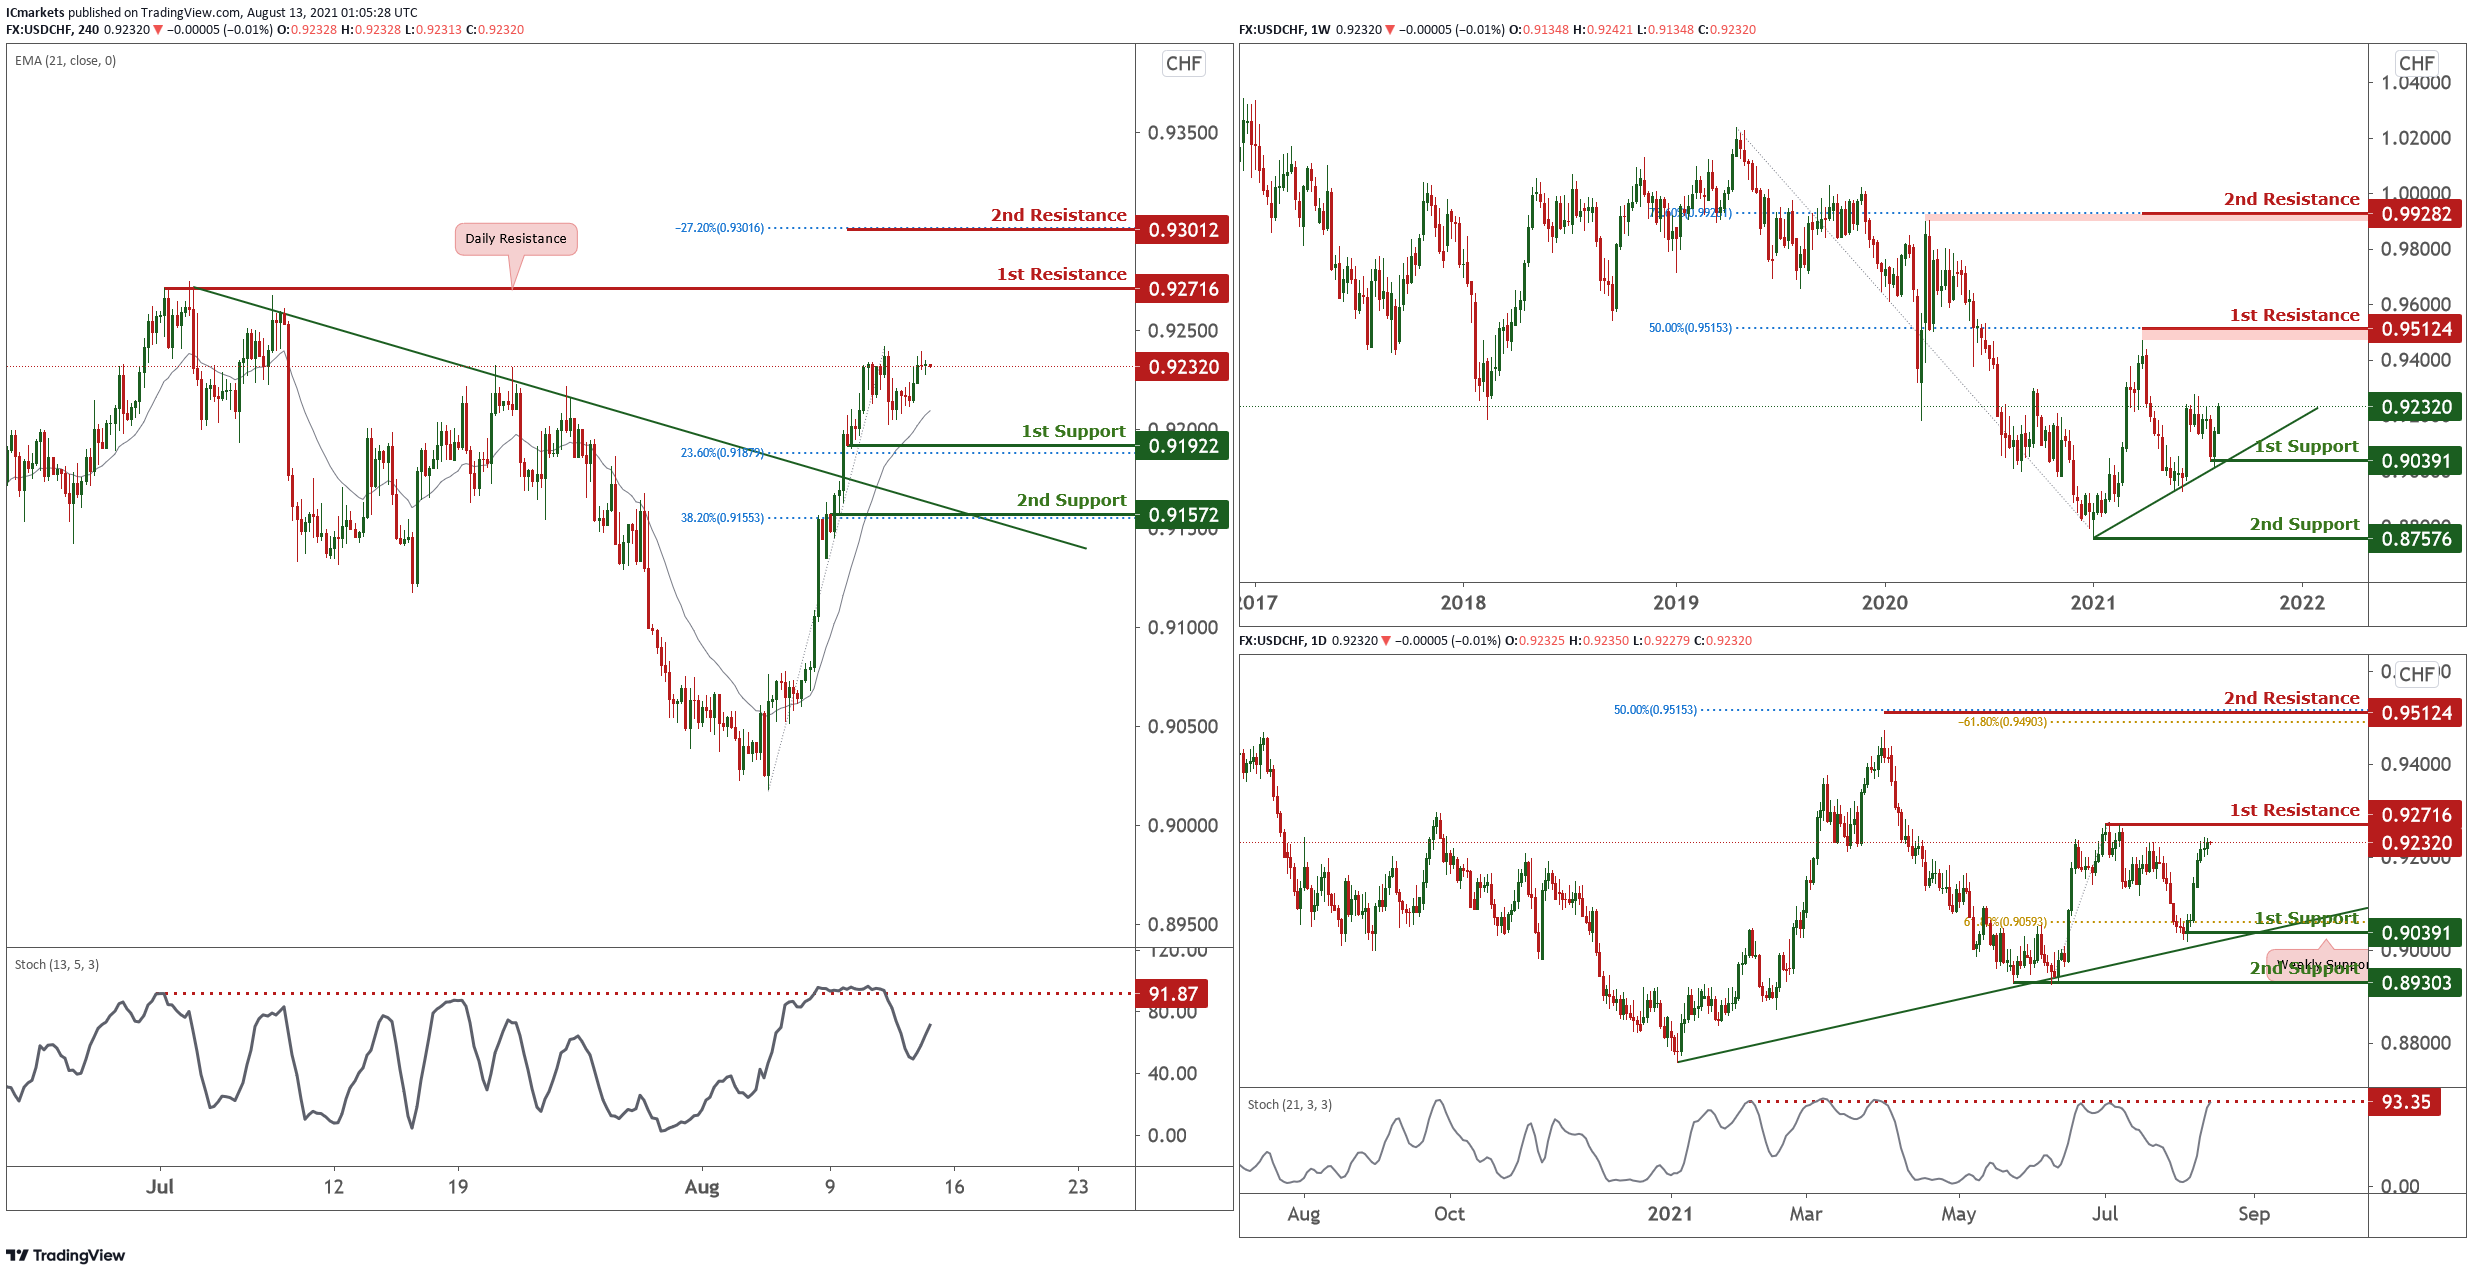
On the weekly, price is holding above ascending trendline support and also between 1st resistance at 0.95124 and 1st support at 0.90391. Traders should watch these level closely for a break would see price swing higher or drop lower. On the daily, price is approaching graphical swing high resistance and 1st resistance at 0.92716. With stochastics testing resistance where price dropped in the past, we see a possibility that sellers could enter and push price lower towards 1st support at 0.90391.
On the H4, price drifted sideways and is currently holding between 1st resistance at 0.92716 and 1st support at 0.91922. With indicators giving mixed signals, we prefer to take a neutral stance for now watching these 2 levels. A break of either will see price pushing higher towards 2nd resistance or see price dropping towards 2nd support.
Areas of consideration:
- Watch daily resistance at 0.92716
- Watch H4 1st support at 0.91922
GBP/USD:
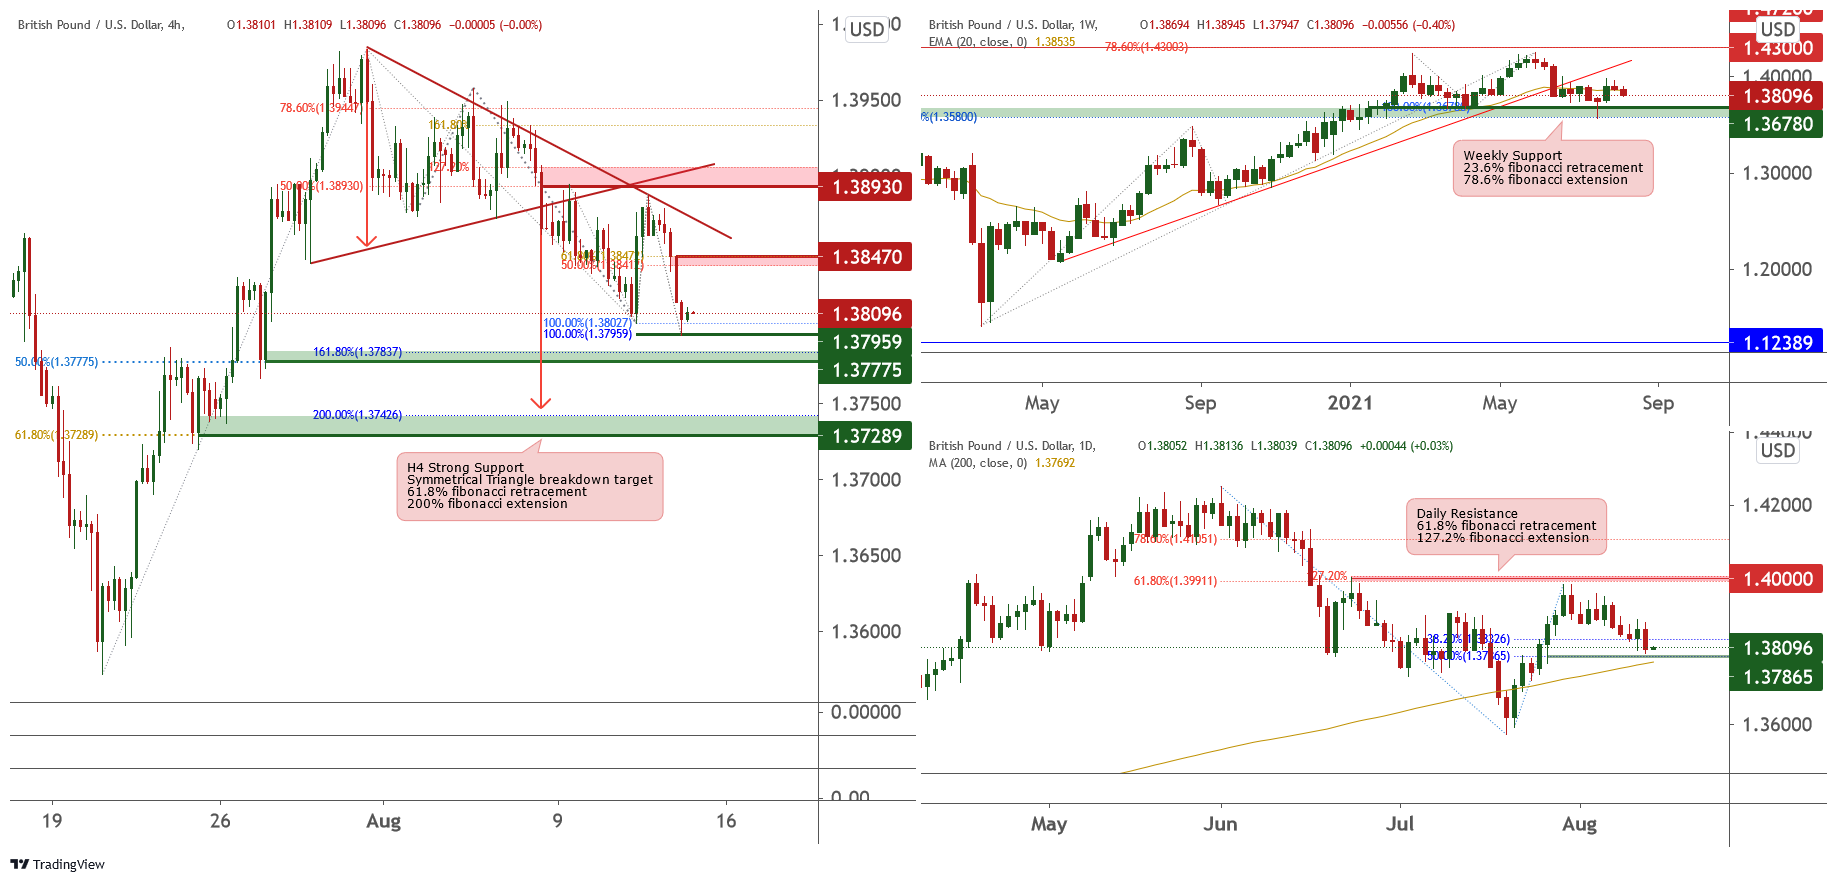
Looking at the weekly chart, prices could potentially be forming bearish flag consolidation after breaking down from ascending trendline support-turned-resistance to retest support at 1.36780, in-line with 23.6% Fibonacci retracement and 78.6% Fibonacci extension. On the daily time frame, prices are at broker below 1.38326 and found support at , in-line with 50% Fibonacci retracement and 200MA.
On the H4 timeframe, prices dropped to support at 1.37959, in-line with 100% Fibonacci retracement and 100% Fibonacci extension. Price could potentially continue to drop to support at 1.37775, in-line with 50% Fibonacci retracement and 161.8% Fibonacci extension. The next strong support could potentially be at 1.37289, in-line with 61.8% Fibonacci retracement and 200% Fibonacci extension.
If the price bounces, it could potentially swing towards resistance at 1.38470, in-line with 50% Fibonacci retracement and 127.2% Fibonacci extension. The next resistance could potentially be at 1.38930, in-line with 50% Fibonacci retracement and 127.2% Fibonacci extension.
Areas of consideration:
- H4 time frame, 37775 and 1.37289 support level
- H4 time frame, 1.38470 and 1.38930 resistance level
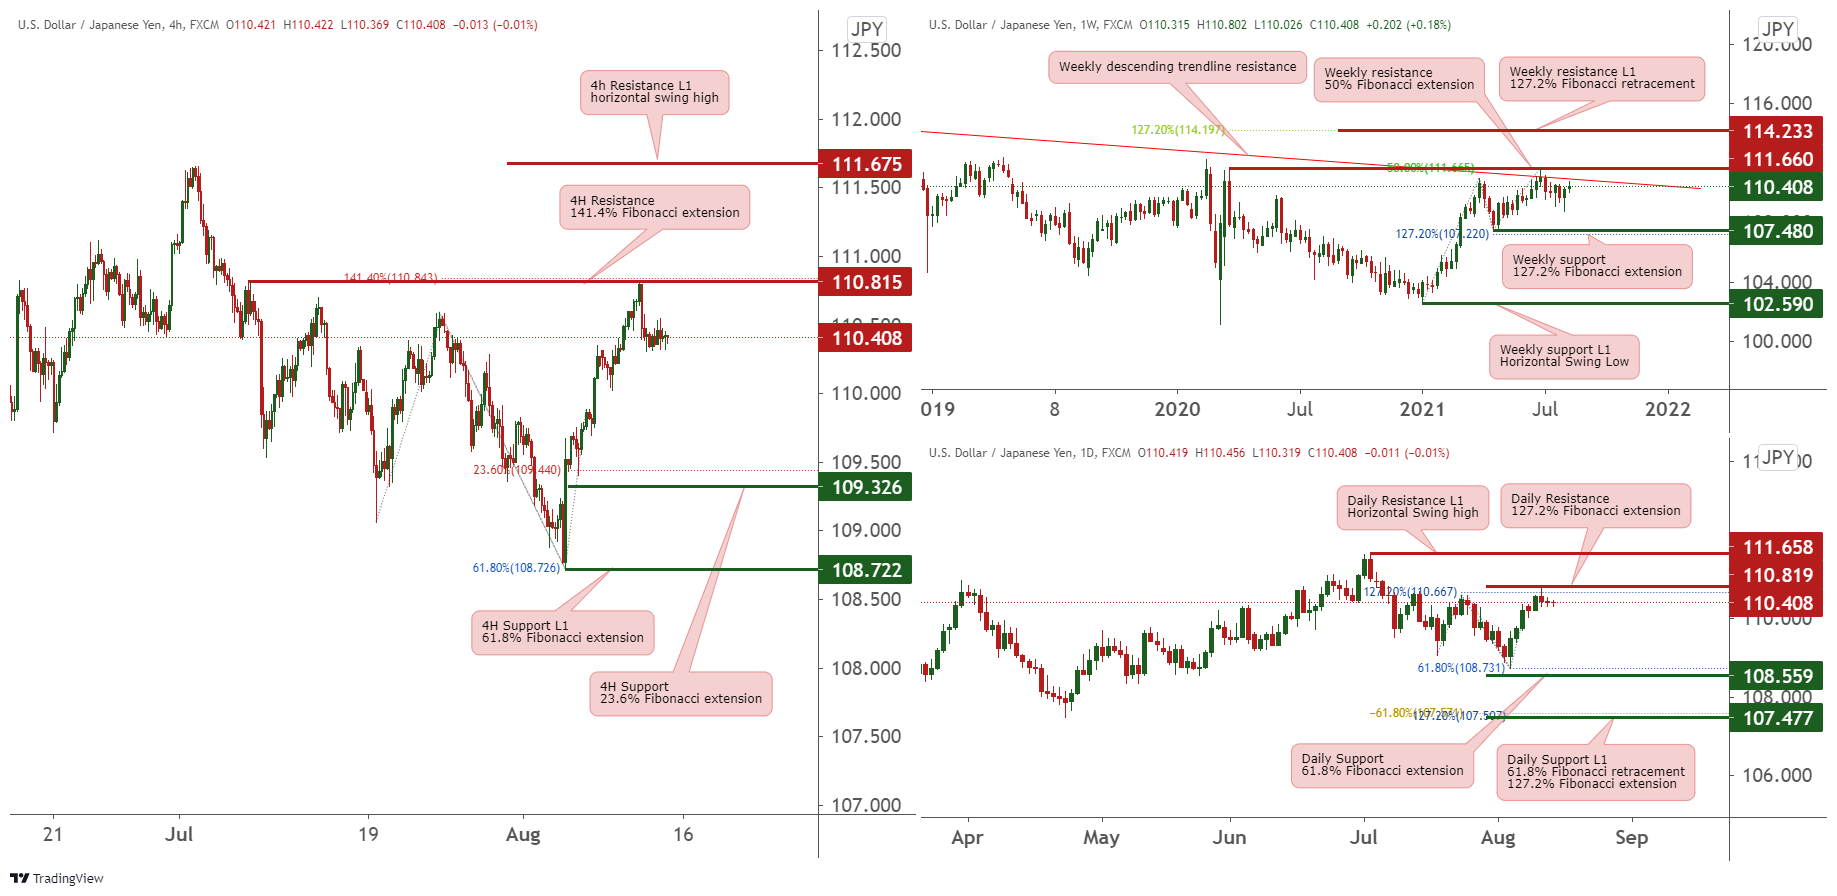
USD/JPY
From the weekly timeframe, price is below the descending trendline resistance, and may bearish to weekly support 107.480 in line with 127.2% Fibonacci extension.
On the other hand, price might move above the weekly descending trendline resistance and may move towards the weekly resistance at 111.660 in line with 50% Fibonacci extension.
On the Daily timeframe, price may bearish to the daily support at 108.559 in line with 61.8% Fibonacci extension. On the other hand, price might move towards the daily resistance L1 at 111.658 in line with horizontal swing high.
On the 4H timeframe, price may bearish to the 4H support at 109.326 in line with 23.6% Fibonacci extension. On the other hand, price might move towards the 4H resistance L1 at 111.675 in line with horizontal swing high.
Areas of consideration:
- 815 resistance level on the 4H timeframe
- 326 support level on the 4H timeframe
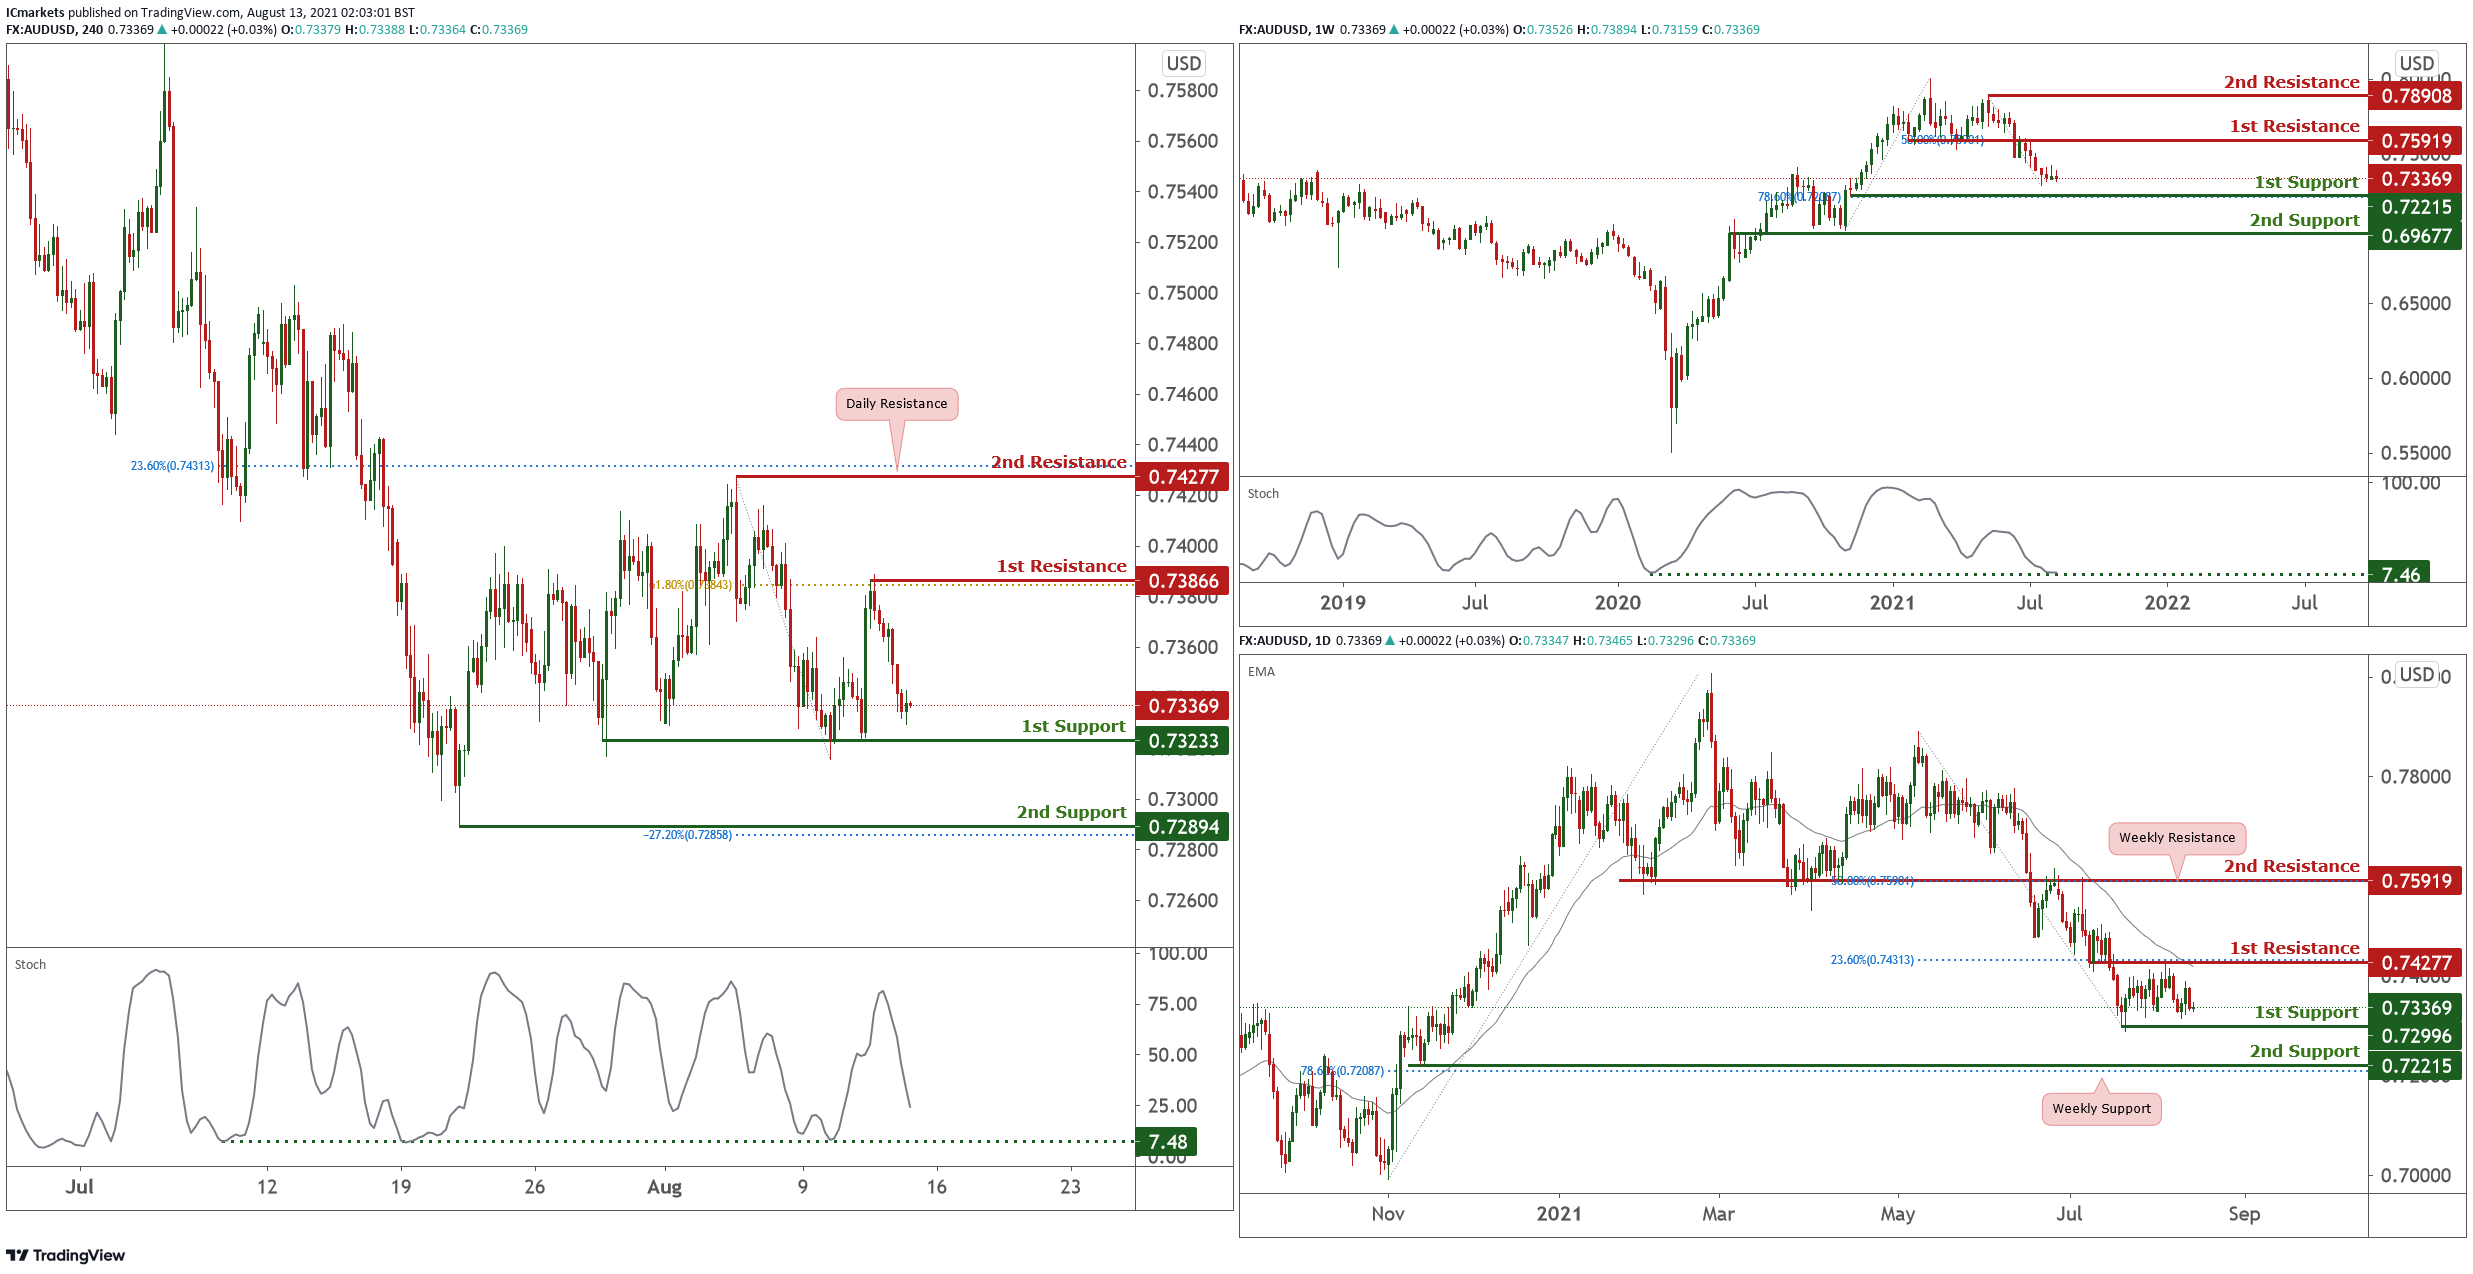
AUD/USD:
On the weekly, price is drifting lower, approaching key 78.6% Fibonacci retracement level and our 1st support at 0.73682. With stochastics on support where price bounced in the past, price may face bullish pressure as long as it continues to hold above 1st support. On the daily, price is holding between both 1st resistance at 0.74277 and 1st support at 0.72996. With no good risk reward, we lean towards a slight bearish bias because of the daily moving average. Otherwise a break above 0.74277 could see price push towards 2nd resistance at 0.75919 instead.
On the H4, price dropped lower and is approaching 1st support at 0.73233. With stochastics approaching support where price bounced in the past, we may see buyers enter this area with their longs to push price higher towards 1st resistance at 0.73866. Otherwise, failure to hold above 1st support will see price drop towards 2nd support at 0.72894.
Areas of consideration:
- H4 approaching 1st support 0.73233.
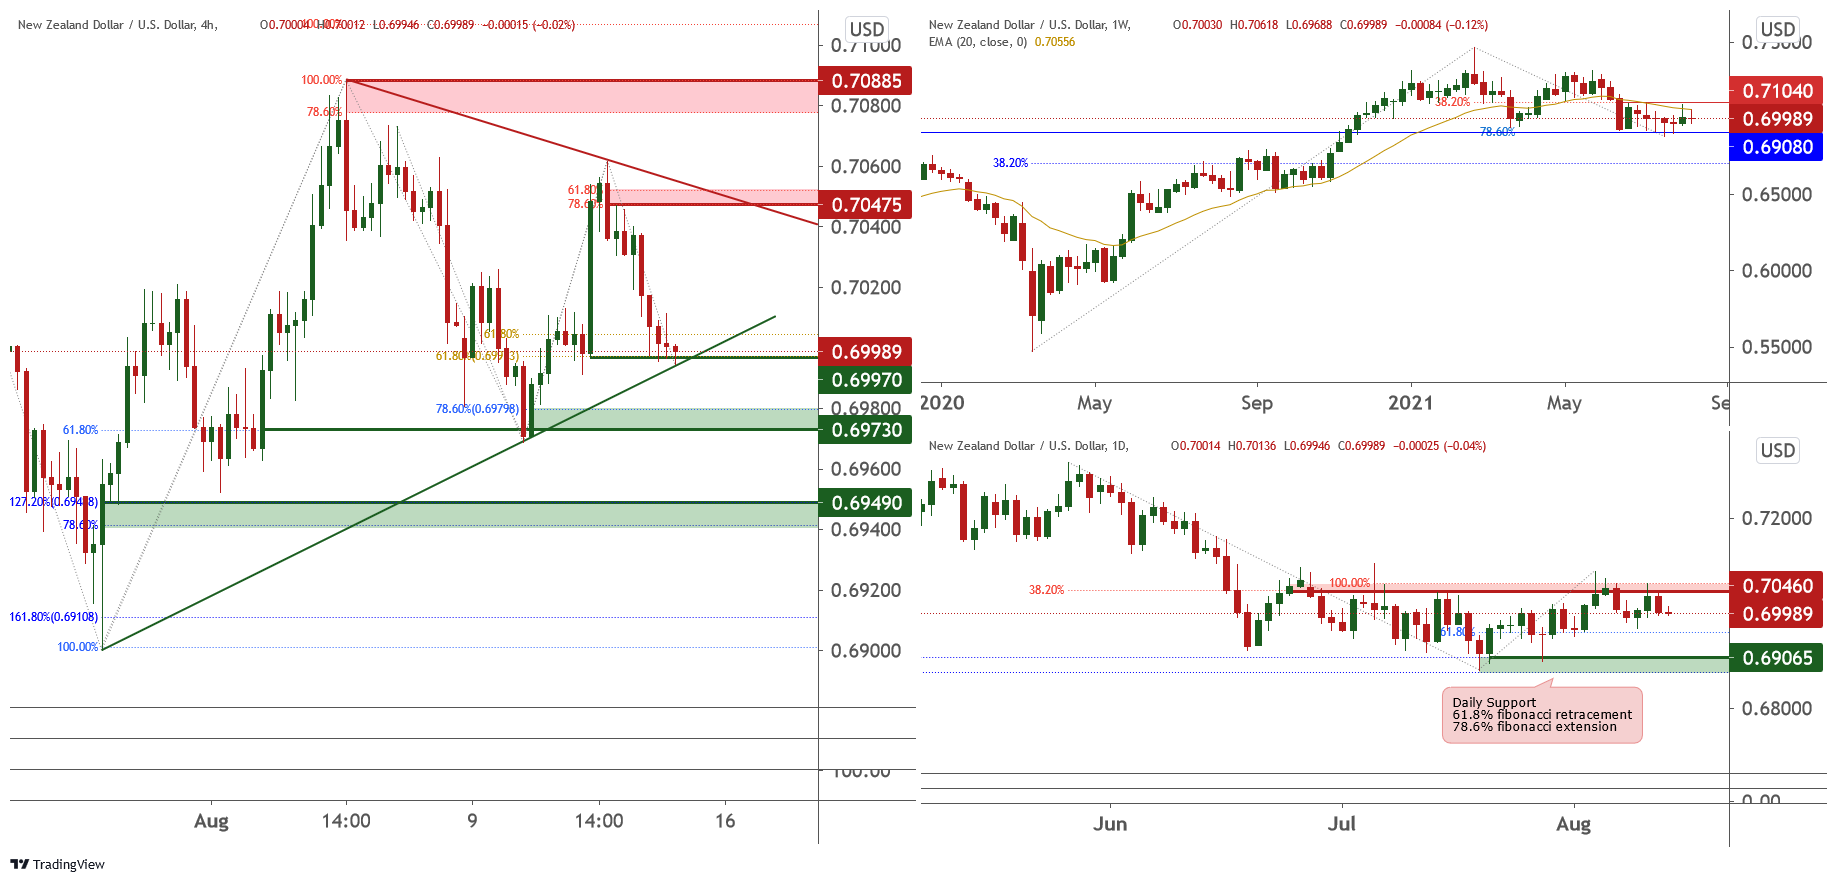
NZD/USD:
Looking at the weekly chart we could see that prices are consolidating within resistance at 0.71040 and support at 0.69080. On the daily chart, prices dropped from resistance at 0.70460, in-line with 38.2% Fibonacci retracement and 100% Fibonacci extension. There could potentially be bearish pressure for further downside.
On the H4 timeframe prices dropped to support at 0.69970, in-line with 61.8% Fibonacci retracement, 61.8% Fibonacci extension and ascending trendline support. There could potentially be a short-term bounce to resistance at 0.70475, in-line with 78.6% Fibonacci retracement, 61.8% Fibonacci extension and descending trendline resistance. The next resistance could potentially be at 0.70885, in-line with 100% Fibonacci retracement and 78.6% Fibonacci extension.
If the price continues to drop, it could potentially swing towards support at 0.69730, in-line with 61.8% Fibonacci retracement and 78.6% Fibonacci extension. The next support could potentially be at 0.69490, in-line with 78.6% Fibonacci retracement and 200% Fibonacci extension.
Areas of consideration:
- H4 time frame, support level at 0.69730 and 69490
- H4 time frame, resistance level at 70475 and 0.70885
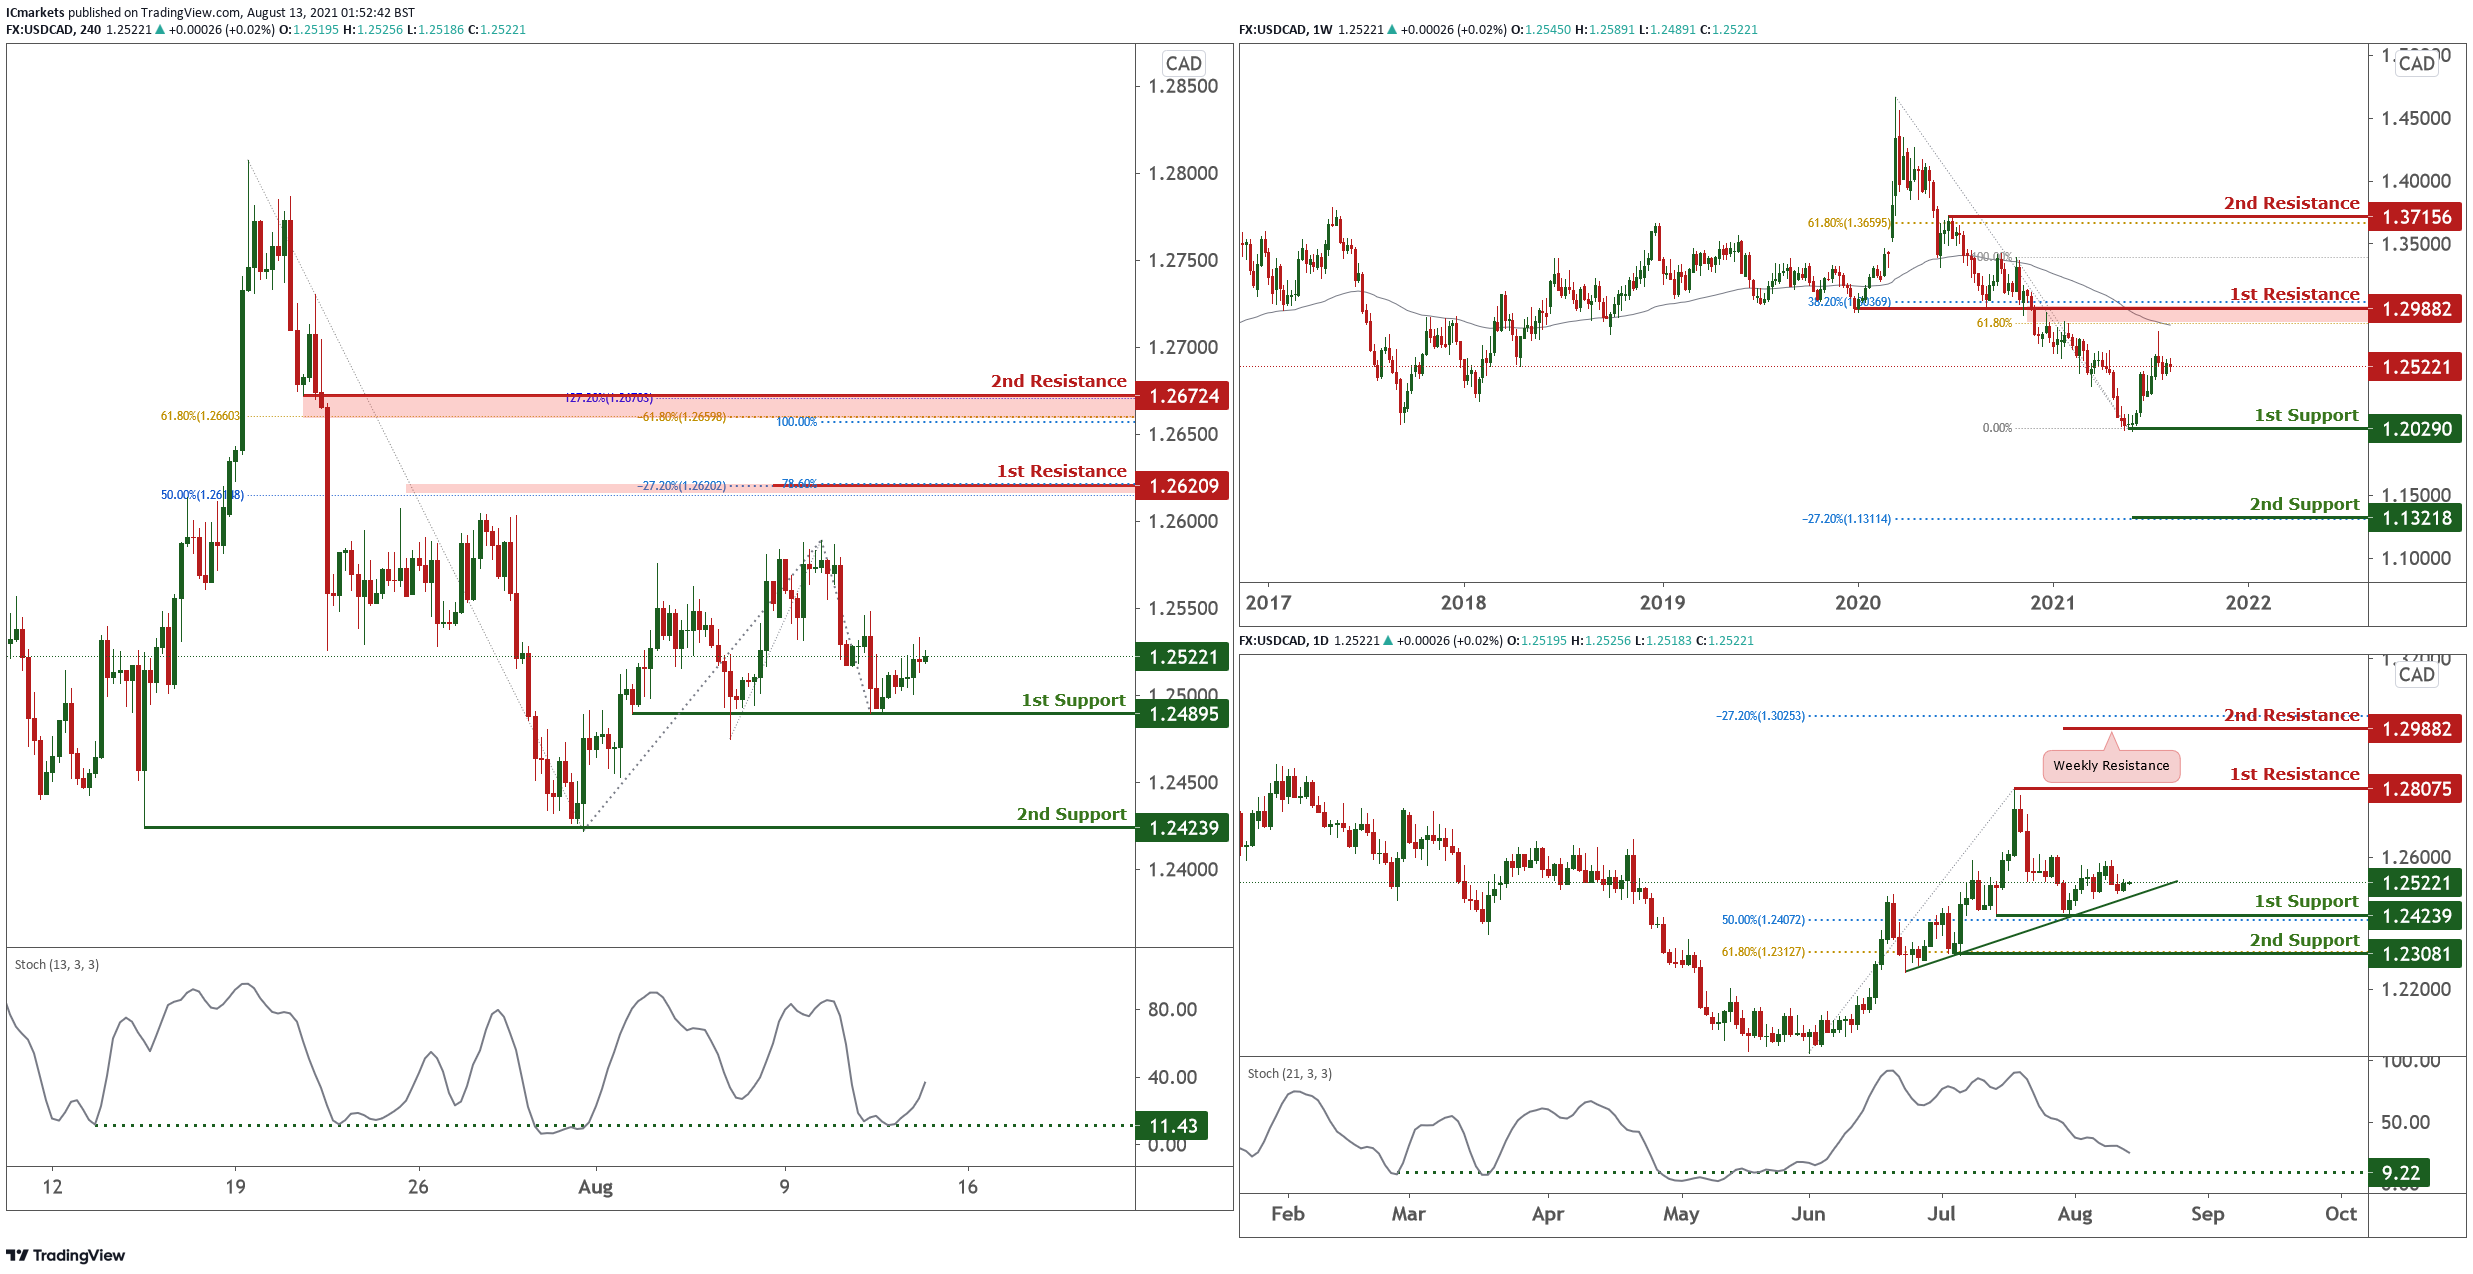
USD/CAD:
On the Weekly timeframe, price is holding below long term moving average and also both 38.2% and 61.8% Fibonacci retracement level at 1.29950. As long as the price is holding below this level, we see price facing further bearish pressure in the long term. On the Daily, price recently bounced from the ascending trendline support and may find resistance at the graphical swing high resistance level at 1.28075. Failure to hold above support at 1.24239 could see price drop topwards next support at 1.23081.
On the H4 price bounced above graphical swing low and 1st support at 1.24895. With stochastics on support where price bounced in the past, we see price facing further possible bullish pressure for a bounce towards 1st resistance at 1.26209. Otherwise, breaking below 1st support will see price drop towards 2nd support at 1.24239.
Areas of consideration:
- Daily and H4 timeframes show room for further bullish pressure
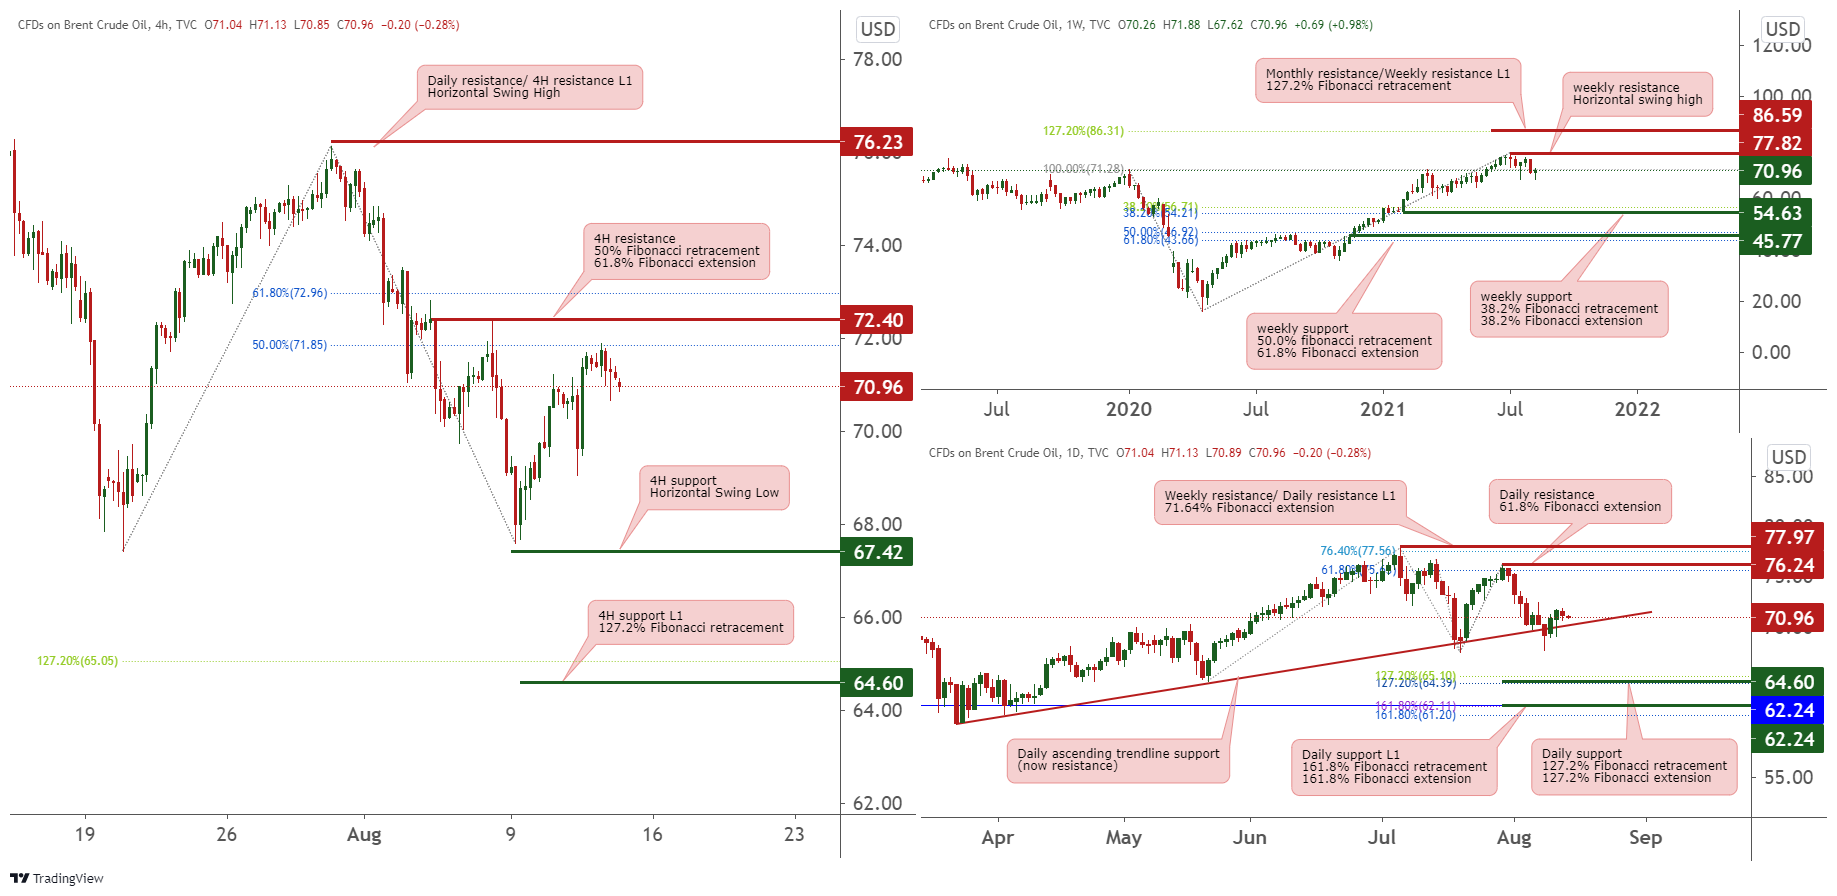
OIL:
On Weekly timeframe, we can see price has reversed from weekly resistance from horizontal swing high at 77.82, price may continue its bearish momentum, may find support at 54.63 in line with 38.2% Fibonacci retracement and 38.2% Fibonacci extension. However, if price breaks above 77.82 which is weekly resistance at horizontal swing high, it may swing up towards the Weekly resistance L1 at 86.59 in line with 127.2% Fibonacci retracement.
On the Daily timeframe, we are seeing a similar bearish pressure as price may break through the ascending trendline support (now resistance) and may find Daily support at 64.6 which is in line with 127.2% Fibonacci retracement and 127.2% Fibonacci extension. Otherwise, price may move towards the Daily support at 76.24 in line with 61.8% Fibonacci extension.
Lastly, on the 4H timeframe, price may continue to bearish below the 4H resistance at 72.4 in line with 50% Fibonacci retracement and 61.8% Fibonacci extension and may heading towards the 4H support at 67.42 in line with horizontal swing low and may continue to its bearish momentum towards the 4H support L1 at 64.6 in line with 127.2 Fibonacci retracement. Otherwise price may move towards the 4H resistance at 72.4 in line 50% Fibonacci retracement and 61.8% Fibonacci extension.
Areas of consideration:
- 4 resistance level on the 4H timeframe
- 42 support level on the 4H timeframe
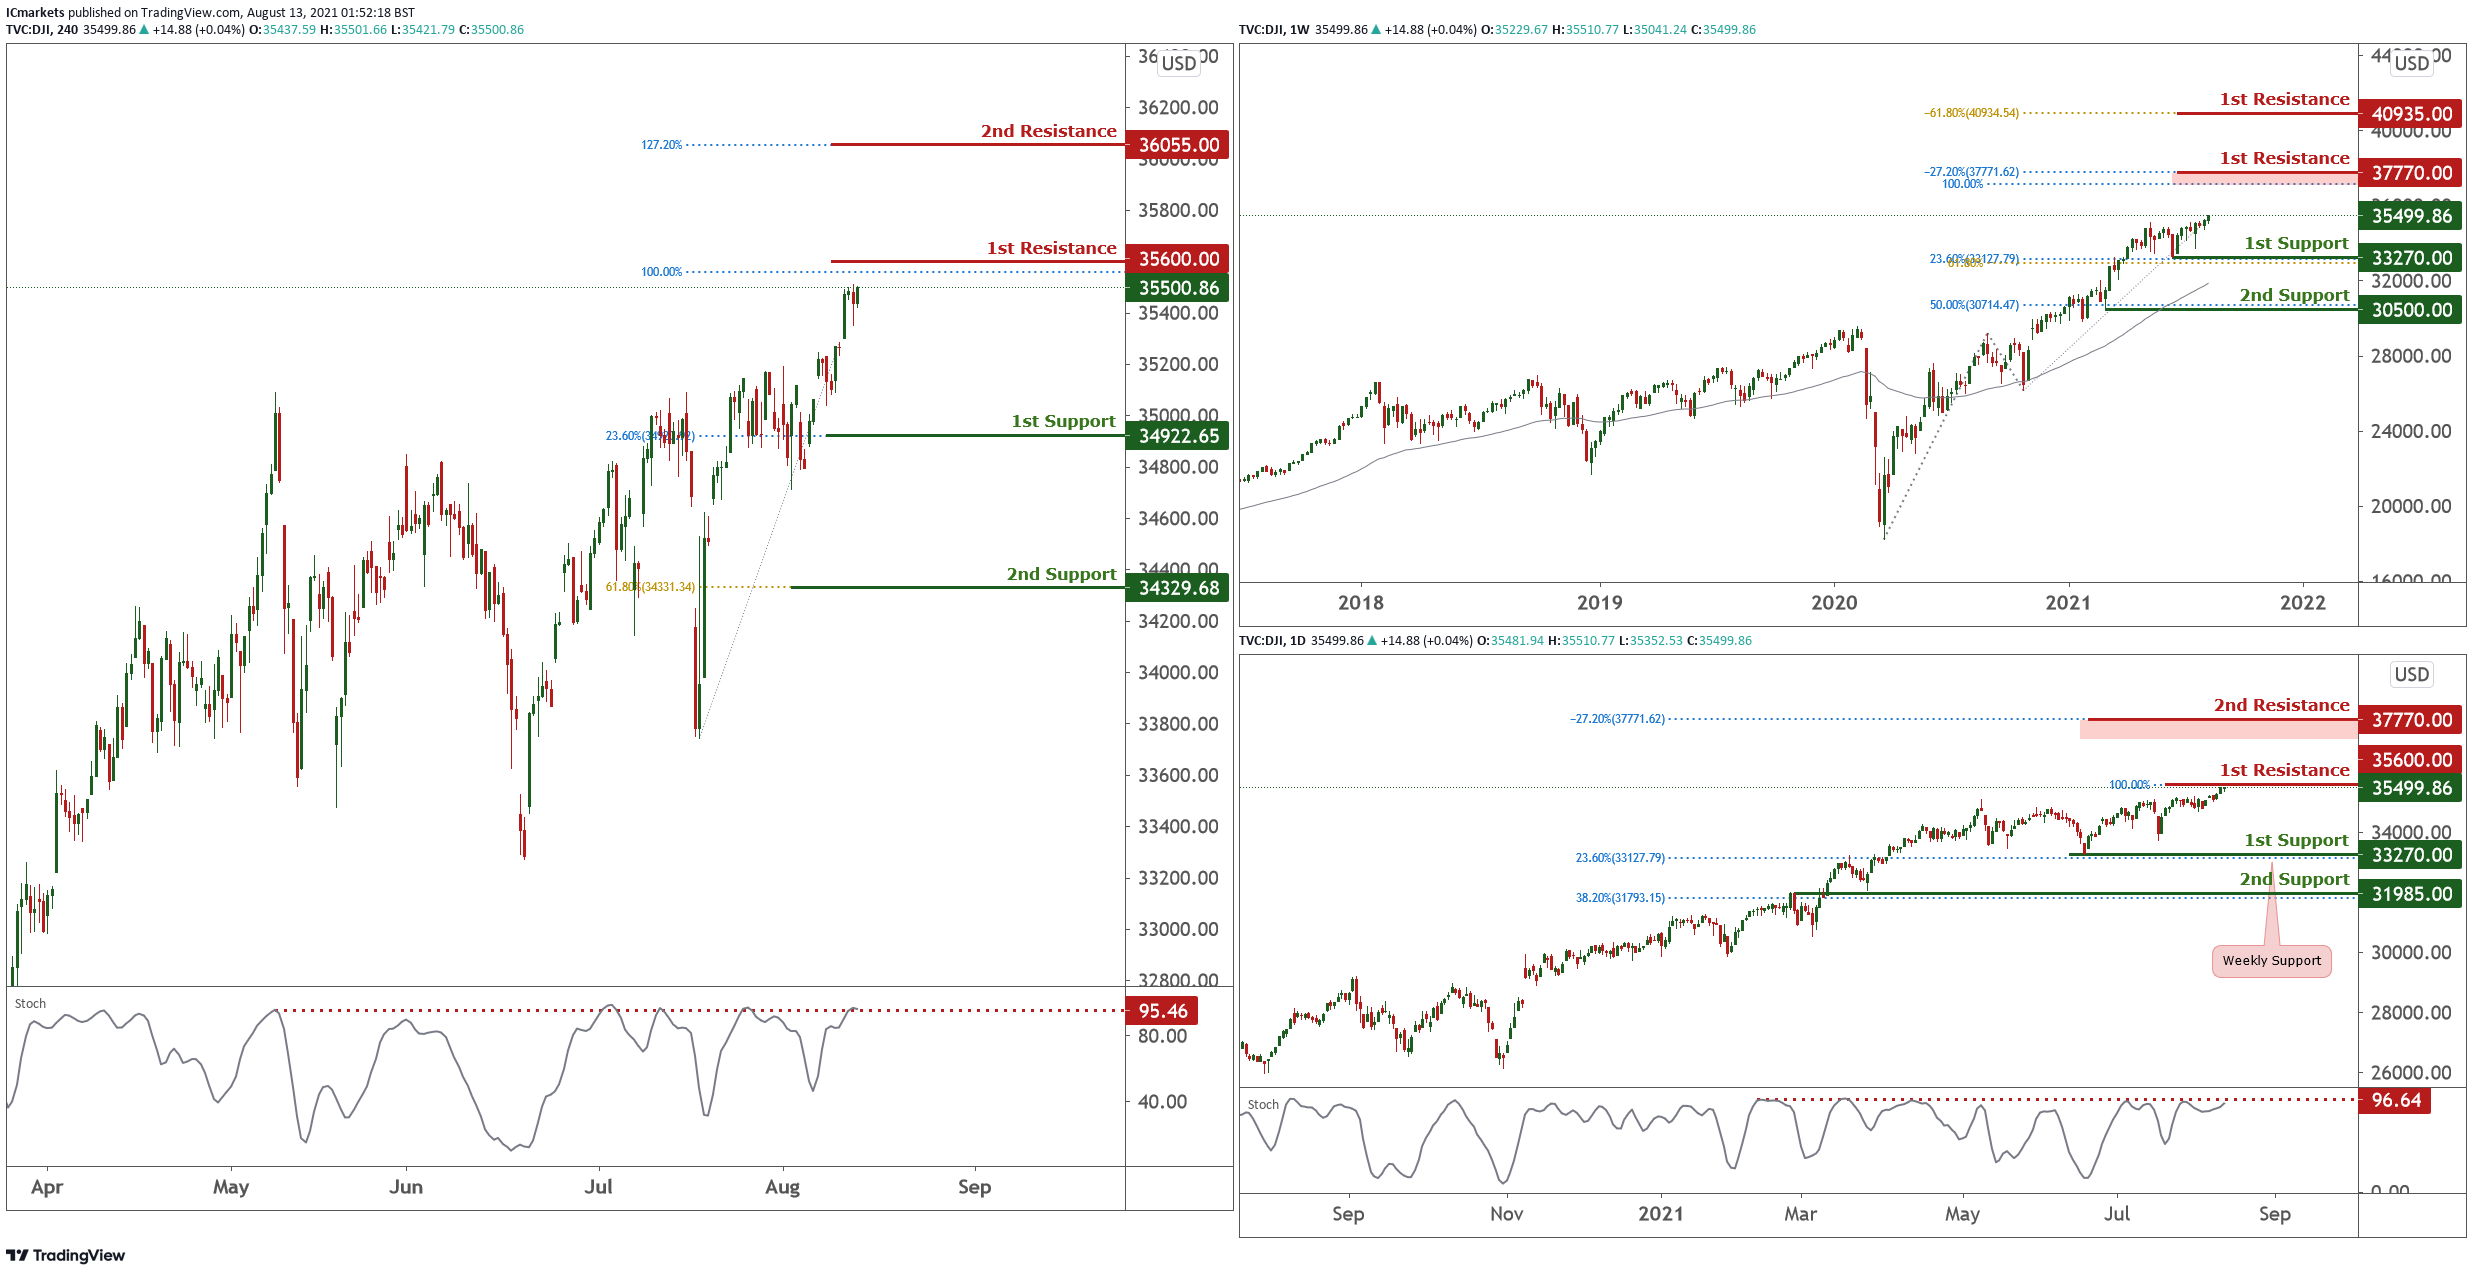
Dow Jones Industrial Average:
On the weekly chart, price is trading sideways holding between 33270 support and 37770 resistance. With price holding above long term moving average, we see a possibility of price facing further bullish pressure. On the daily chart, price is currently trading sideways, still testing and holding below resistance at 35600. With stochastic still holding below resistance where price dropped in the past, we see price facing possible bearish pressure.
On the H4, price drifted higher and is testing daily resistance at 35600. With stochastics testing resistance, we see a low probability bearish scenario where sellers may enter and push price lower towards 1st support at 34922. Otherwise, failure to hold below 1st resistance, price may swing towards 2nd resistance at 36055 instead.
Areas of consideration:
- Watch 35600 daily resistance
The accuracy, completeness and timeliness of the information contained on this site cannot be guaranteed. IC Markets does not warranty, guarantee or make any representations, or assume any liability regarding financial results based on the use of the information in the site.
News, views, opinions, recommendations and other information obtained from sources outside of www.icmarkets.com.au, used in this site are believed to be reliable, but we cannot guarantee their accuracy or completeness. All such information is subject to change at any time without notice. IC Markets assumes no responsibility for the content of any linked site.
The fact that such links may exist does not indicate approval or endorsement of any material contained on any linked site. IC Markets is not liable for any harm caused by the transmission, through accessing the services or information on this site, of a computer virus, or other computer code or programming device that might be used to access, delete, damage, disable, disrupt or otherwise impede in any manner, the operation of the site or of any user’s software, hardware, data or property.


