
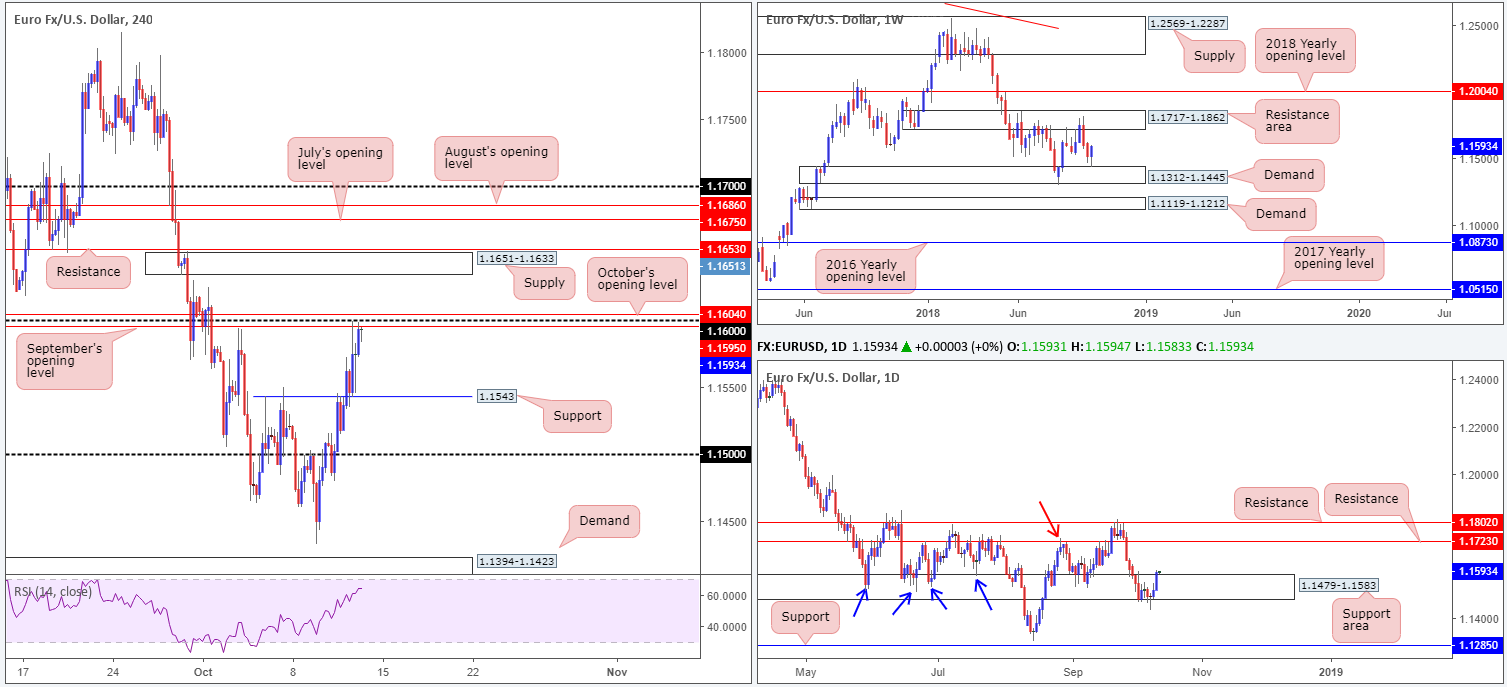
EUR/USD:
Broad-based USD selling, lower-than-expected US CPI figures along with US President Trump, once again, expressing disapproval over the Fed’s action, witnessed the EUR/USD rise to highs of 1.1599 on Thursday.
According to our technical studies on the weekly timeframe, further buying could be in store. Demand at 1.1312-1.1445, as you can see, is firmly in play at this point, with room for the unit to press as far north as a resistance area plugged in at 1.1717-1.1862. The weekly timeframe’s bullish vibe is also echoed on the daily timeframe, as the candles begin to make headway out of its support area plotted at 1.1479-1.1583. The next upside target on this scale can be seen at resistance drawn from 1.1723, which happens to not only represent a nearby Quasimodo resistance based on the high marked with a red arrow at 1.1733, the level itself is also sited within the walls of the noted weekly resistance area.
Against the backdrop of higher-timeframe flows, however, H4 price is seen grappling with the 1.16 handle that’s surrounded by October and September’s opening levels at 1.1604 and 1.1595, respectively. As of yet, the candles have produced little in terms of bearish intent from this region. Also worth noting on this scale is the RSI indicator is seen fast approaching its overbought value.
Areas of consideration:
1.16, although merging nicely with two monthly opening levels, is unlikely to produce much of a bounce lower. At a stretch, the most we see out of this area is a pullback to H4 support at 1.1543.
A break of 1.16, however, almost immediately places the market within striking distance of notable H4 supply coming in at 1.1651-1.1633, thus buying based on the higher timeframes is somewhat problematic at this time.
Based on our reading, neither a long nor short seems attractive on the timeframes analyzed. For that reason the team have labelled this market as ‘flat’.
Today’s data points: US prelim UoM consumer sentiment; FOMC member Bostic speaks.
GBP/USD:
Although optimism surrounding the possibility of a Brexit deal being achieved ahead of the final divorce date remains high, the European Commission stated on Thursday ‘we are not there yet’, stressing there has been no breakthrough in negotiations.
Speculative interest, in recent trade, has shown to be present off the 1.32 handle on the H4 timeframe, reinforced by support priced in at 1.3193 (though trades against the RSI’s overbought reading). Overhead, minor H4 supply is visible marked with a green arrow at 1.3276-1.3264, positioned just south of 1.33. A touch beneath 1.33 traders may also want to note we have the lower edge of weekly supply present at 1.3295. Should the unit breach 1.33, however, a daily Quasimodo resistance rests nearby at 1.3315.
As you can see, 1.33 houses a number key resistances to keep eyes on going forward!
Areas of consideration:
All three timeframes point to further buying at the moment, at least until the unit crosses swords with the H4 supply mentioned above at 1.3276-1.3264.
Unfortunately, at current price (1.3233) risk/reward parameters are unfavourable. A retest of 1.3193/1.32 in the shape of a bullish candlestick formation, be it on the H4 or H1, is a stronger alternative to longs, in our humble view.
Today’s data points: US prelim UoM consumer sentiment; FOMC member Bostic speaks.

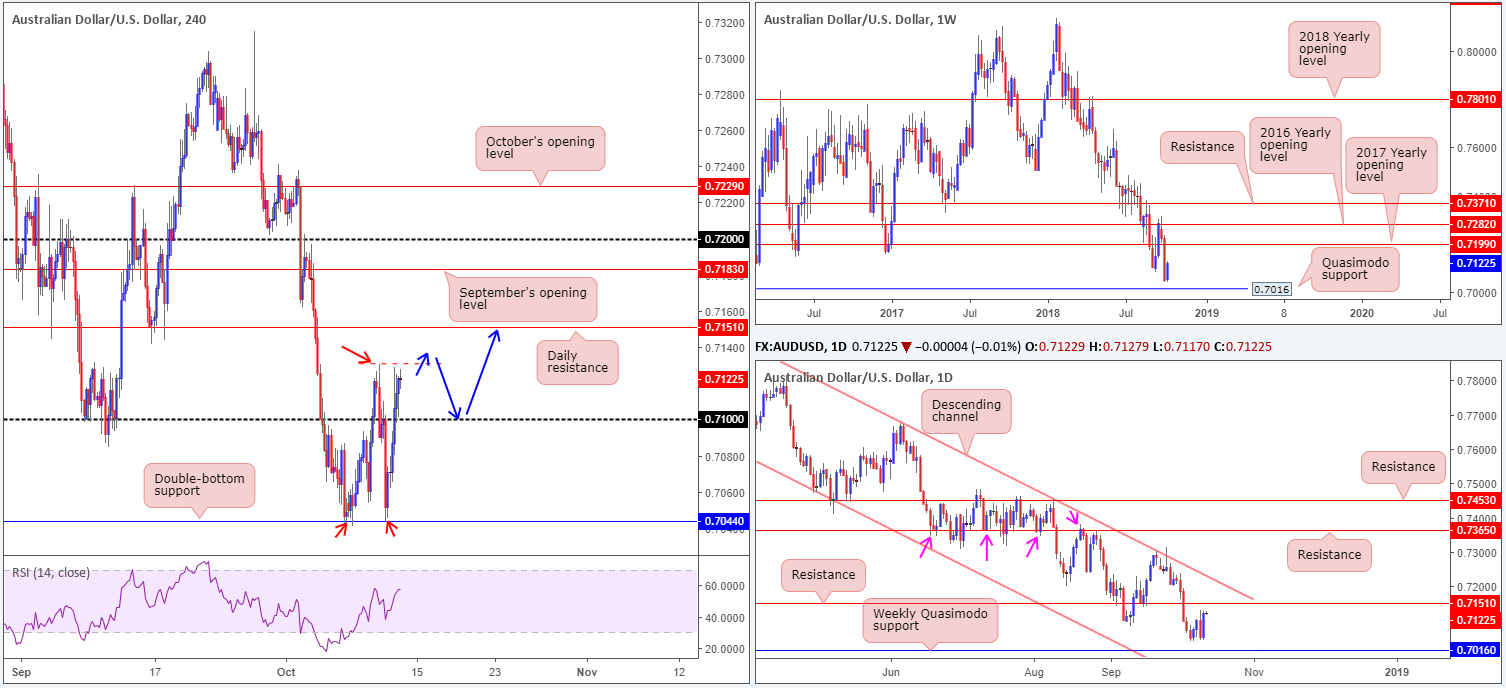
AUD/USD:
The Australian dollar is seen kicking its heels around the top end of the week’s range ahead of Friday’s sessions, after penciling in a strong rebound from multi-month/year lows vs. its US counterpart yesterday. Largely based on a waning US dollar, the AUD/USD managed to reclaim 0.71+ status and top just south of Wednesday’s high at 0.7130.
H4 technicians are likely noting the possibility of a confirmed double-bottom pattern being seen should we break through Wednesday’s high point. Caution is advised here. A break of 0.7130 lands the market within striking distance of a substantial resistance coming in from the daily timeframe at 0.7151 – not really a level one wants to be buying into!
On the other side of the coin, though, weekly price could potentially pull this market as far north as its 2017 yearly opening level at 0.7199, therefore possibly overthrowing both daily resistance highlighted above and also September’s opening level on the H4 scale at 0.7183.
Areas of consideration:
An alternative to simply pressing the buy button on a break of Wednesday’s high 0.7130 is a retest play off 0.71 (blue arrows). This provides one more breathing space to reduce risk before daily resistance at 0.7151.
Aggressive traders will likely look to trade 0.71 at market with stops positioned 10-15 pips beneath the number, whereas conservative traders may opt to wait and see if additional candlestick confirmation emerges before pulling the trigger (stop/entry levels positioned according to the candle’s structure).
Today’s data points: RBA financial stability review; Chinese trade balance; US prelim UoM consumer sentiment; FOMC member Bostic speaks.
USD/JPY:
Despite finding support off the 112 handle, along with the daily support at 112.11 and a 61.8% H4 Fib support at 111.99 (yellow zone) during early trade on Thursday, the USD/JPY market fell under renewed selling pressure in US hours, as major US equity indexes continued to pursue lower ground. The H4 candles, as you can see, whipsawed beneath 112, missing August’s opening level at 112.76 by a hair and likely ripping through a truckload of stop-loss orders.
Although signs of life is seen above 112 at the moment, the vibe on the weekly timeframe remains in negative territory as the unit establishes ground beneath its 2018 yearly opening level at 112.65. Technically speaking, the pair could eventually stretch as far south as trend line resistance-turned support (extended from the high 123.57).
Areas of consideration:
Should the current H4 candle close as is: a bullish pin-bar formation, candlestick enthusiasts will likely enter at the close of the candle and position stops a few pips beyond yesterday’s low 111.83. Despite weekly price trading marginally beyond its 2018 point, H4 action shows room to press as high as resistance at 112.75, followed by daily resistance at 113.40. Both are viable upside targets to have eyes on today.
Today’s data points: US prelim UoM consumer sentiment; FOMC member Bostic speaks.

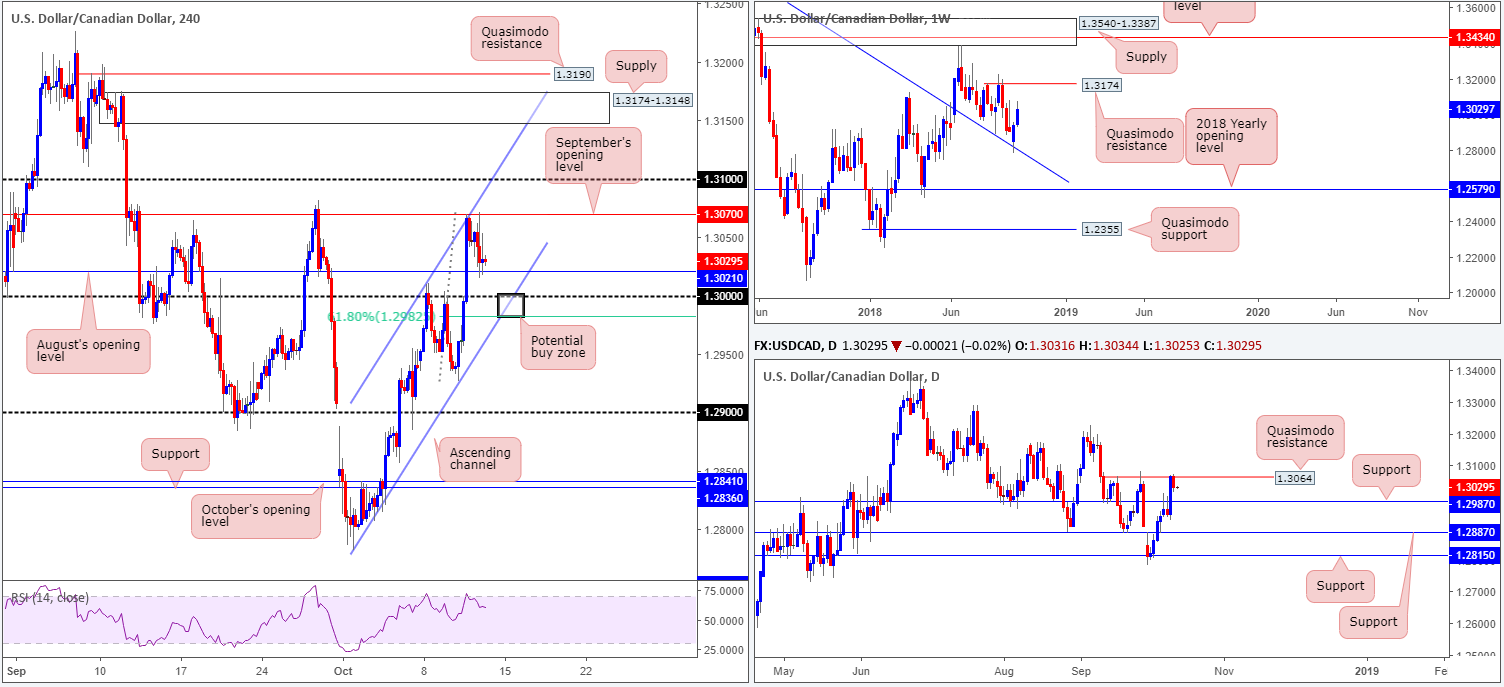
USD/CAD:
Following Wednesday’s surge higher, the USD/CAD mildly pared gains on Thursday off September’s opening level at 1.3070 on the H4 timeframe (merges with a channel resistance [extended from the high 1.3009]). Reinforced by a daily Quasimodo resistance at 1.3064, the pair rotated in the direction of August’s opening level at 1.3021, positioned 20 pips above the key figure 1.30 and nearby channel support (taken from the low 1.2782).
Despite yesterday’s action backing off from H4 and daily structure, traders might want to acknowledge further buying is possibly in store for weekly players. In view of last week’s robust bullish response off trend line resistance-turned support (extended from the high 1.4689), and this week’s push to highs of 1.3071, price is perhaps eyeing a test of a Quasimodo resistance level parked at 1.3174.
Areas of consideration:
The zone between 1.2982/1.30 (the H4 61.8% Fib support at 1.2982, the round number at 1.30 and intersecting H4 channel support [black area]) is reasonably stand out this morning for a bounce long. In addition to H4 confluence, another key factor present here is daily support priced in at 1.2987.
The only grumble towards longs out of 1.2982/1.30 is 1.3021 (August’s opening level), which may hinder upside. Should we get beyond 1.3021, the next upside target, however, falls in around September’s opening level mentioned above at 1.3070.
Today’s data points: US prelim UoM consumer sentiment; FOMC member Bostic speaks.
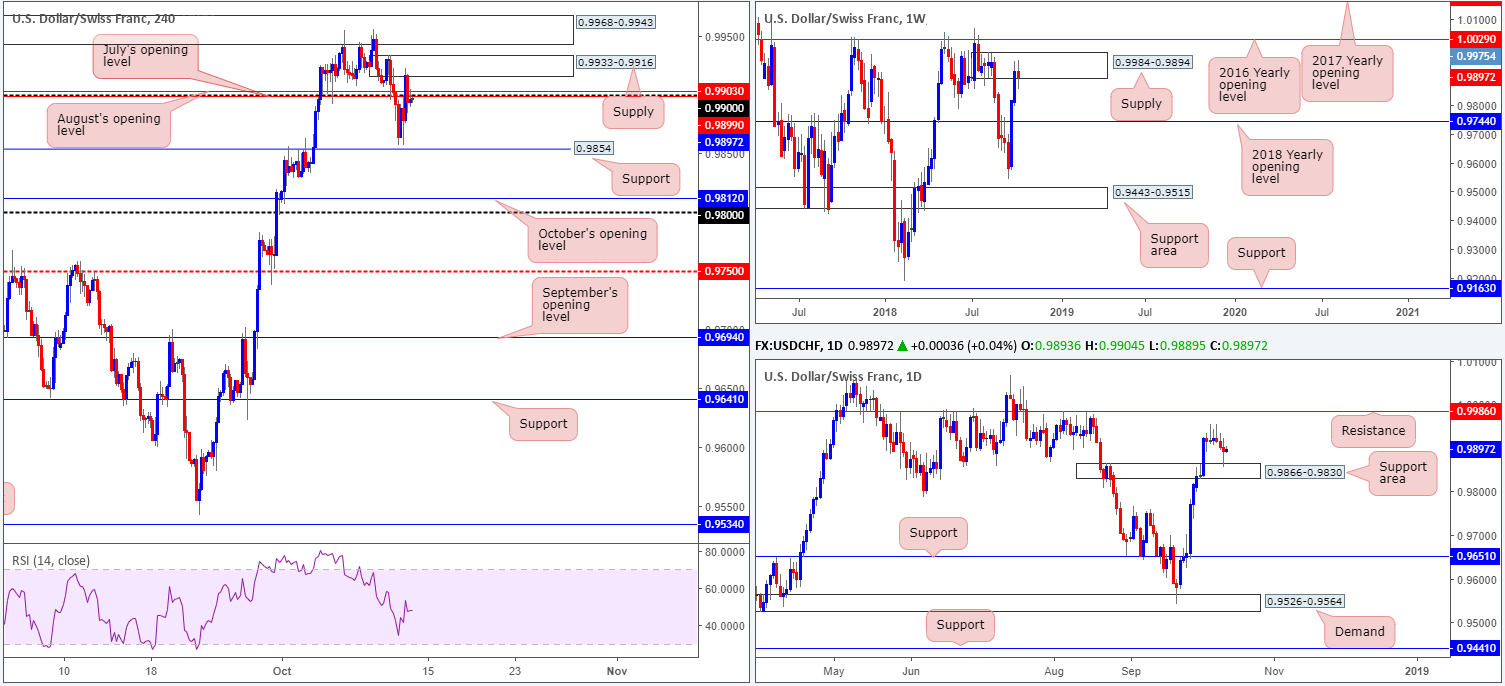
USD/CHF:
In recent sessions, USD/CHF movement rotated higher from a daily support area at 0.9866-0.9830, consequently placing a question mark on the weekly supply in play at 0.9984-0.9894. In the event further buying materializes off 0.9866-0.9830, a test of Tuesday’s high 0.9955 may be in store, followed closely by daily resistance at 0.9986 (positioned two pips above the aforementioned weekly supply’s edge).
The story over on the H4 timeframe shows price bottomed just north of support at 0.9854, and whipsawed through its 0.99 handle in the shape of two H4 candles. Stop-loss orders triggered above 0.99 and sellers entering the fray from nearby supply at 0.9933-0.9916 could potentially drag price action lower from an intraday perspective.
Areas of consideration:
Intraday shorts may look to fade 0.99, targeting yesterday’s low 0.9857/H4 support at 0.9854. Aside from this, we do not really see much else to hang our hat on, as weekly/daily structure currently opposes with one another.
Today’s data points: US prelim UoM consumer sentiment; FOMC member Bostic speaks.
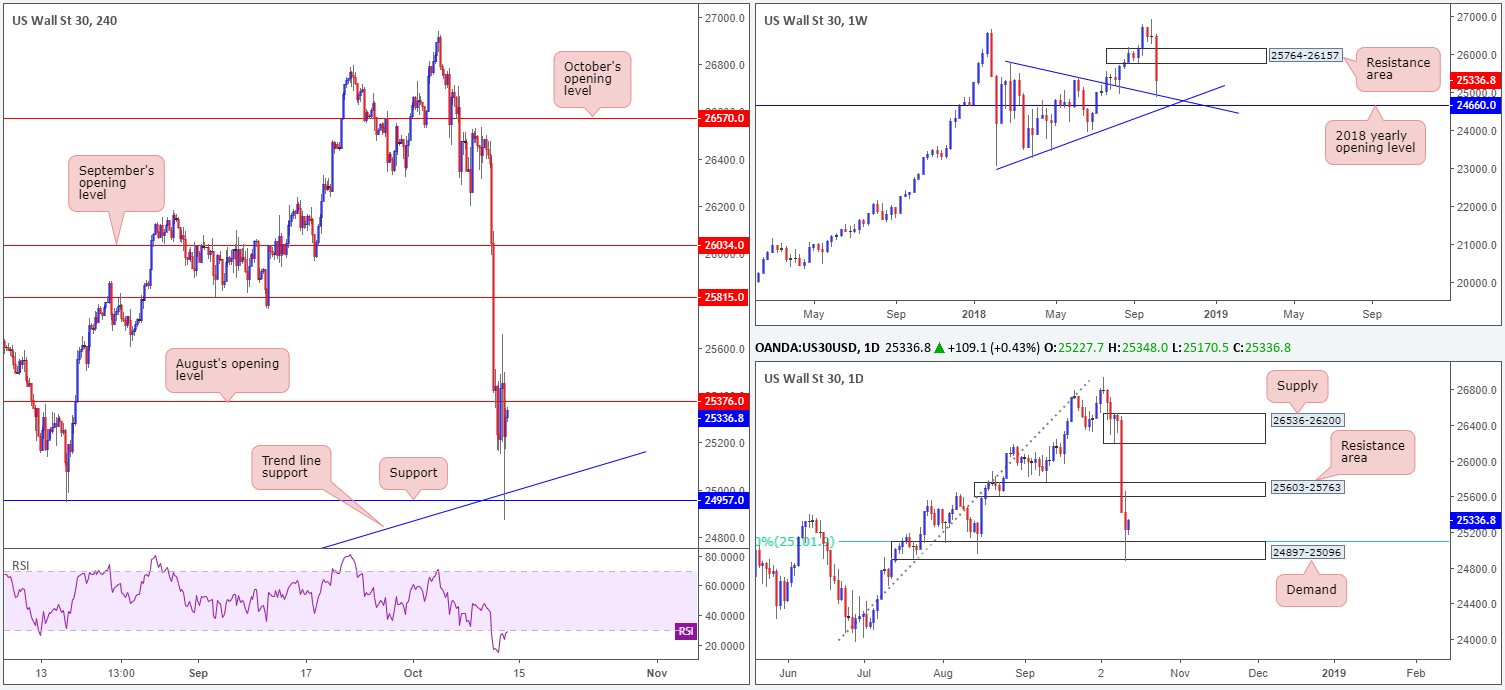
Dow Jones Industrial Average:
US equities have some real concerns at the moment. Rising interest rates, trade conflict with China and anxieties regarding an ageing bull market saw the Dow Jones Industrial Average print its second consecutive daily loss on Thursday.
However, there could be some light at the end of the tunnel according to our technical studies. Kicking off things from the top, weekly price recently shook hands with a trend line resistance-turned support (taken from the high 25807), which hovers just north of the 2018 yearly opening level at 24660. A closer look at the action on the daily timeframe brings in demand at 24897-25096 and its 61.8% Fib support at 25101. Although demand suffered a minor breach, the area remains in play.
H4 movement also checked in with support penciled at 24957 (situated within the lower limits of the current daily demand zone) and a merging trend line support (etched from the low 23451). The next upside target on this scale, however, is seen close by at 25376: August’s opening level.
Areas of consideration:
From a technical perspective, having seen all three timeframes engage with supportive structure yesterday, a break of August’s opening level at 25376 is probable today. Should this come to fruition and the H4 candles retest 25376 as support in the shape of a bullish candlestick formation, longs are high probability with an initial upside target priced in at 25603: the underside of a daily resistance area.
Today’s data points: US prelim UoM consumer sentiment; FOMC member Bostic speaks.
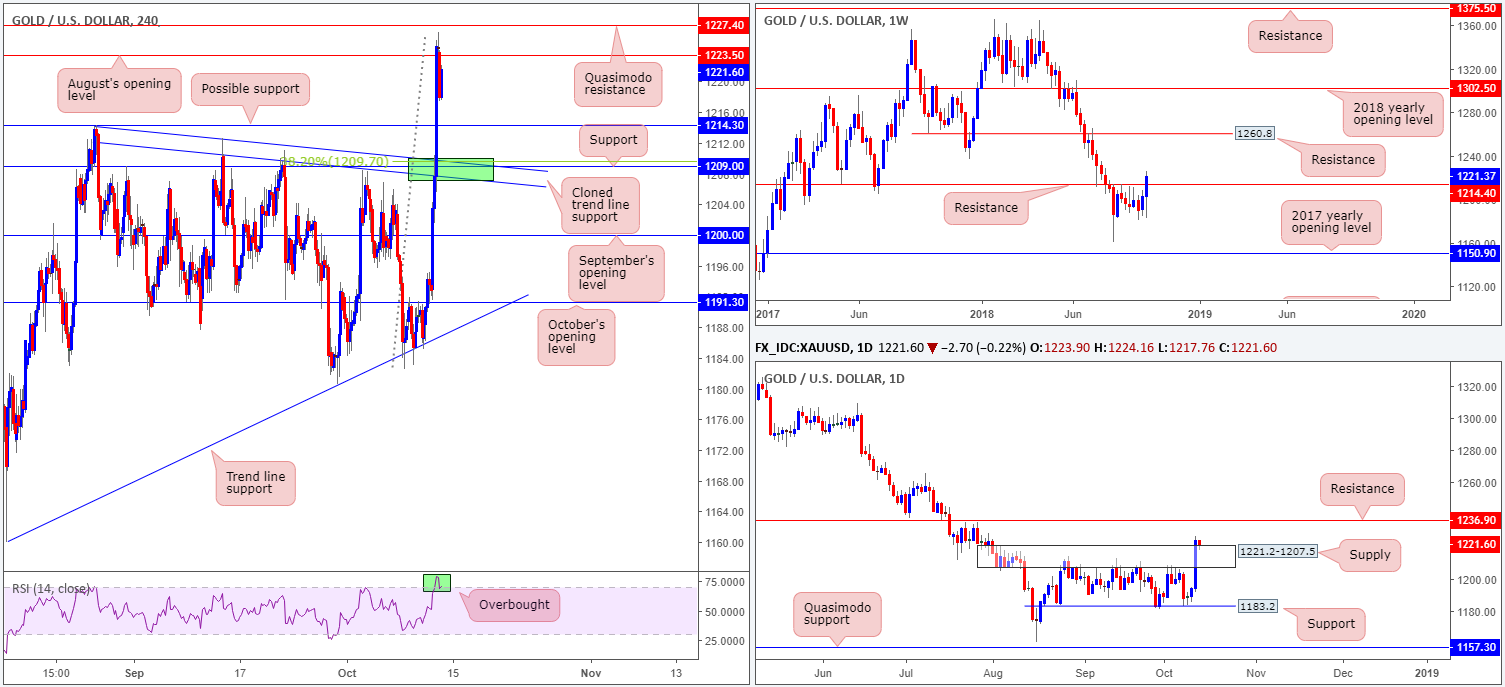
XAU/USD (Gold):
Working our way from the weekly timeframe this morning, we can see recent events brought the price of gold higher, consequently overthrowing resistance at 1214.4. Assuming the metal closes the week out above this barrier, further upside could be on the cards next week, targeting resistance at 1260.8.
Daily supply at 1221.2-1207.5 was aggressively taken out on Thursday, likely tripping a truckload of stop-loss orders and clearing the pathway north towards resistance plotted at 1236.9.
Over on the H4 timeframe, the team noted bullion mildly pared gains off August’s opening level at 1223.5 into the closing stages of recent trade. In terms of this scale, Possible support at 1214.3 (August 28 high) could emerge today and bolster price action, though the more resilient support appears to be priced in a little lower on the curve at 1209.0 (intersects with a cloned trend line resistance-turned support taken from the high 1214.3 – green zone).
Areas of consideration:
Given the current landscape, the metal certainly has a bullish vibe this morning!
H4 support mentioned above at 1209.0, along with its converging cloned trend line resistance-turned support, is an area worthy of attention. A bounce from here in the form of a bullish candlestick pattern, either on the H1 or H4, has an initial target at daily resistance drawn from 1236.9, followed then by an ultimate target on the weekly timeframe at 1260.8.
H4 resistances at 1214.3/1223.5/1227.4 should also be taken into consideration as possible areas sellers may enter the market, though higher-timeframe flows will likely eventually pull price beyond these points.
The use of the site is agreement that the site is for informational and educational purposes only and does not constitute advice in any form in the furtherance of any trade or trading decisions.
The accuracy, completeness and timeliness of the information contained on this site cannot be guaranteed. IC Markets does not warranty, guarantee or make any representations, or assume any liability with regard to financial results based on the use of the information in the site.
News, views, opinions, recommendations and other information obtained from sources outside of www.icmarkets.com.au, used in this site are believed to be reliable, but we cannot guarantee their accuracy or completeness. All such information is subject to change at any time without notice. IC Markets assumes no responsibility for the content of any linked site. The fact that such links may exist does not indicate approval or endorsement of any material contained on any linked site.
IC Markets is not liable for any harm caused by the transmission, through accessing the services or information on this site, of a computer virus, or other computer code or programming device that might be used to access, delete, damage, disable, disrupt or otherwise impede in any manner, the operation of the site or of any user’s software, hardware, data or property.


