
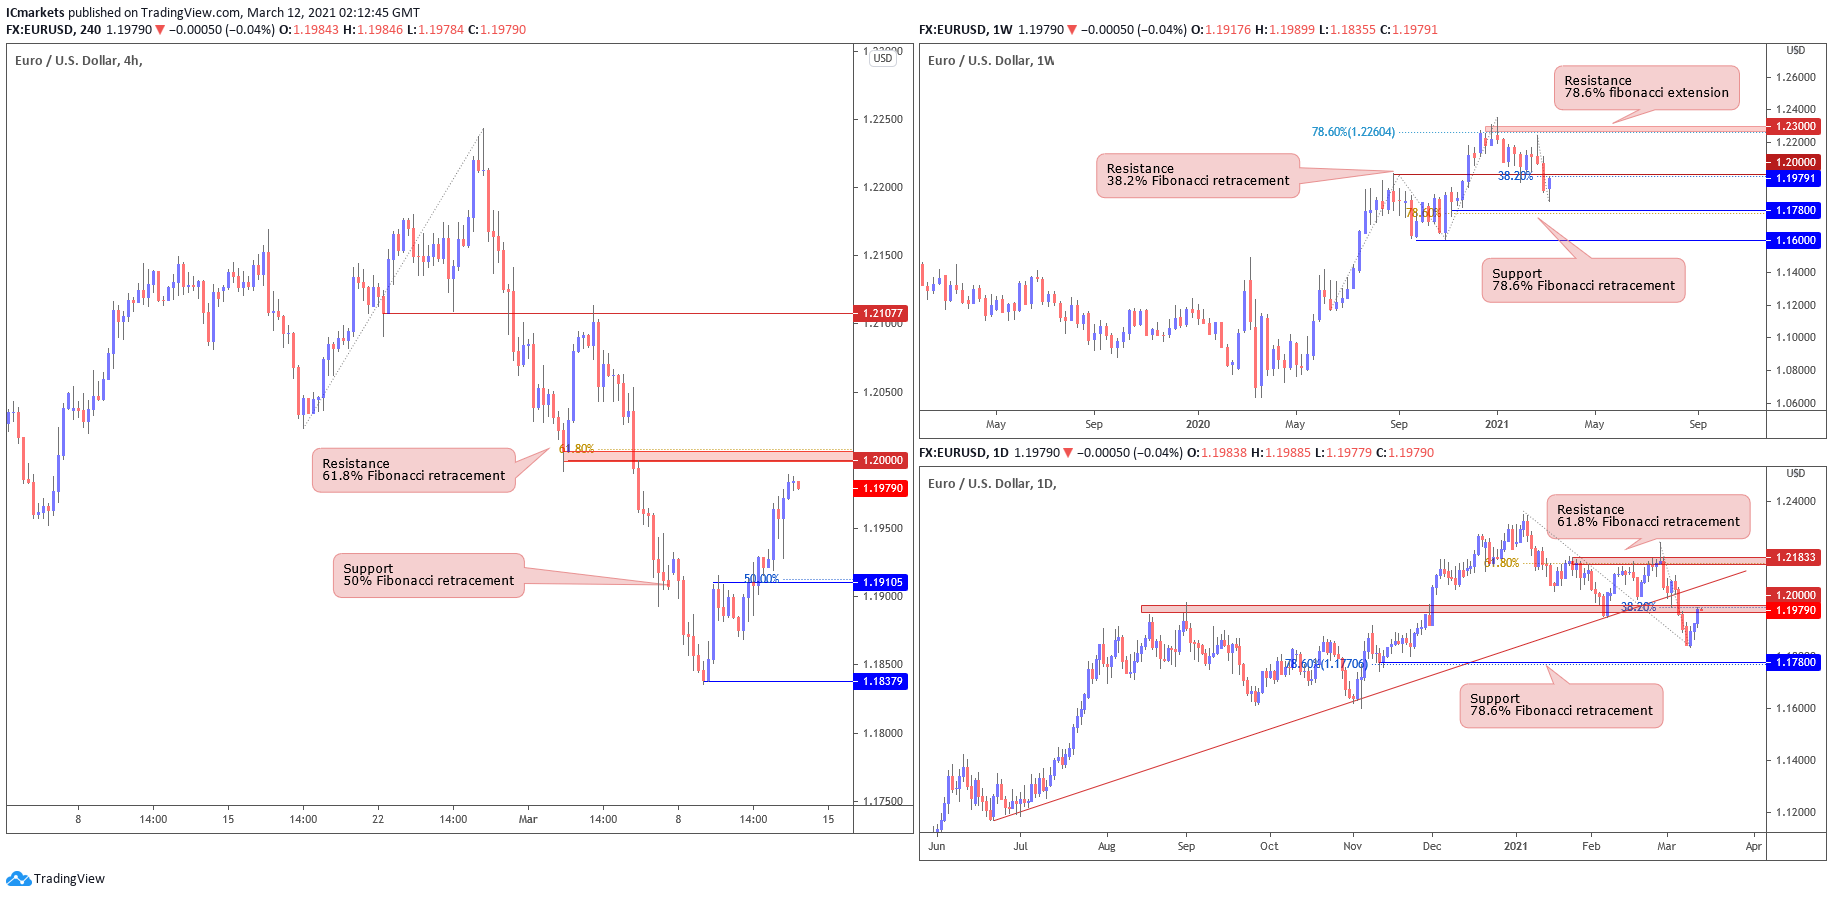
EUR/USD:
Looking at the weekly chart, we can see that prices broke our ascending trend line and key support-turned-resistance level at 1.20000, where we could see a further downside before prices reach the next support target at 1.17800, which coincides with 78.6% Fibonacci retracement.
The daily time frame echoes the same bearish view as well and we could see a further downside below our resistance level at 1.2000, with 1.17800 as the next support target.
On the H4 timeframe, prices are approaching our resistance level at 1.2000, in line with the 61.8% fibonacci retracement. We could see a further drop below our H4 resistance level to test our daily support level at 1.19105.
Areas of consideration:
- 19105 support area found on H4 time frame
- 2000 resistance area on weekly, daily and H4 time frames
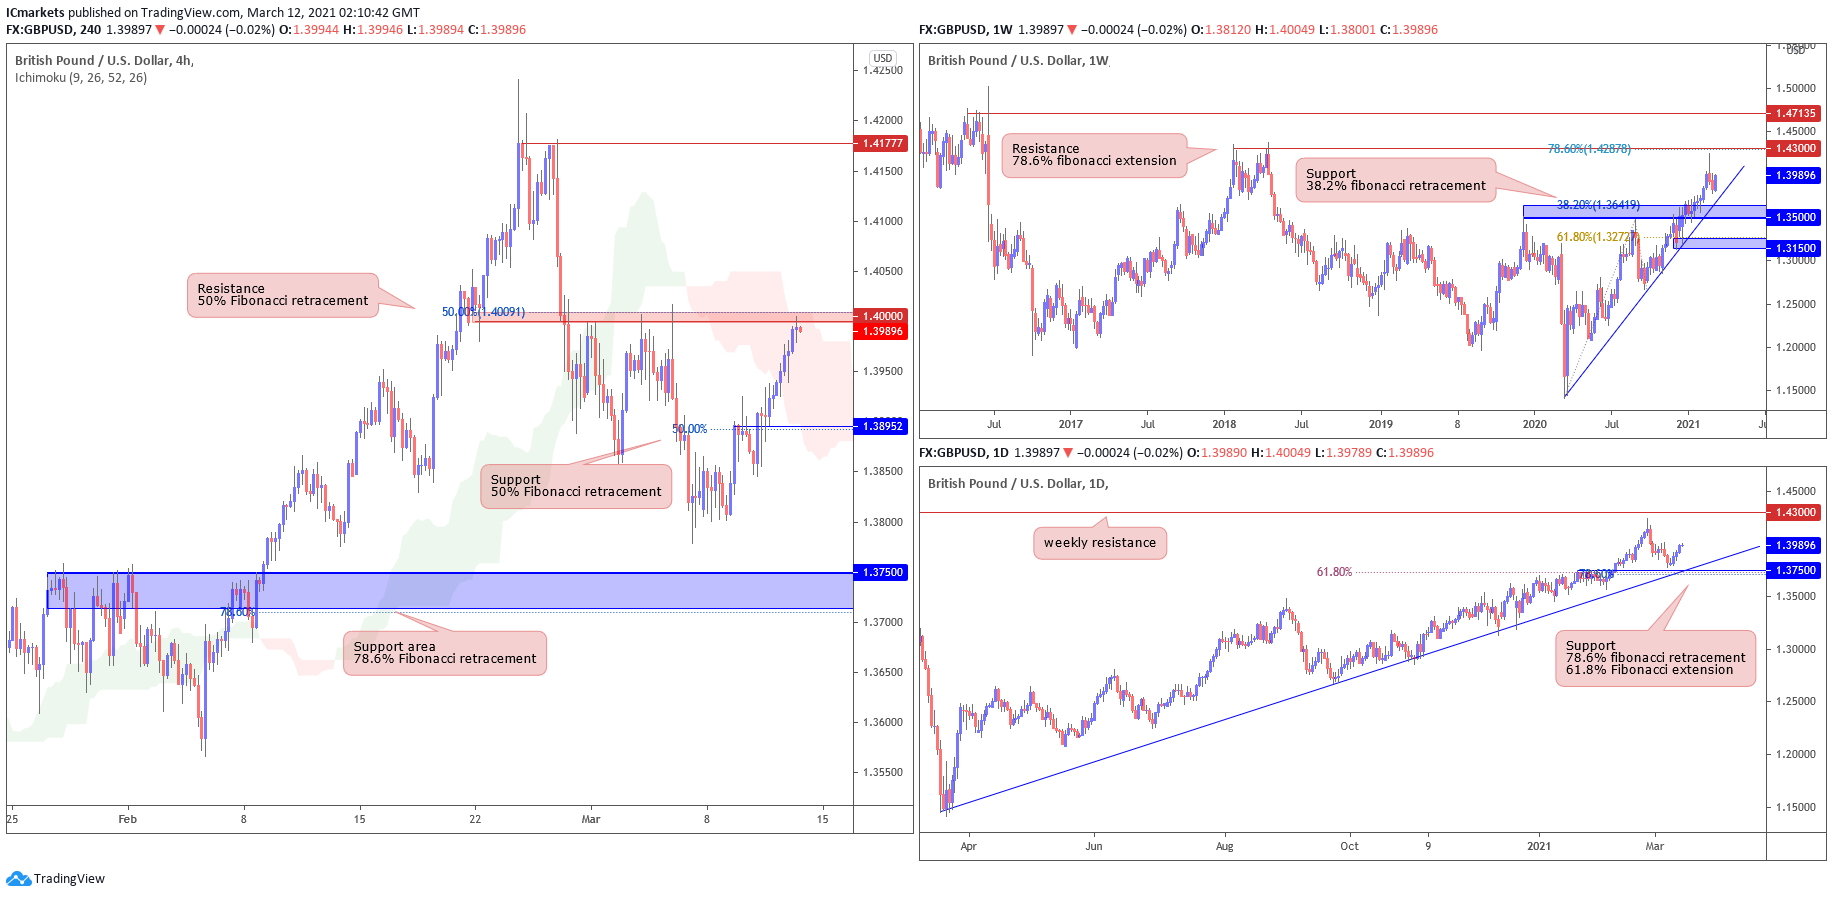
GBP/USD:
Looking at the weekly chart, we can see that prices are approaching our ascending trend line and weekly support area at 1.35000 where we could see a further downside before it reaches our support level, in line with the graphical pullback support area and 38.2% Fibonacci retracement.
On the daily time frame, prices are approaching our support area at 1.37500, which coincides with the 78.6% Fibonacci retracement, 61.8% fibonacci extension and ascending trend line. Both time frames echo the same view that we could be seeing further downside before prices reach our support area.
On the H4 timeframe, prices are facing bearish pressure from our resistance area at 1.4000, in line with our graphical overlap resistance area and 50% fibonacci retracement. We could see a further drop below this level to test our next support level at 1.38952, which is the key support level found on the H4 frame.
Areas of consideration:
- 4000 resistance area found on H4 time frame
- 38582 support area found on H4 timeframe
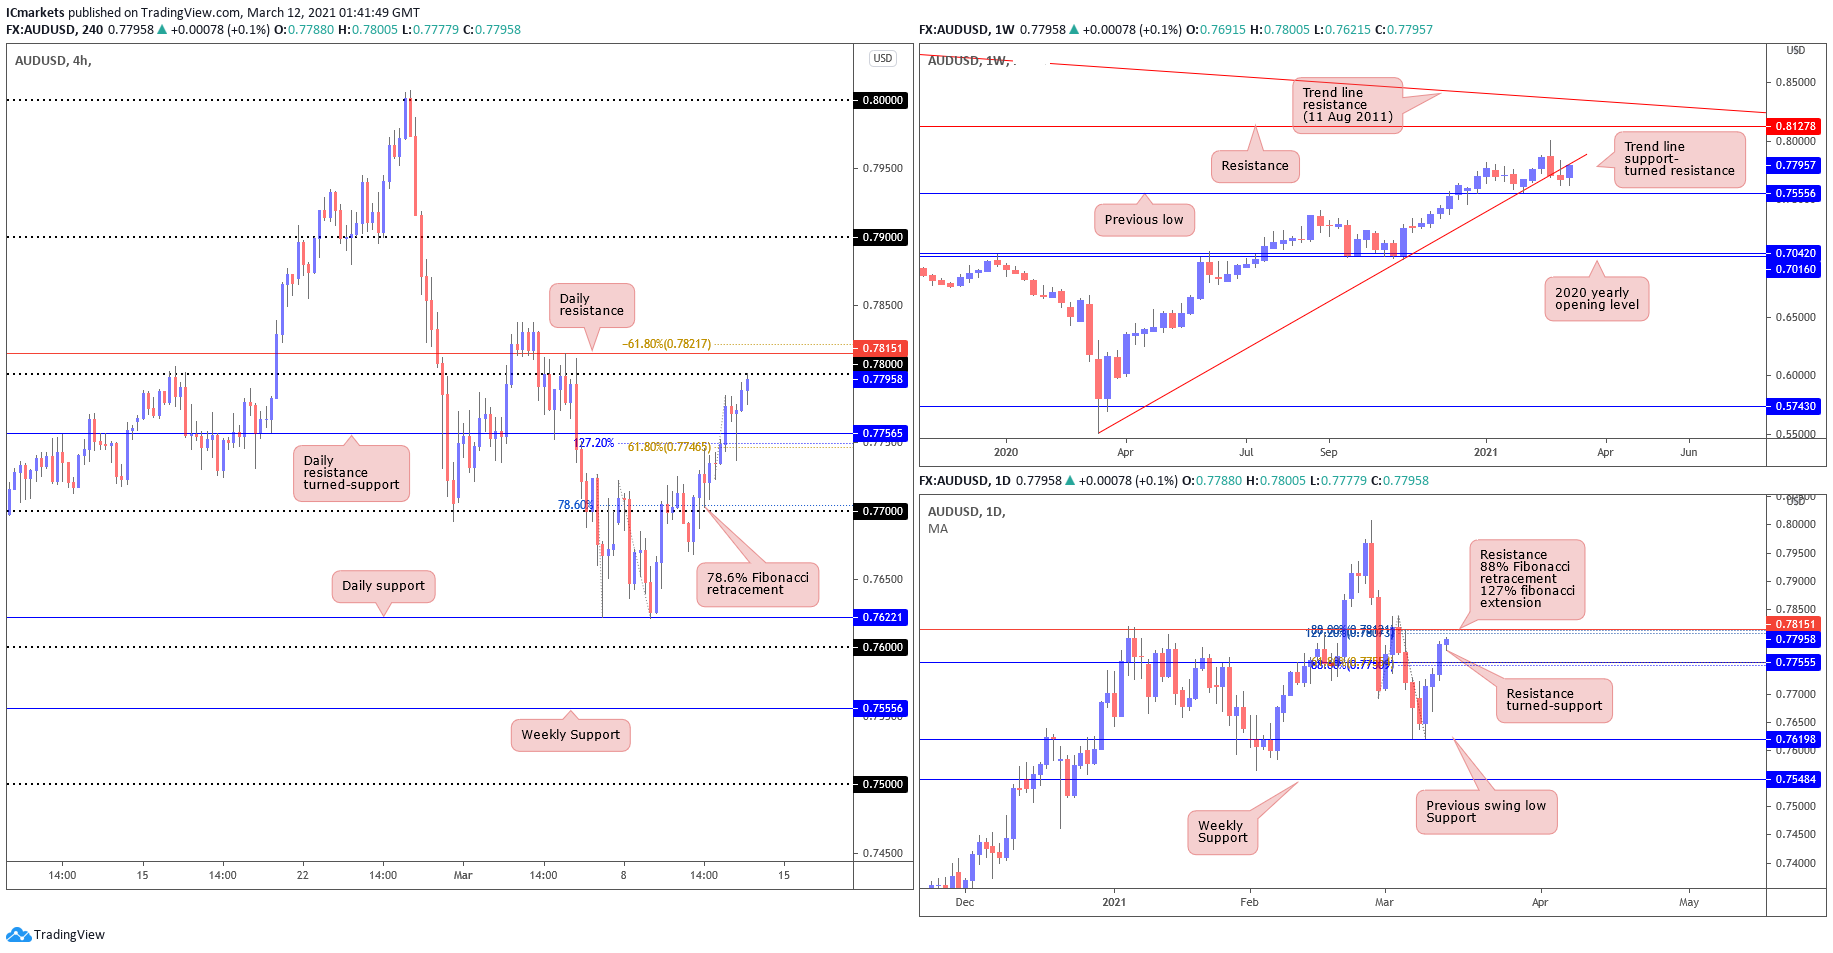
AUD/USD:
From the Weekly timeframe, we can see that the price has broken the ascending trendline support turned-resistance drawn from 9th March (2020), where the current move of the price is showing us a retest of this trendline.
On the Daily timeframe, price has managed to break above the 0.77555 level of resistance where 61.8% fibonacci retracement and 88% fibonacci extension level are, and is now a resistance turned-support level. Price is also approaching the next level of resistance at 127% fibonacci extension and 88% fibonacci retracement. And lastly, on the H4, price has broken the trendline twice, thus will be removed from the H4 analysis. And as expected, price managed to stay above the 78.6% fibonacci retracement and push up further towards 127% fibonacci retracement, and is now approaching the 0.78 major figure, -68% fibonacci retracement, daily resistance as well as previous swing high level.
Areas of consideration:
- H4 price may push up further towards previous Daily resistance
- Weekly and Daily time frames are showing weakness in bullish momentum.
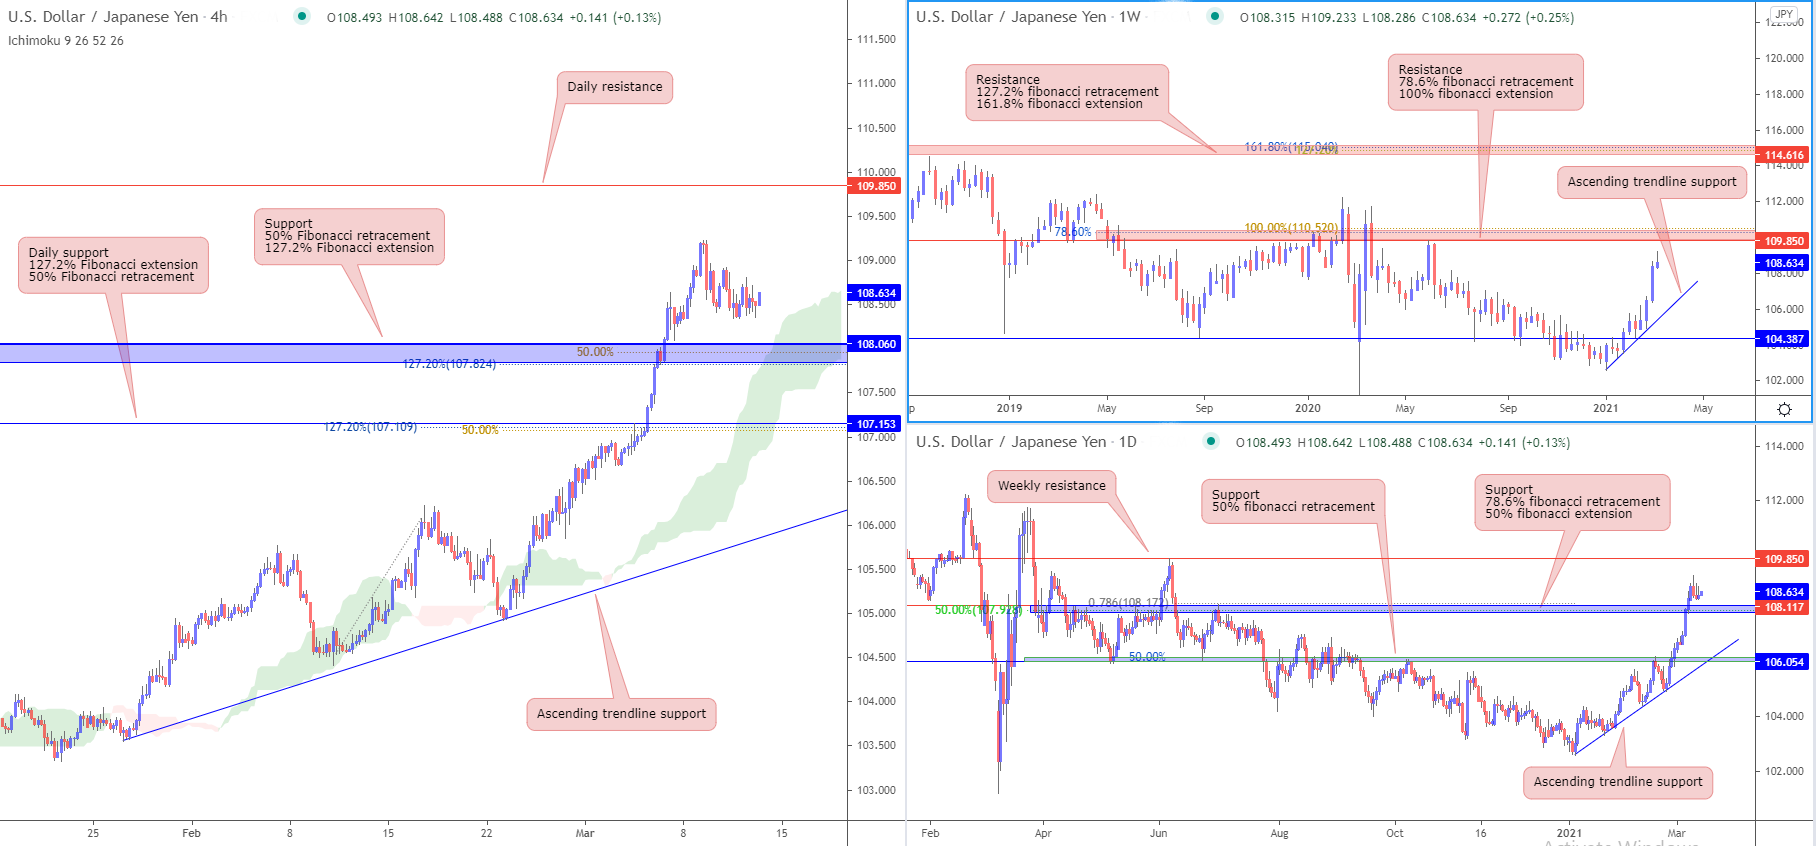
USD/JPY
From the weekly timeframe, prices are reaching resistance which coincides with horizontal swing high as well as 100% fibonacci extension and 78.6% fibonacci retracement.
On the daily time frame however, a smaller pullback could be seen and prices might pullback to the support level which coincides with 78.6% fibonacci retracement and 50% fibonacci extension. In the H4 time frame, prices might bounce from support level which coincides with 50% fibonacci retracement and 127.2% fibonacci extension to the weekly horizontal swing high resistance level. Prices are also holding above Ichimoku cloud, suggesting a bullish pressure on prices.
Areas of consideration:
- On the H4, prices might pull back to 108.060 level which coincides with 50% fibonacci retracement and 127.2% fibonacci extension
- 850 is a strong resistance level
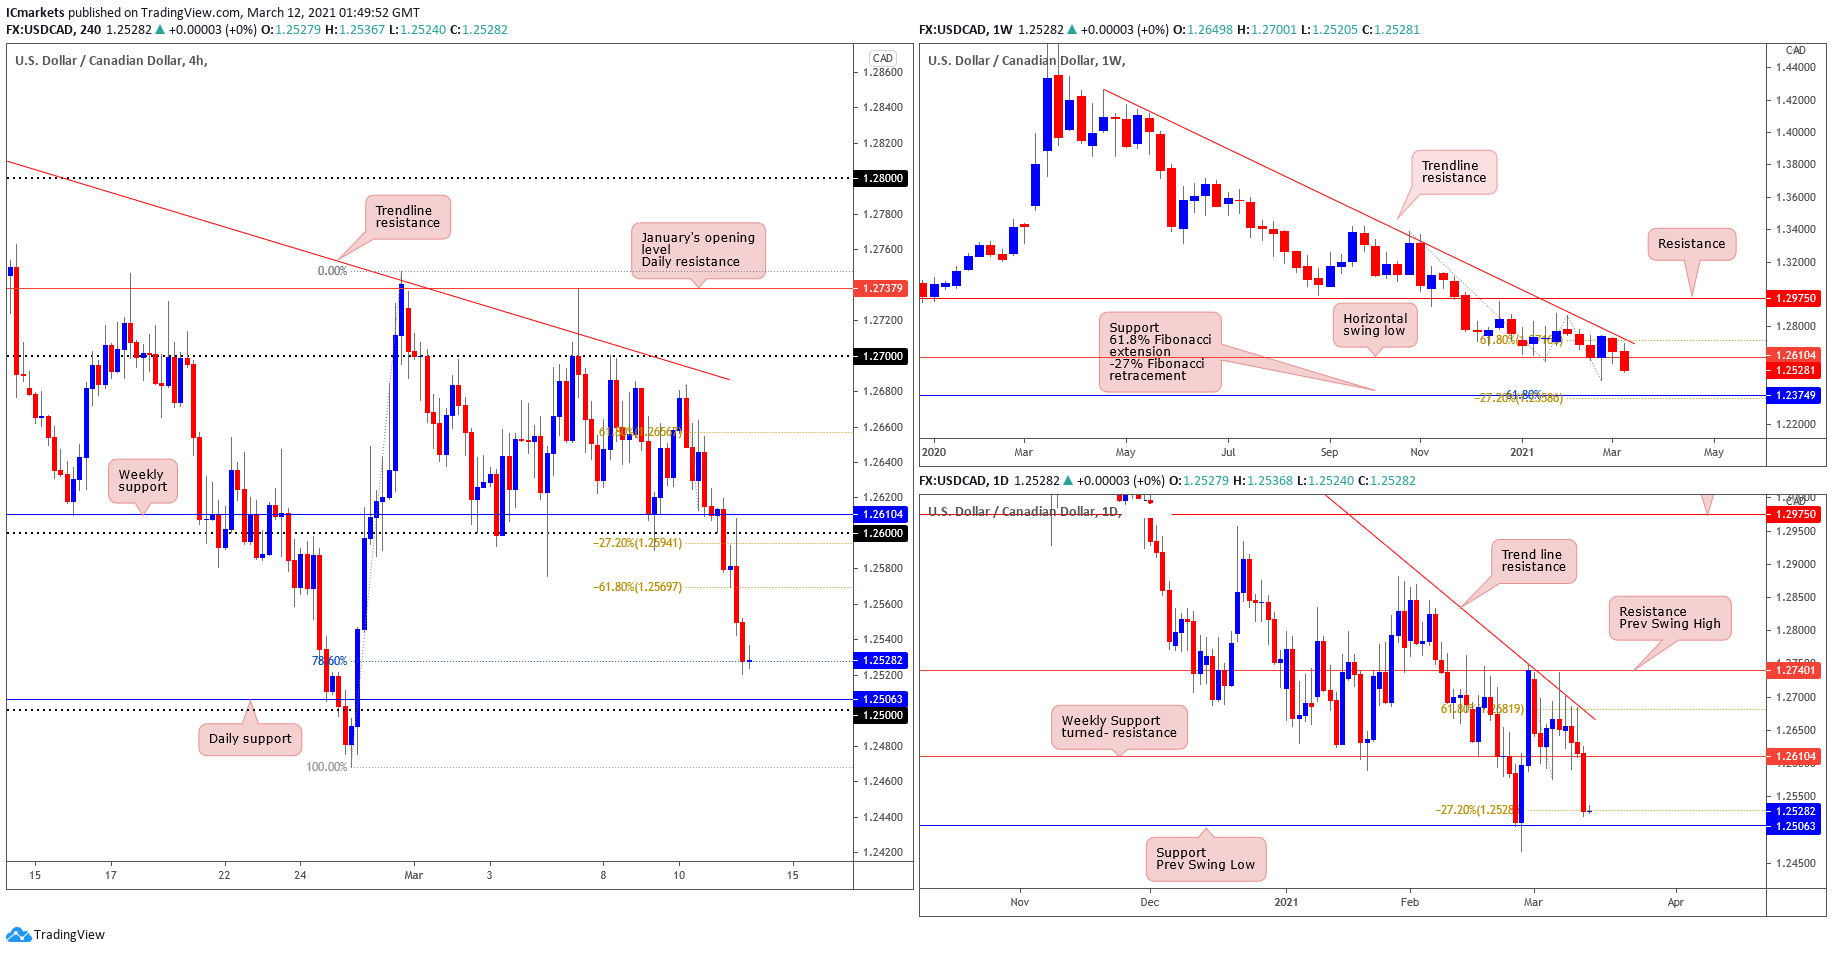
USD/CAD:
Looking at the weekly chart, price has broken the horizontal swing low support, where we may expect a retest before continuation of this down trend since March (2020). The next level where price may find support is at the 1.23749, where the fibonacci confluences are.
In the daily time frame, we are able to see that price has reversed from the 61.8% fibonacci retracement and made a push down towards the 1.25288 level where -27% fibonacci retracement is, signifying more bearish momentum may be coming. Lastly, on H4, we are able to see price reversed from the 61.8% fibonacci retracement level and pushed past -27%, -61.8% fibonacci retracement, 1.26 major figure and horizontal graphical support level. Currently, price is at the 78.6% fibonacci retracement, if broken towards the downside, we may see a retest of the 1.24680 swing low level.
Areas of consideration:
- H4 may drop further towards 1.24680 once 78.6% fibonacci retracement is broken.
- Daily and weekly time frame are both showing bearish momentum.
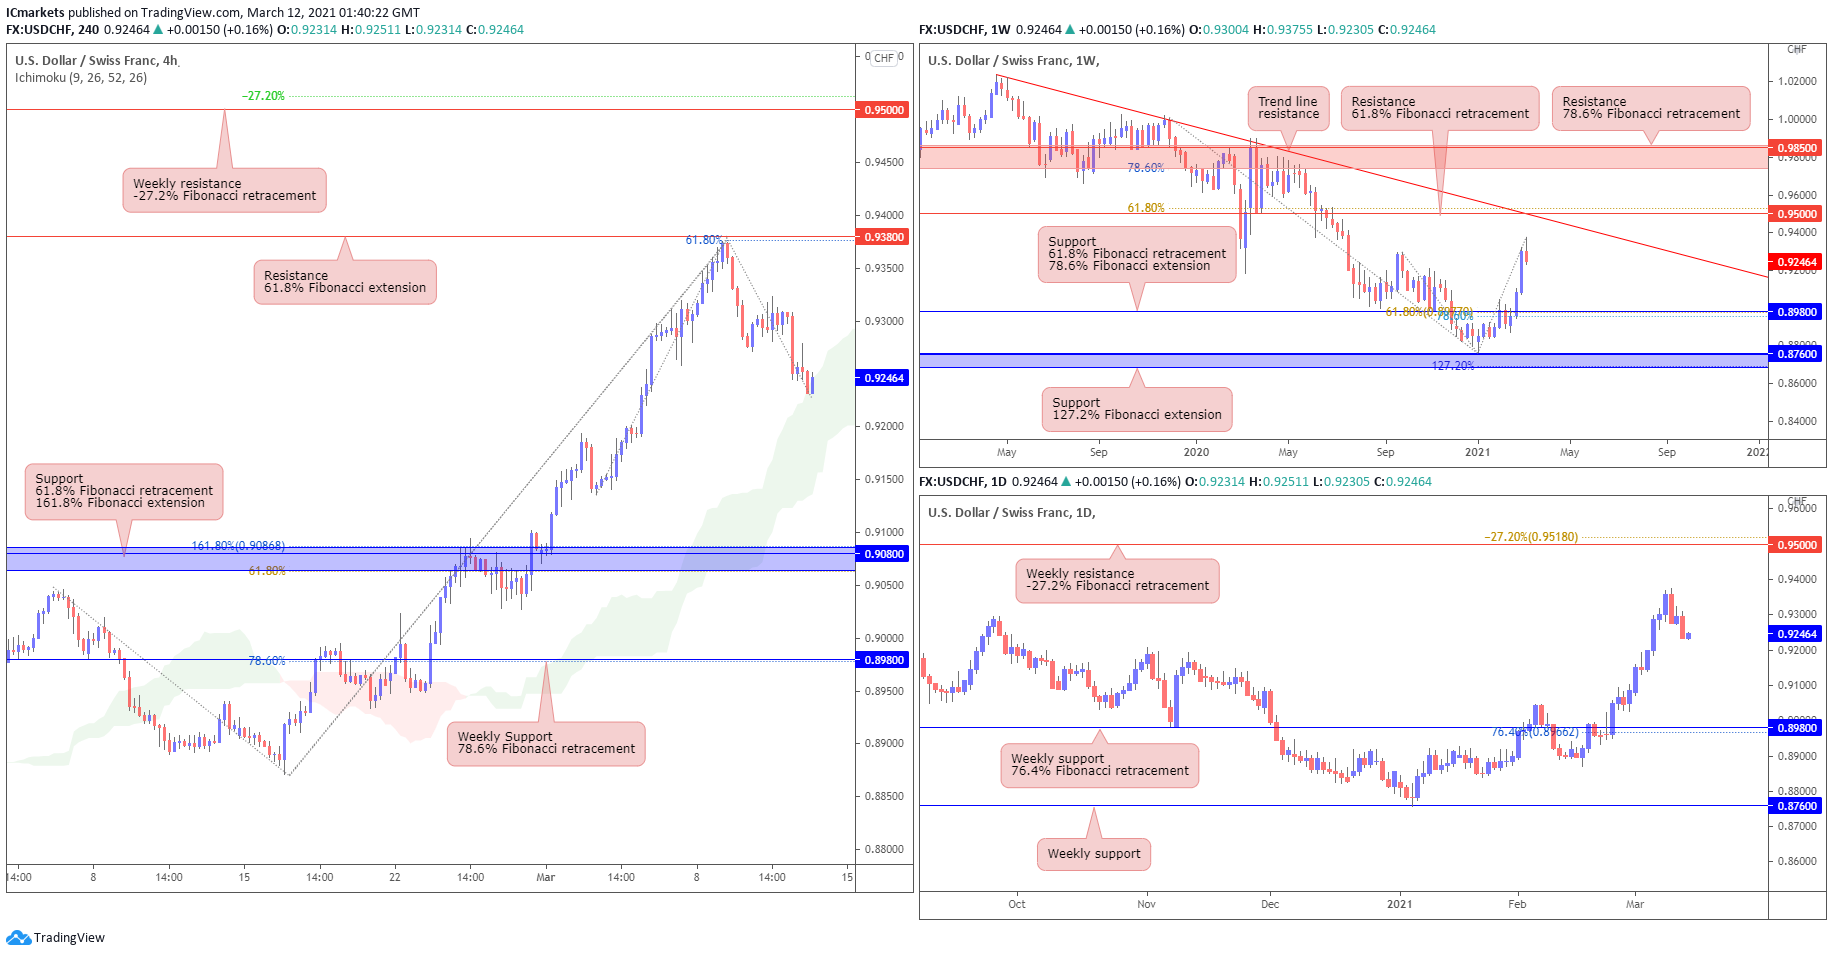
USD/CHF:
On the weekly chart, USD/CHF is approaching the descending trendline resistance and weekly 0.95000 resistance level, which is in line with our 61.8% Fibonacci retracement. The daily timeframe shows a similar picture as price is making a slight pullback as well. We could potentially see price make a further rise up to test the weekly 0.95000 resistance level.
On the H4 chart, we see that price has pulled back from our resistance level at 0.93800, which is in line with our 61.8% Fibonacci extension level. We note that price is still holding above the Ichimoku cloud, indicating room for further bullish pressure. In this scenario, we could potentially see price push higher to retest the 0.93800 resistance level. Otherwise, should price hold below the 0.93800 level, we could see it push lower to test eh 0.90800 weekly support level, in line with our 61.8% Fibonacci retracement and 161.8% Fibonacci extension.
Areas of consideration:
- Price could continue with further bullish momentum to test the next resistance level at 0.95000.
- Watch the 0.93800 resistance level closely on the H4 timeframe
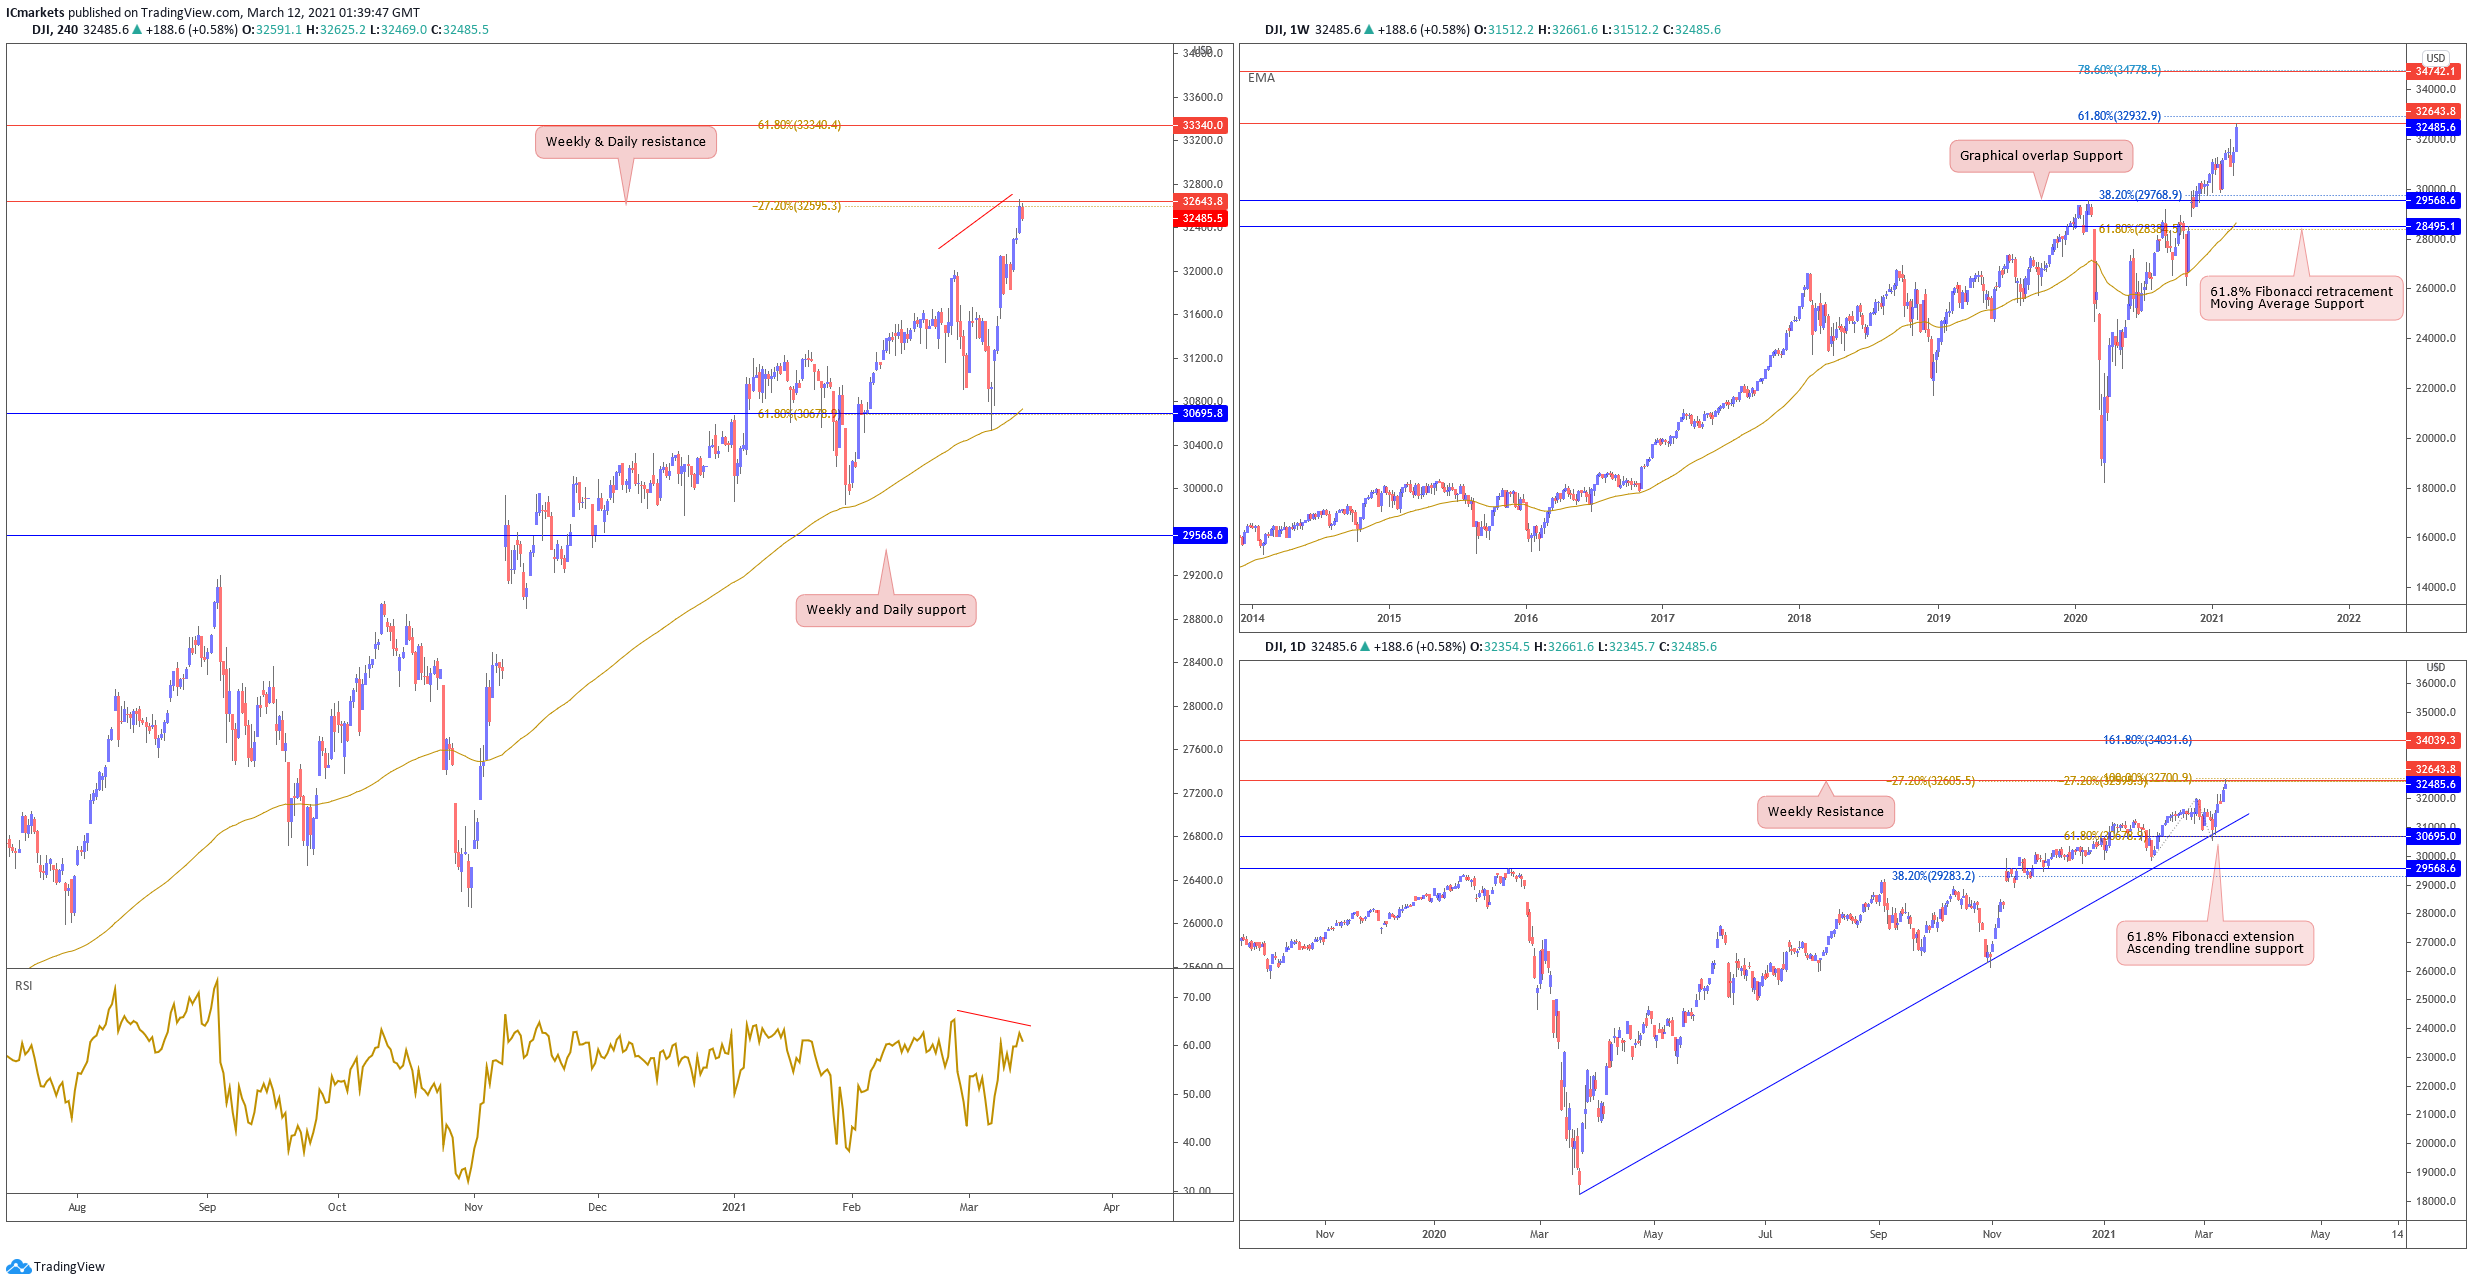
Dow Jones Industrial Average:
On the weekly chart, price pushed higher testing 32643 resistance. Only a weekly close below this resistance could see price pullback lower next week. On the Daily, price pushed higher as well and is also holding below 32643 weekly resistance. A short term pullback below this level could be likely. Otherwise, a break above 32643 resistance will see price rise further towards 34039 resistance.
On the H4, we note that there is a bearish divergence forming on the H4 with price holding below weekly and daily resistance at 32643. Sellers could possibly add to their shorts below 32643 resistance with 30695 support as a possible target. Failing to hold below 32643 resistance will see price swing the other way towards next resistance at 33340.
Areas of consideration:
- Watch closely weekly and daily resistance at 32643
- Bearish divergence on the H4
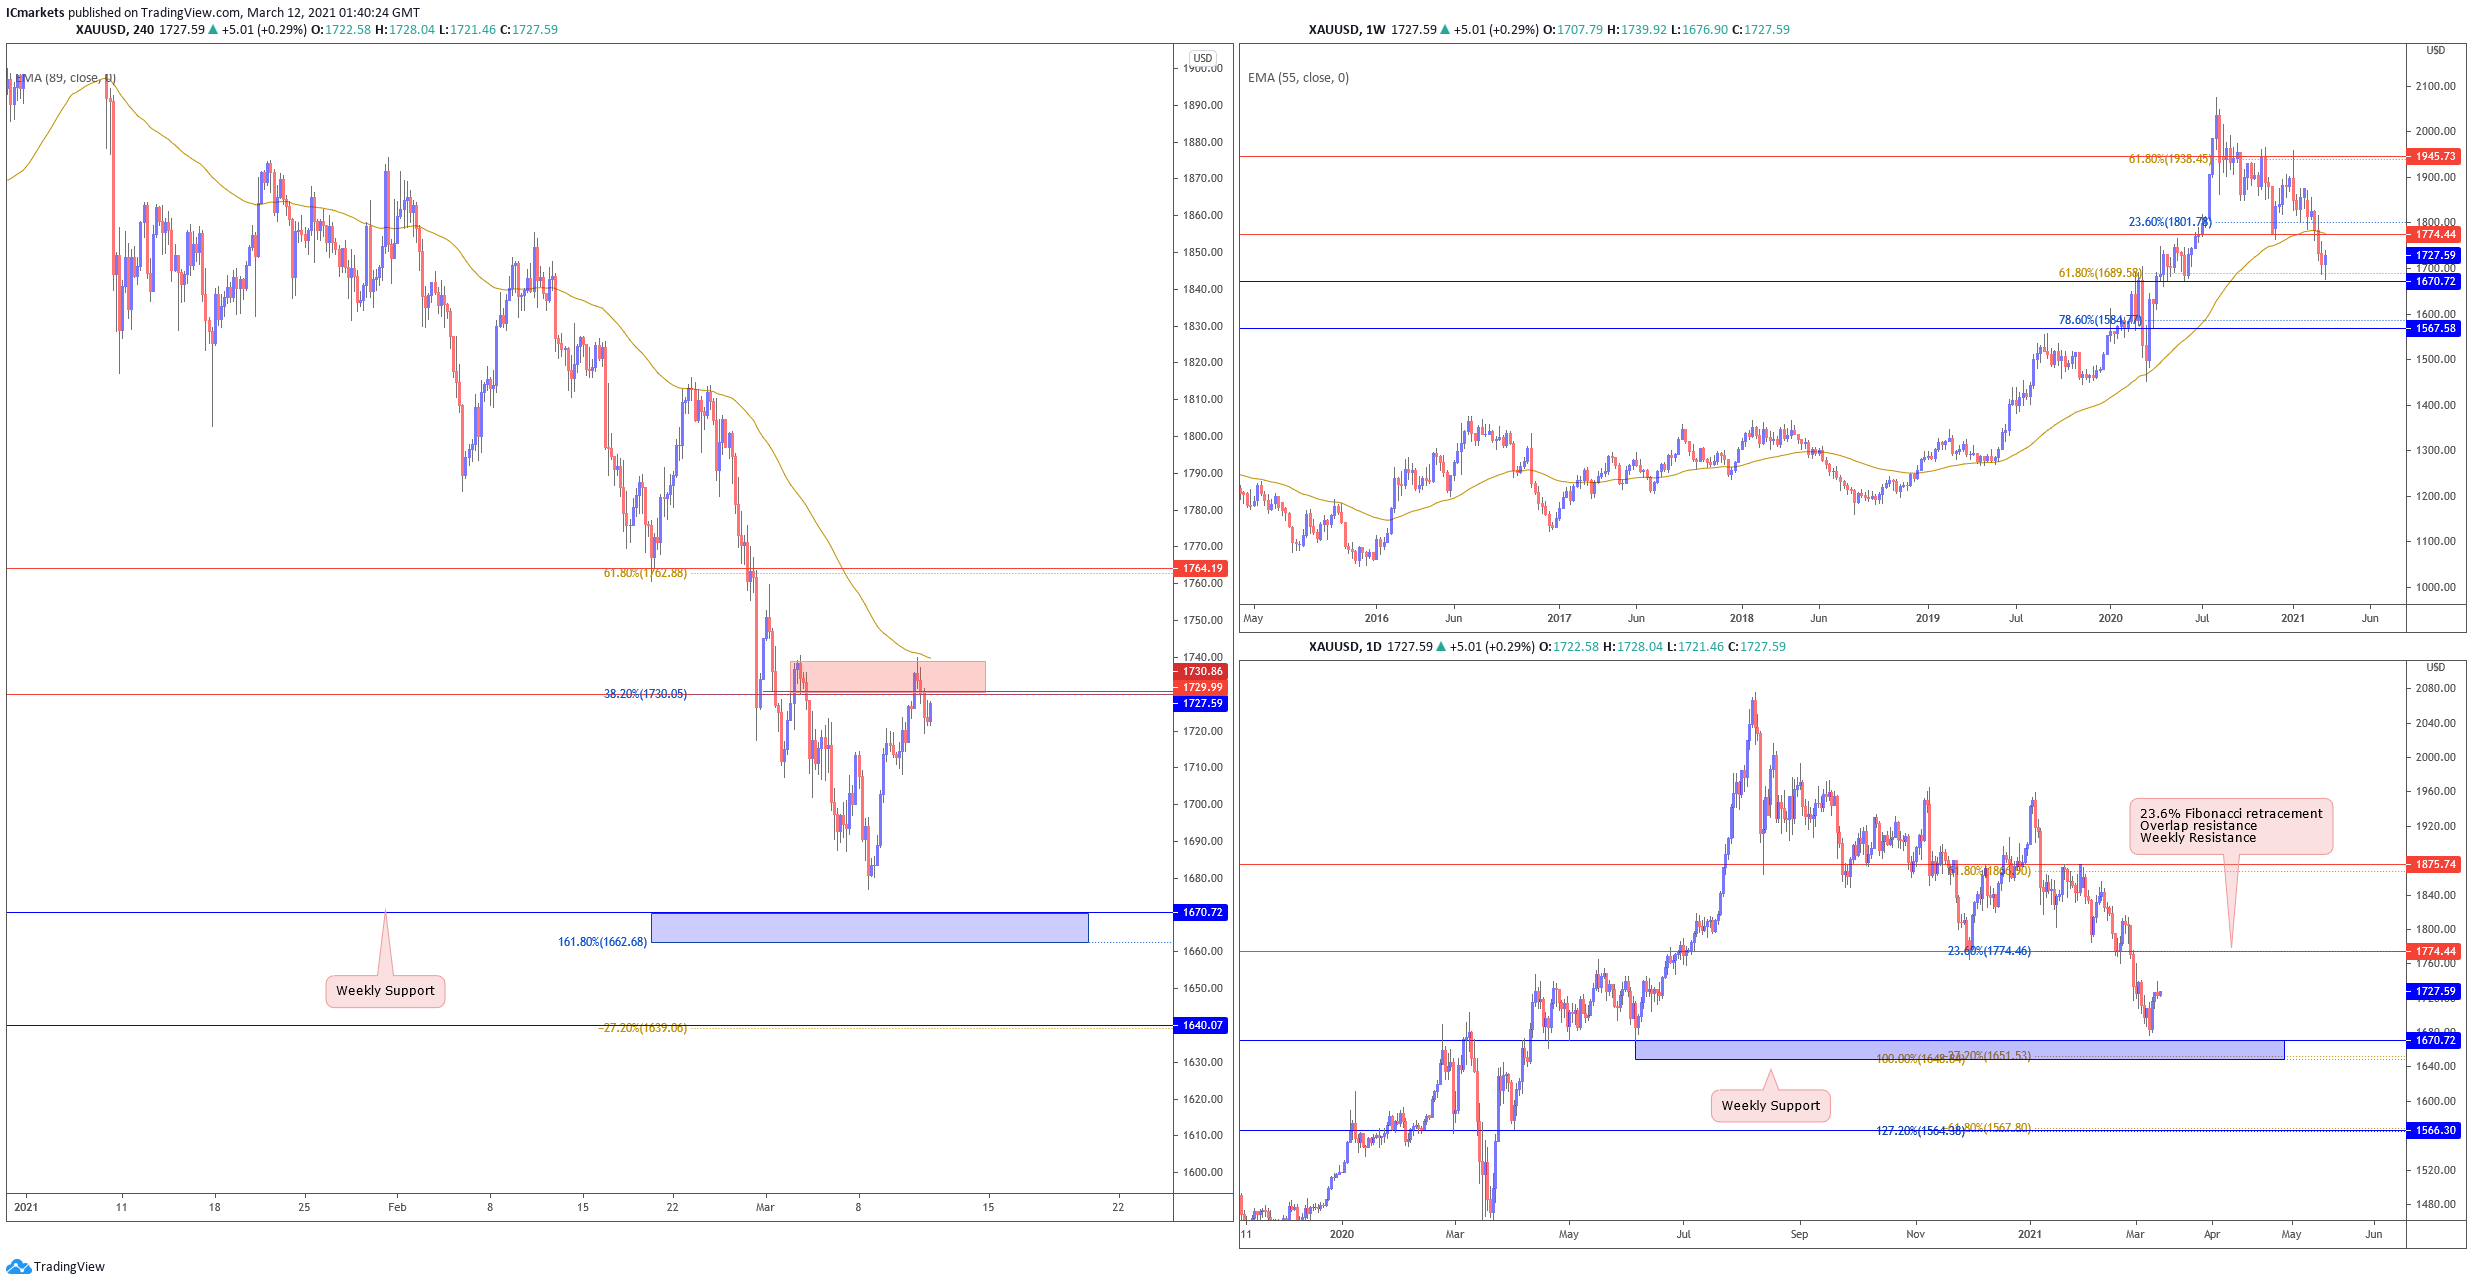
XAU/USD (GOLD):
On the weekly timeframe, gold is currently holding above 1670 support which is in line with key 61.8% Fibonacci retracement level. A weekly close above this support level could possibly see a further bounce next week. On the daily chart, we see price reacting above weekly support at 1670. A limited push up towards 1774 resistance could be likely.
On the 4H timeframe price tested and is still holding below the moving average and 1730 resistance, we see a medium probability bearish scenario where sellers may enter at this area and add to their shorts to push price lower towards 1670 weekly support. Failure to hold below 1730 will see price rise towards next resistance at 1764.
Areas of consideration:
- Watch closely 1730 intraday resistance
The accuracy, completeness and timeliness of the information contained on this site cannot be guaranteed. IC Markets does not warranty, guarantee or make any representations, or assume any liability regarding financial results based on the use of the information in the site.
News, views, opinions, recommendations and other information obtained from sources outside of www.icmarkets.com.au, used in this site are believed to be reliable, but we cannot guarantee their accuracy or completeness. All such information is subject to change at any time without notice. IC Markets assumes no responsibility for the content of any linked site.
The fact that such links may exist does not indicate approval or endorsement of any material contained on any linked site. IC Markets is not liable for any harm caused by the transmission, through accessing the services or information on this site, of a computer virus, or other computer code or programming device that might be used to access, delete, damage, disable, disrupt or otherwise impede in any manner, the operation of the site or of any user’s software, hardware, data or property.


