
EUR/USD:
Weekly view – From the weekly timeframe, we can see that price is now crossing swords with the weekly supply area coming in at 1.1532-1.1278 again. This supply zone is a very significant hurdle in our opinion since if there is a sustained break above this area, our long-term bias on this pair will very likely shift north.
Daily view: Wednesday’s rebound seen from just below the daily Quasimodo cluster zone at 1.1390/1.1421 (located relatively deep within the aforementioned weekly supply area) extended lower during the course of yesterday’s session. Should the market continue to sell off from here, it is likely price will connect with the daily swap area at 1.1051-1.1000 sometime in the near future.
4hr view: From the 4hr scale, we can see that the Euro pair slid below the 1.1300 level yesterday at around 8am London time, resulting in quite an aggressive sell off down to 1.1200, which, as you can see, held firm going into the U.S session.
With price currently trading around the mid-level number 1.1250, we do not see any immediate opportunity to trade this pair as per our trading plan. Nonetheless, this is what we have noted so far…
Both 1.1300 and 1.1200 will likely be key levels going into today’s sessions. We personally have no interest in trying to fade 1.1200 (even though it held recently). The reason for why is simply because of where price is located on the higher timeframes at the moment (see above). We are, however, interested in fading 1.1300. Of course, a short trade will only be taken from here if there’s corresponding lower timeframe confirming price action (engulf of demand, trendline break etc.). If on the other hand 1.1300 is violated today, we’ll then be watching for a sharp spike up to the 4hr Quasimodo base in green at 1.1443-1.1411, where we have a pending sell order set just below at 1.1407 with a stop placed above at 1.1469. We’re not ignoring the yellow sell zone (between the 4hr supply area at 1.1378-1.1335 and a 4hr Quasimodo base at 1.1443-1.1411); we just believe that this area may be slightly weaker due to already being tagged on Wednesday at 1.1385.
And finally, should we see a breach of 1.1200 later on, this could stimulate a decline down towards the 4hr demand area at 1.1048-1.1096 (located just above the daily swap area at 1.1051-1.1000). That said, to trade this move a retest of 1.1200 would need to be seen along with lower timeframe confirmation.
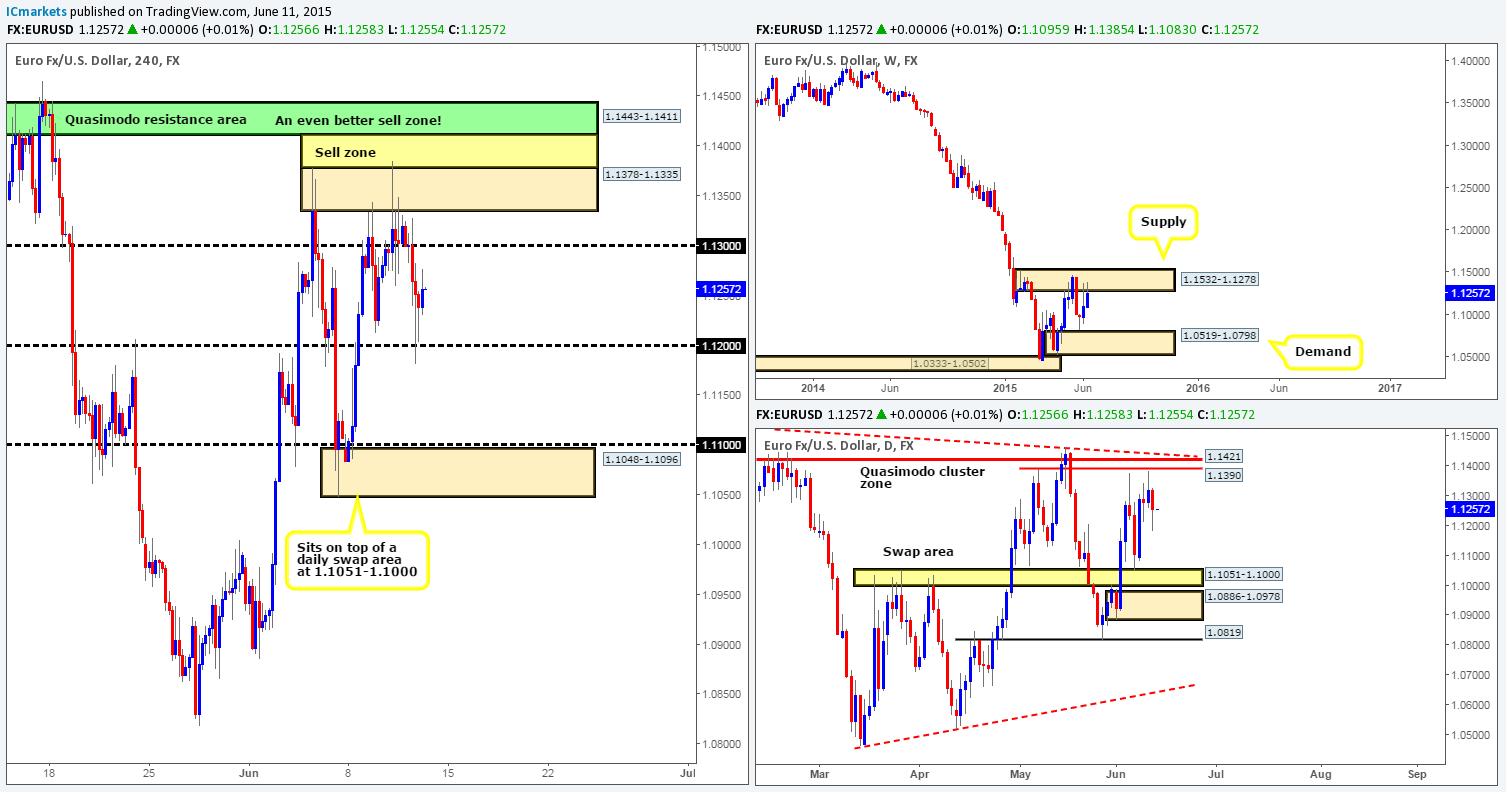
Levels to watch/live orders:
- Buys: Flat (Stop loss: N/A).
- Sells: 1.1300 [Tentative – confirmation required] (Stop loss: dependent on where one confirms this level) 1.1407 (Stop loss: 1.1469).
GBP/USD:
Weekly view – Recent events reveal that the GBP has edged its way above a major weekly swap level coming in at 1.5451. In the event that the buyers can hold out above this number going into the close, it is likely price will be shaking hands with the weekly supply area seen just above it at 1.5824-1.5634 sometime next week.
Daily view: Yesterday’s action shows that the market attempted to sell off from daily supply at 1.5698-1.5530 (located just below the aforementioned weekly supply area). As you can see though, this was a very short-lived move as buyers aggressively defended the daily swap zone sitting just below it at 1.5478-1.5435 going into the close 1.5514. It will be interesting to see how the market reacts to this during today’s session.
4hr view: Looking at the 4hr timeframe, we can see that price recently broke below 1.5500 and connected with a 4hr swap area coming in at 1.5440-1.5400, which as you can clearly see pushed price back above the 1.5500 barrier.
The GBP/USD pair is in a tricky spot in our opinion. On the one hand we see price sandwiched between a daily supply zone and a daily swap area, and on the other price is seen trading a little above a weekly swap level indicating further buying could ensue (see weekly/daily sections above). With regards to the weekly timeframe though, it is really very difficult to make any firm decisions without seeing where the current candle closes. If a close higher is not seen, for example, then we believe price is likely going to fall going into next week.
Therefore, with all of the above in mind, the best thing we feel we can do is watch the following areas for any sign a sell off may take place i.e. wait for lower timeframe confirmation. The first zone comes in at 1.5586-1.5566, a 4hr Quasimodo base – remain aware to the possibility that a fakeout may shoot above to the round number 1.5600 here! The second zone is a clear 4hr supply area seen at 1.5698-1.5661. Both of these above zones are located within the aforementioned daily supply area.
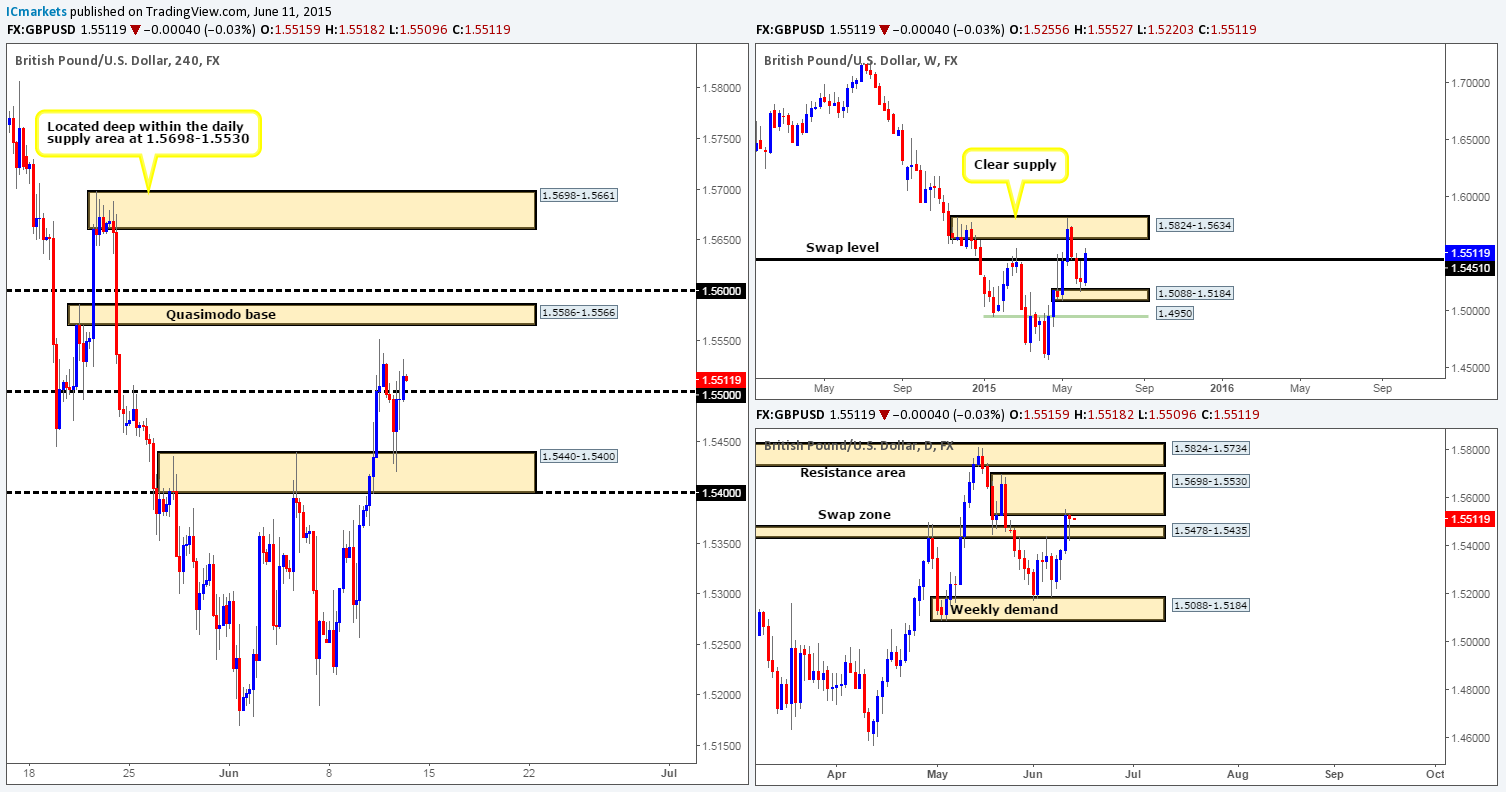
Levels to watch/ live orders:
- Buys: Flat (Stop loss: N/A).
- Sells: 1.5586-1.5566 [Tentative – confirmation required] (Stop loss: 1.5610) 1.5698-1.5661[Tentative – confirmation required] (Stop loss: 1.5710).
AUD/USD:
Weekly view – The weekly timeframe shows price is so far holding nicely around the weekly demand area at 0.7449-0.7678. In the event that the buyers can continue with this tempo, we see little problem in price hitting 0.7845 sometime soon. Nevertheless, Judging by the sloppy reaction seen (pink circle – 02/02/15-06/04/15) at the weekly demand zone a few months earlier, things could potentially get messy here before we see any decisive move take place. From a long-term perspective, the trend direction on this pair is still very much south in our opinion, and will remain this way until we see a convincing break above 0.8064.
Daily view: Following Wednesday’s advance, volatility diminished somewhat going into yesterday’s session, which as a result formed an indecision candle just below a small daily supply area at 0.7838-0.7802 (positioned just below a minor weekly swap level at 0.7845).
4hr view: From this viewpoint, it’s quite clear that the Aussie pair has entered into a phase of consolidation between a 4hr supply area at 0.7817-0.7775, and the psychological hurdle 0.7700. Trading in between this 75-pip range is certainly a possibility today (potential buys: 0.7705 sells: 0.7770). Nonetheless, we would strongly advise only doing so once you have some sort of confirmation signal from the lower timeframes, since fakeouts are so very common in ranging environments such as this.
Considering price is at weekly demand (0.7449-0.7678) at the moment, we see price eventually breaking out north from this range. This, as you can see on the 4hr timeframe, would likely force price to collide with the weekly swap level 0.7845 – a perfect sell zone (green area: 0.7867/0.7845). We firmly believe that this area will at the very least likely see a bounce, and as such, our team has now come to a general consensus and placed a pending sell order just below this zone at 0.7842 with a stop set above at 0.7875.
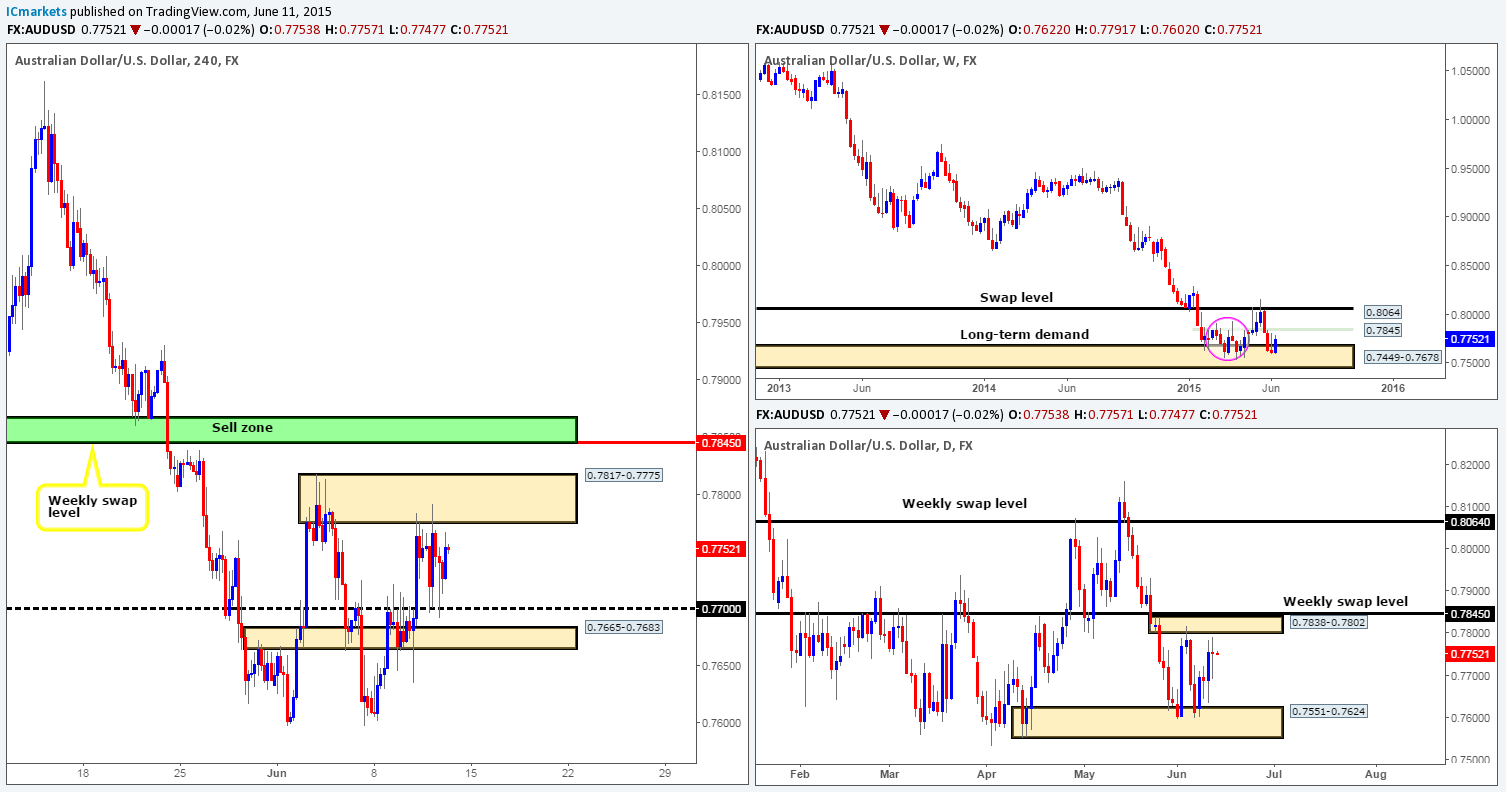
Levels to watch/ live orders:
- Buys: 0.7705 [Tentative – confirmation required] (Stop loss: 0.7656).
- Sells: 0.7770 [Tentative – confirmation required] (Stop loss: 0.7821) 0.7842 (Stop loss: 0.7875).
USD/JPY:
Weekly view – From this angle, we can see that price is currently selling off nicely from a weekly swap level seen at 125.44. On the assumption that the sellers continue with this intensity, it is likely price will greet the minor weekly swap level at 121.57 sometime soon. Despite this recent decline in value, however, the long-term uptrend on this pair is still very much intact, and will remain that way in our opinion until the weekly swap level 115.50 is consumed.
Daily view: The daily timeframe on the other hand, shows that buying interest recently came into the market from a just above a long-term daily swap area (we failed to mark up this zone in our previous analysis) at 122.40-121.73. This barrier is a clear obstacle to a move towards the aforementioned minor weekly swap level sitting just below it.
4hr view: The recent advance from the mid-level number 122.50 took out 123.00 with little to no trouble, and continued marching north until price tied up with 124.00, which as you can see repelled the market going into the early hours of yesterday’s US session.
Considering the somewhat mixed signals we’re receiving from the higher timeframes at the moment (see above in bold), it is very difficult to judge direction. Therefore, the best we can do is watch levels of interest for lower timeframe confirming price action, and trade it accordingly.
Buy zones we have on our watch list are as follows:
- The round number 123.00.
- The mid-level number at 122.50.
Sell zones we have on our watch list are as follows:
- The round number 124.00.
- The 4hr supply area coming in at 124.72-124.46 (located just below the daily resistance area at 125.69-124.62). Something to note regarding this 4hr supply zone is the 4hr Quasimodo resistance base seen just above it. Keep a close eye on this area as fakeouts above supply (in this case) into obvious Quasimodo bases are very common.
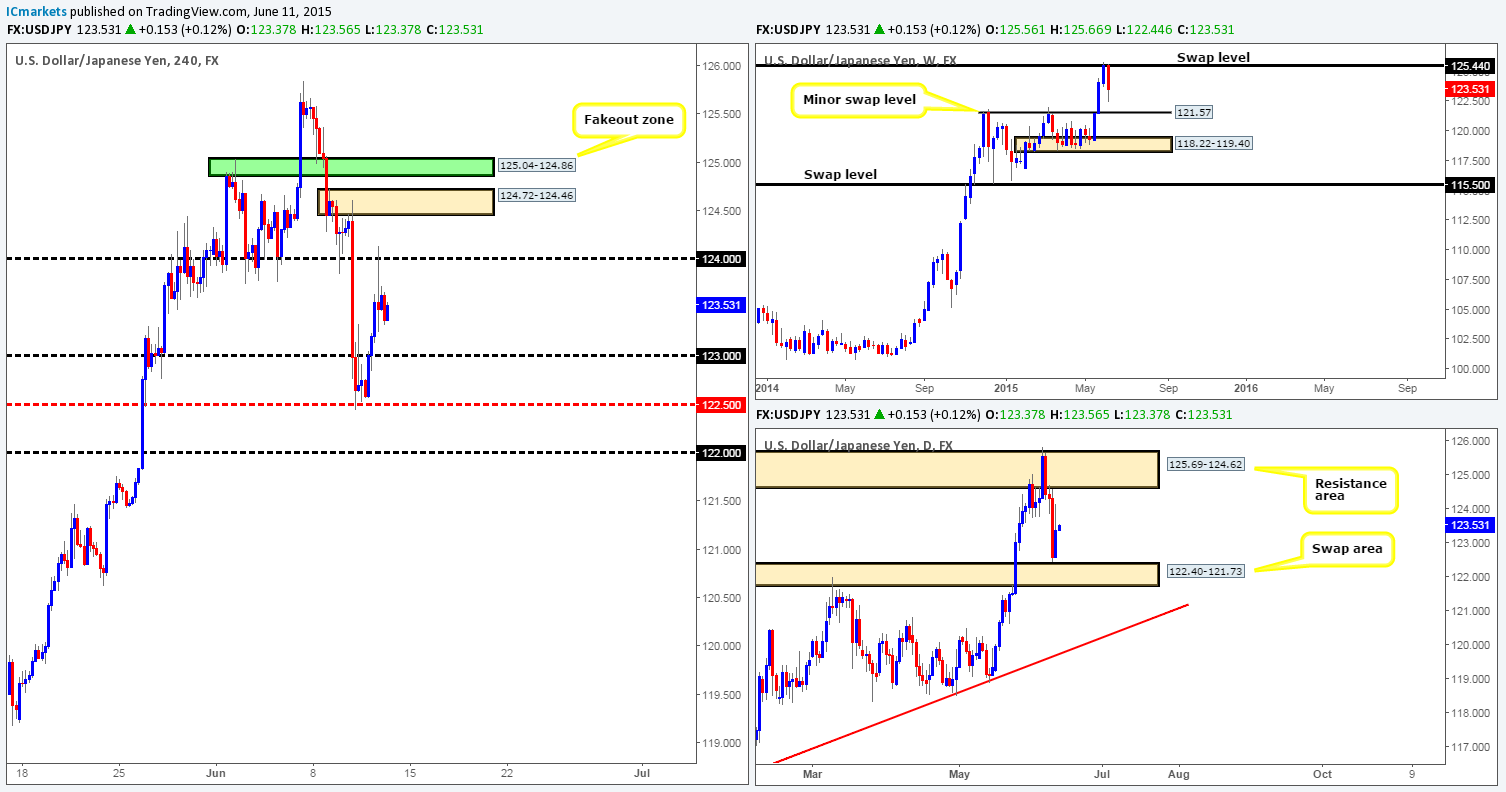
Levels to watch/ live orders:
- Buys: 123.00 [Tentative – confirmation required] (Stop loss: dependent on where one confirms this level) 122.50 [Tentative – confirmation required] (Stop loss: dependent on where one confirms this level).
- Sells: 124.00 [Tentative – confirmation required] (Stop loss: dependent on where one confirms this level) 124.72-124.46 [Tentative – confirmation required] (Stop loss: 125.08).
USD/CAD:
Weekly view – After a little tug-of-war around the weekly swap level 1.2439, the sellers, at this point in time, appear to be taking control. Overall though, our long-term bias on this pair is long, and it will only be once we see a break below the weekly swap area at 1.2034-1.1870 would our present bias likely shift.
Daily view: The daily timeframe shows that active buying was seen from the daily demand barrier at 1.2167-1.2255 during yesterday’s session, which just missed connecting with the daily swap level seen at 1.2366.
4hr view: From this angle, we can see that the 4hr Harmonic Bat reversal zone seen in green at 1.2246-1.2206 (located deep within the aforementioned daily demand area) has seen a relatively nice reaction, consequently breaking above the 4hr supply area at 1.2351-1.2324. Furthermore, the Fibonacci retracement 0.382 of A-D has also been hit, thus as per Scott Carney’s trade management rules, the stop should ideally be at breakeven now for anyone that managed to enter long. The next and most likely final target, should price continue to rally that is, will be around the 0.618 Fibonacci retracement of swing A-D if following Carney’s rules. However, you may want to keep 4hr structure in mind here and look at liquidating your position a little earlier than 0.618 at the 4hr swap area coming in at 1.2366-1.2394, which, if you look back to the daily chart, you’ll see it lines up perfectly with the daily swap level 1.2366.
At the time of writing, however, price recently broke below 1.2300. If the sellers remain strong below this hurdle today, it is likely we’re going to see a drive back into the aforementioned 4hr Harmonic Bat reversal zone. If this does occur, our team would, once again, watch for price action confirmation on the lower timeframes to enter long. Nevertheless, for anyone considering doing the same, be prepared for a fakeout below into 4hr demand seen at 1.2171-1.2191 (positioned deep within the aforementioned daily demand area).
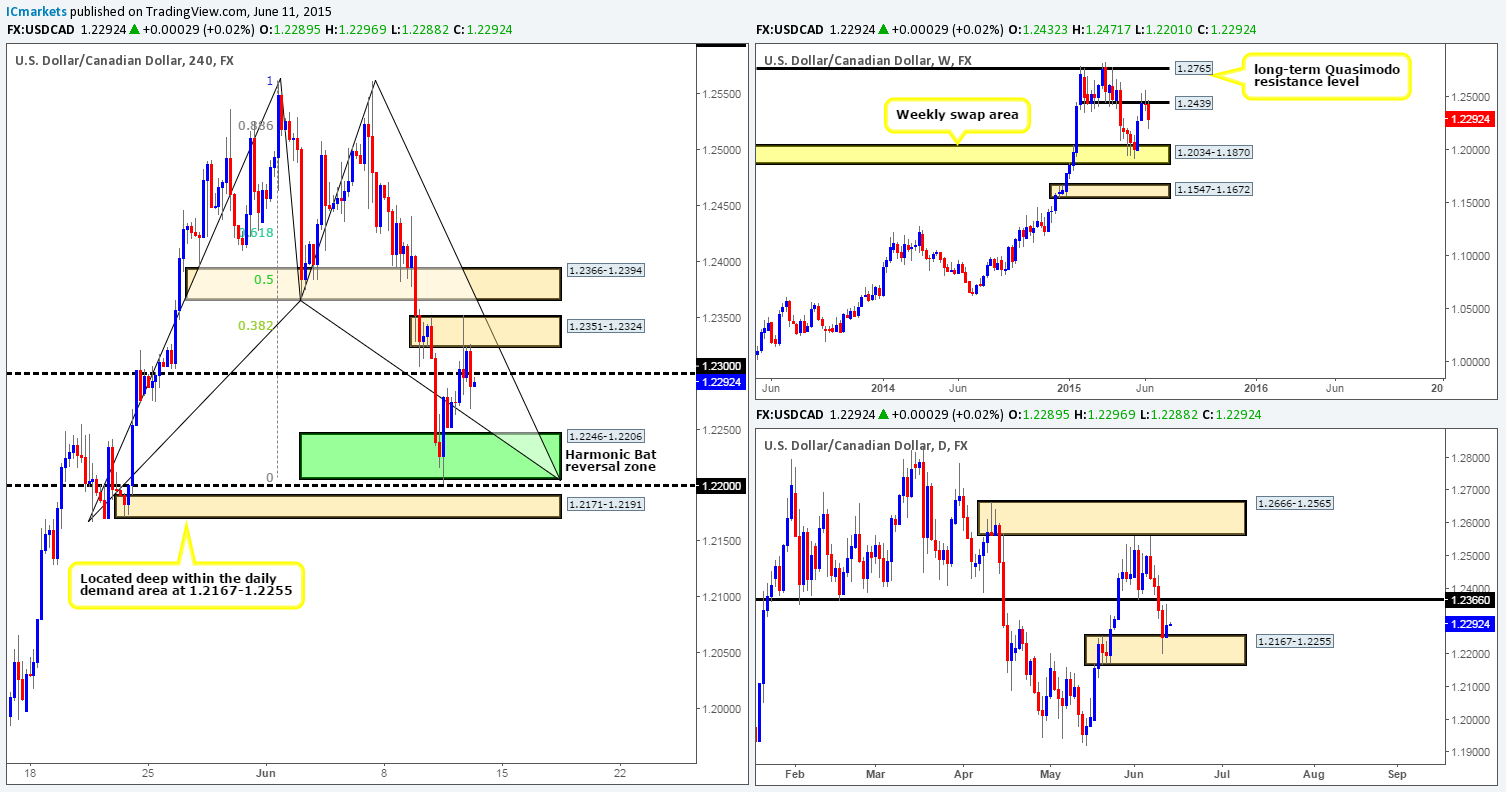
Levels to watch/ live orders:
- Buys: 1.2246-1.2206 [Tentative – confirmation required] (Stop loss: dependent on where one confirms this area).
- Sells: Flat (Stop loss: N/A).
USD/CHF:
Weekly view – The weekly timeframe shows that price is still holding nicely below the weekly swap level 0.9512. Should buy-side liquidity remain weak here, it is likely price will connect with the weekly swap area seen below at 0.9074-0.9000.
Daily view: (Slightly revised) From this angle, we can to see that price has recently been respecting the daily trendline level taken from the low 0.8299. A break below this limit, however, would likely attract further selling down towards the daily demand area seen at 0.9077-0.9147 (located just above the aforementioned weekly swap area).
4hr view: The latest coming in from this timeframe reveals that price rebounded just beautifully from a 4hr Quasimodo base at 0.9422-0.9399. Overall, we believe that the market will continue to sell off from here down towards the 4hr demand area coming in at 0.9164-0.9217 (positioned just above the aforementioned daily demand). The reason for why simply comes from seeing a spike below the 4hr demand area at 0.9244-0.9271, which, as you can imagine, likely consumed the majority of buyers within this zone.
This sounds all very well and good, but where could one enter to take advantage of this potential downmove? Well, if price retraces back up to the aforementioned 4hr Quasimodo area, we’d confidently take a short (pending sell order set at 0.9395) from this zone. Failing that, should price continue south and engulf 0.9300, we’d then look for price to retest this number as resistance and sell with lower timeframe confirmation down to the target – 4hr demand at 0.9164-0.9217. It will be interesting to see how this plays out.
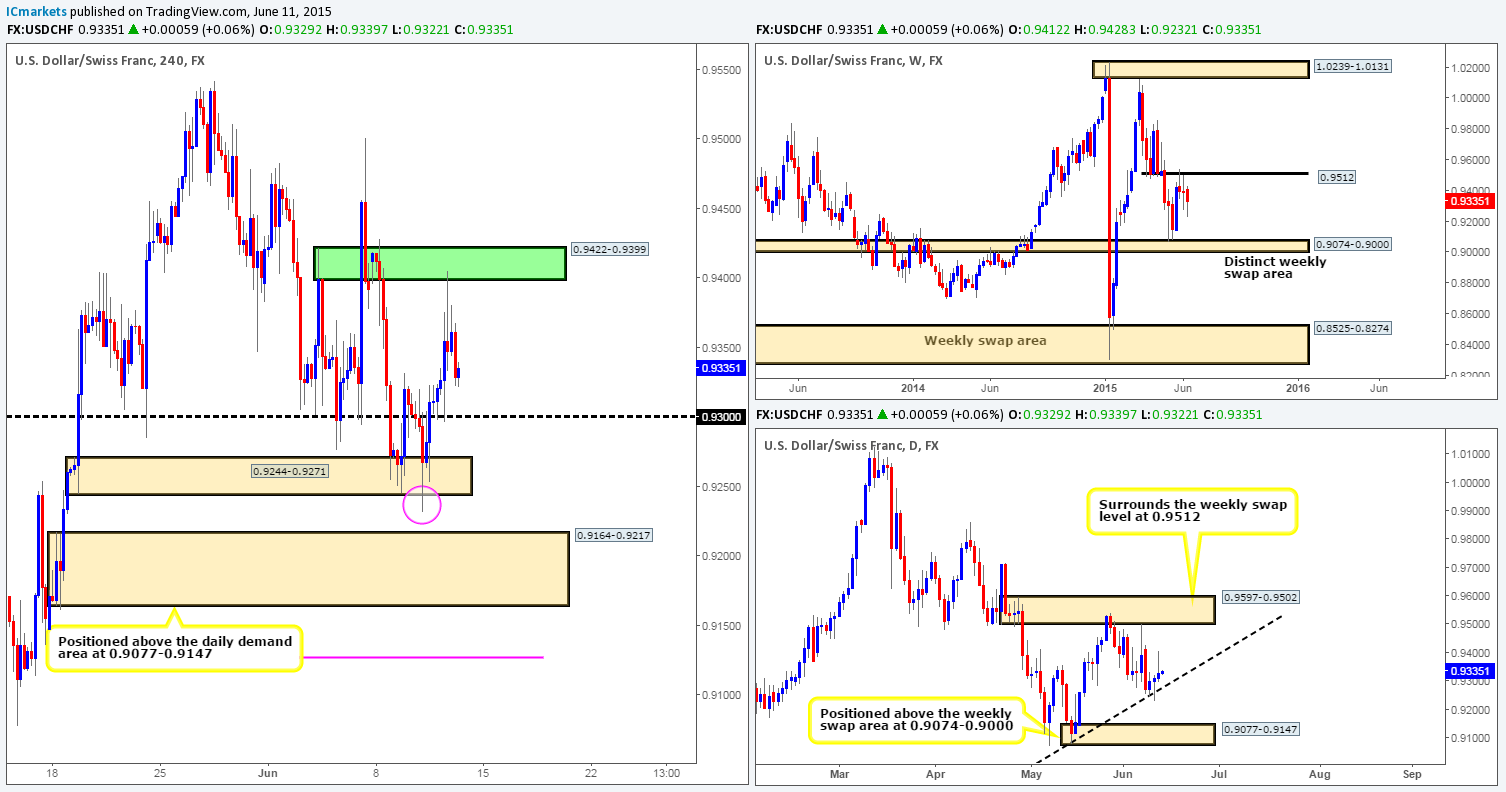
Levels to watch/ live orders:
- Buys: Flat (Stop loss: N/A).
- Sells: 0.9395 (Stop loss: 0.9505).
US 30:
Weekly view – Following the sell off from 18279, buying interest has begun to come into the market from 17703. Despite the recent movements, however, the overall uptrend on this index is still very strong, and will remain this way until we see a convincing push below 16051.
Daily view: The daily timeframe shows that the buyers and sellers are currently pulling for position within the jaws of a daily supply area coming in at 18168-18010.
4hr view: During the course of yesterday’s sessions on the 4hr timeframe, price broke above 18025 (there was also an opportunity to enter long on the retest of 18025 on the 5 minute timeframe which we missed) and clashed with a 4hr Quasimodo base seen at 18116-18088 (located relatively deep within the aforementioned daily supply area), which, as you can see, forced the market back down to the 18025 level.
Given that price is currently loitering within daily supply (see above) at the moment, it is very possible we could see this market decline further going into today’s sessions. With that being said, if price manages to get below the 17991 mark, we may (as long as price retests 17991 as resistance and shows some sort of lower timeframe confirmation signal) have an intraday shorting opportunity, targeting the 4hr swap level at 17920 (as per the blue arrows). Should all of the above happen today, and a sell signal is spotted on the lower timeframes, constant monitoring of your position is recommended, since let’s not forget the monumental uptrend this index is presently in (see above – weekly).
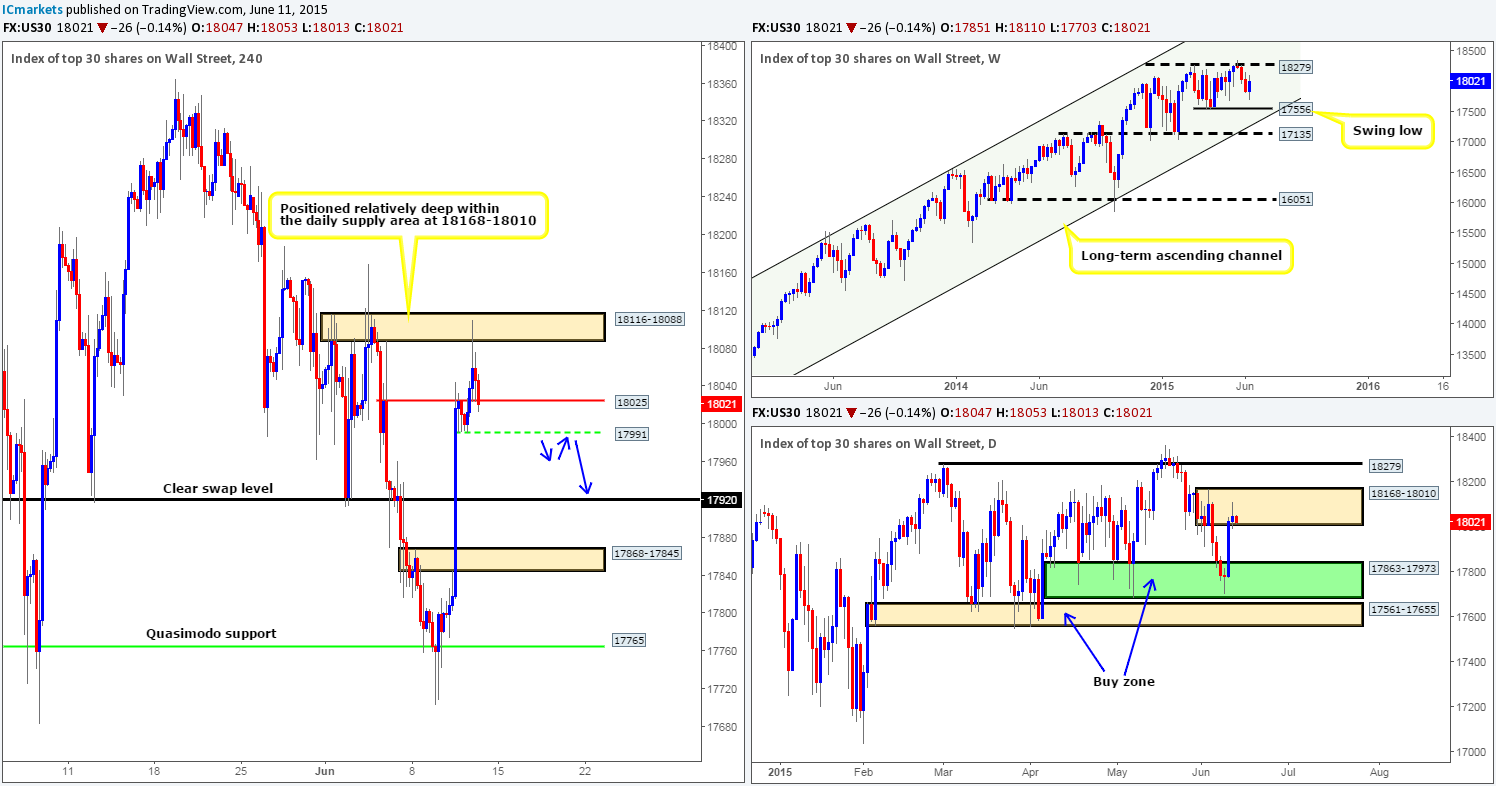
Levels to watch/ live orders:
- Buys: Flat (Stop loss: N/A).
- Sells: Flat (Stop loss: N/A).
XAU/USD (Gold)
Weekly view – The weekly timeframe shows there is strong buying currently being seen from the upper limits of a weekly demand area sitting at 1142.5-1167.3. From a long-term perspective, however, gold is still trending south in our opinion. For this bias to be invalidated, a push above the weekly trendline extended from the high 1488.0 would need to be seen.
Daily view: The buyers and sellers are currently seen battling for position on the daily timeframe between a daily buy zone at 1170.3-1184.0, and a small daily supply area at 1196.2-1188.9.
4hr view: Going into the European session we saw gold sell off yesterday, which as you can see, continued going into the London session. It was only once price entered into the jaws of a 4hr demand area at 1175.1-1177.5 did the market begin to reverse.
At current price, 1182.4, we do not see any immediate trading opportunities, and as long as price on the daily timeframe remains tightly confined between a daily buy zone and a small daily supply area (see above), this market will not likely see any big moves going into to today’s sessions. That being the case, we’re going to keep a close eye on the following areas for small intraday bounces on the lower timeframes:
For shorts, we’re watching the following:
- 4hr supply at 1188.1-1185.7.
- 4hr supply at 1196.2-1192.6 (located deep within the small daily supply area at 1196.2-1188.9).
For longs, we’re watching the following:
- 4hr demand at 1175.1-1177.5.
- 4hr demand at 1169.4-1172.1 (positioned deep within the daily buy zone at 1170.3-1184.0).
All of these areas will require confirming price action on the lower timeframes, and do remember, we’re not looking for home runs from the above zones – we’re simply looking for small bounces to end the week.

Levels to watch/ live orders:
- Buys: 1175.1-1177.5 [Tentative – confirmation required] (Stop loss: 1174.5) 1169.4-1172.1 [Tentative – confirmation required] (Stop loss: 1168.9).
- Sells: 1188.1-1185.7 [Tentative – confirmation required] (Stop loss: 1188.4) 1196.2-1192.6 [Tentative – confirmation required] (Stop loss: 1196.4).