
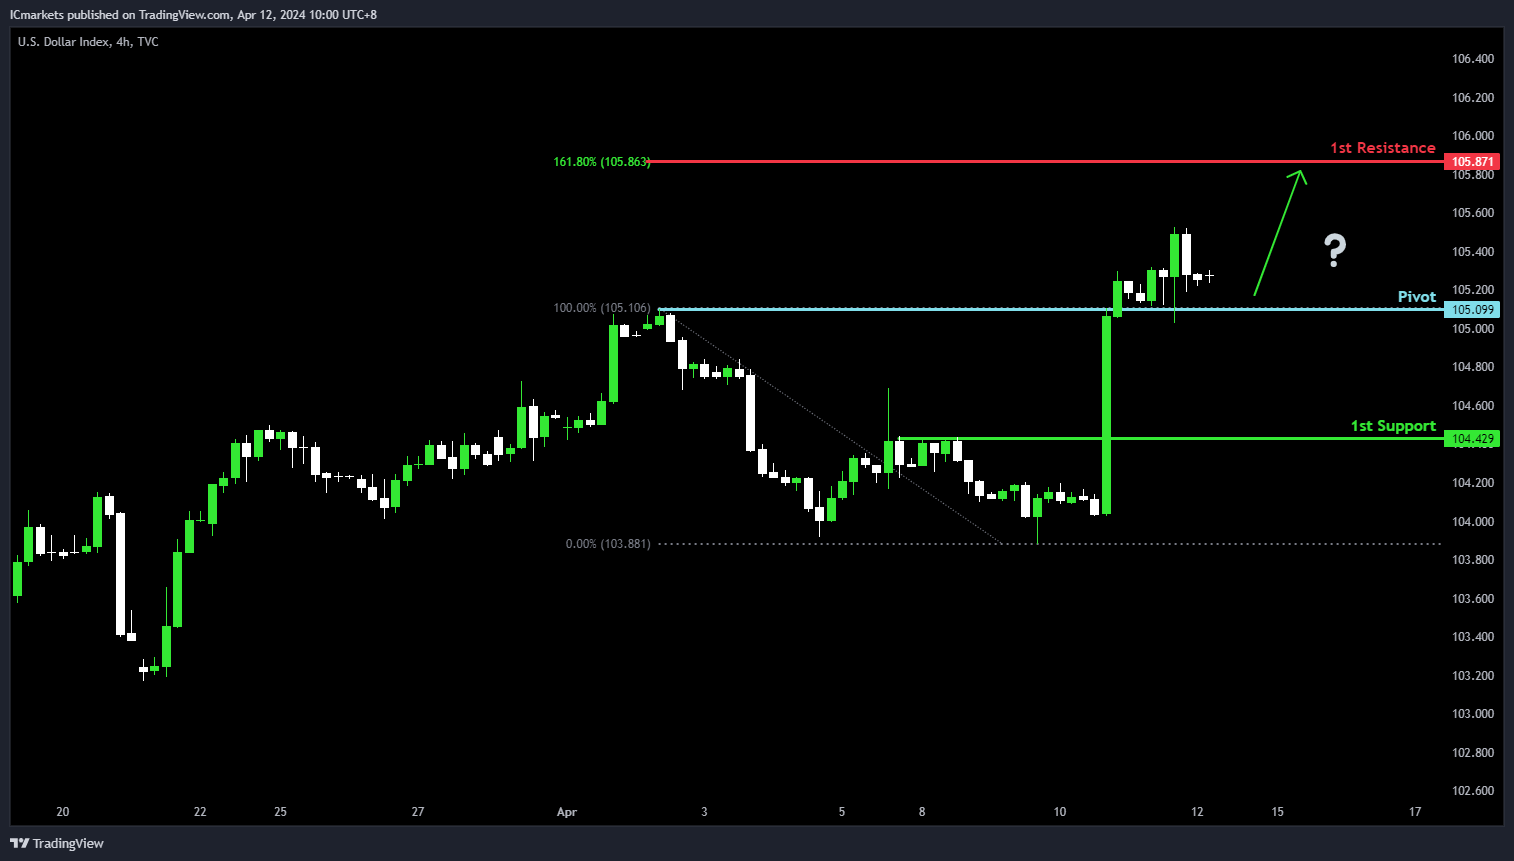
DXY (US Dollar Index):
Potential Direction: Bullish
Overall momentum of the chart: Bullish
Price could potentially make a: Bullish bounce off pivot and head towards 1st resistance
Pivot: 105.09
Supporting reasons: Acts as an Overlap resistance, indicating a key level where buying interest might intensify, suggesting a solid foundation for a potential upward movement within the context of the overall bullish trend.
1st support: 104.42
Supporting reasons: Known as Pullback support, suggesting a significant area where the market has previously found strong buying interest, providing a foundation for potential price stabilization or a minor rebound, reinforcing the bullish momentum.
1st resistance: 105.87
Supporting reasons: Marked by a 161.80% Fibonacci Extension, indicating a significant barrier that could cap upward movements.
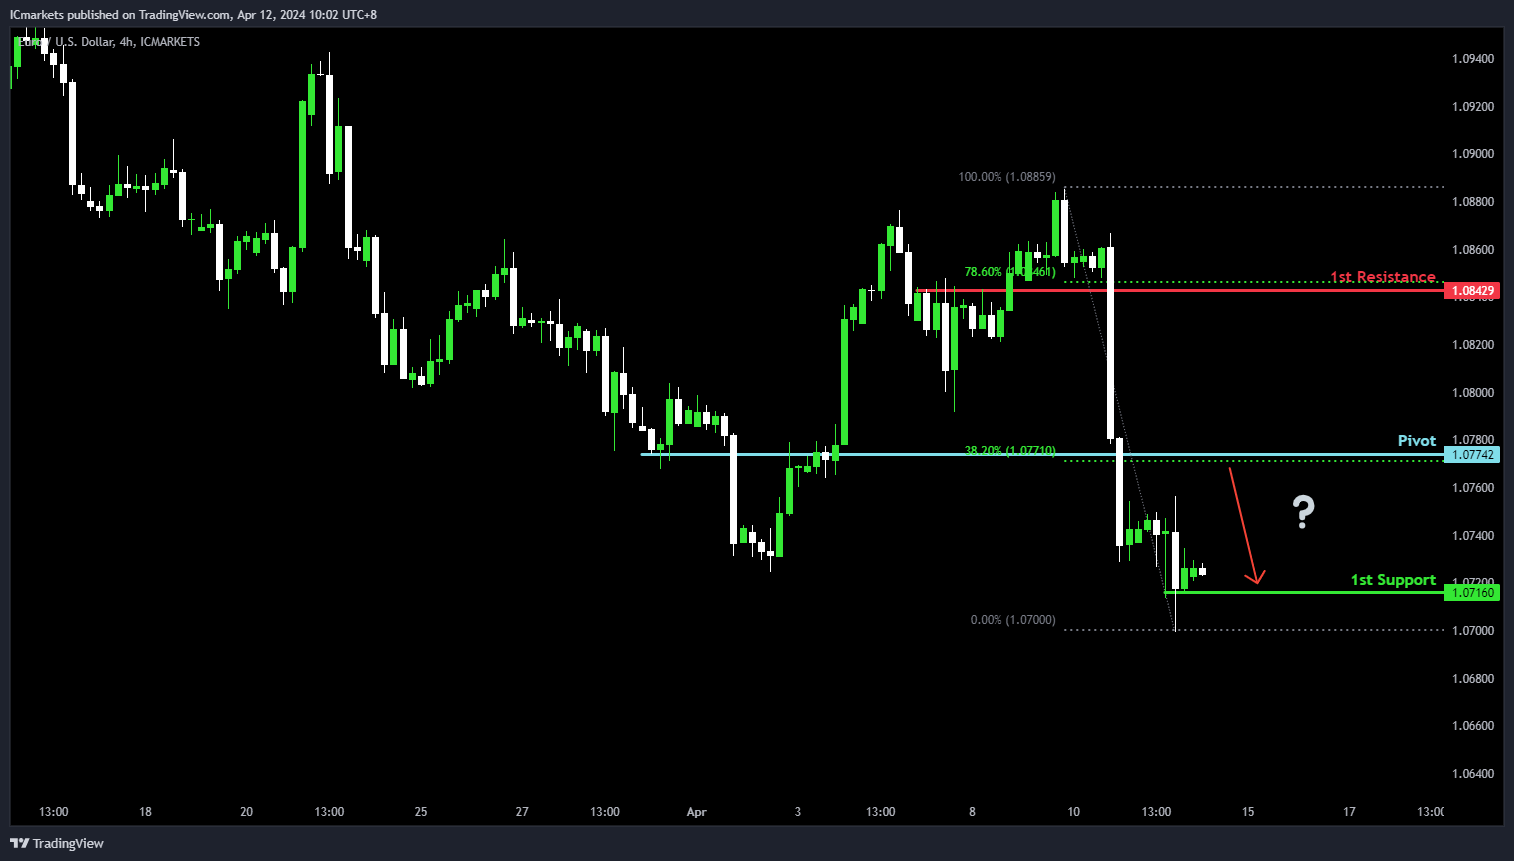
EUR/USD:
Potential Direction: Bearish
Overall momentum of the chart: Bearish
Price could potentially make a: Bearish reaction off pivot and drop to 1st support
Pivot: 1.0774
Supporting reasons: Acts as Pullback resistance with a 38.20% Fibonacci Retracement, indicating a key level where selling pressure might intensify, suggesting a potential turning point for the price to reverse and move downwards within the context of the overall bearish trend.
1st support: 1.0716
Supporting reasons: Known as Swing low support, suggesting a significant area where the market has previously found strong buying interest, providing a foundation for potential price stabilization or a minor rebound within the bearish movement.
1st resistance: 1.0842
Supporting reasons: Identified as Pullback resistance with a 78.60% Fibonacci Retracement, marking a significant barrier that has capped previous upward movements.
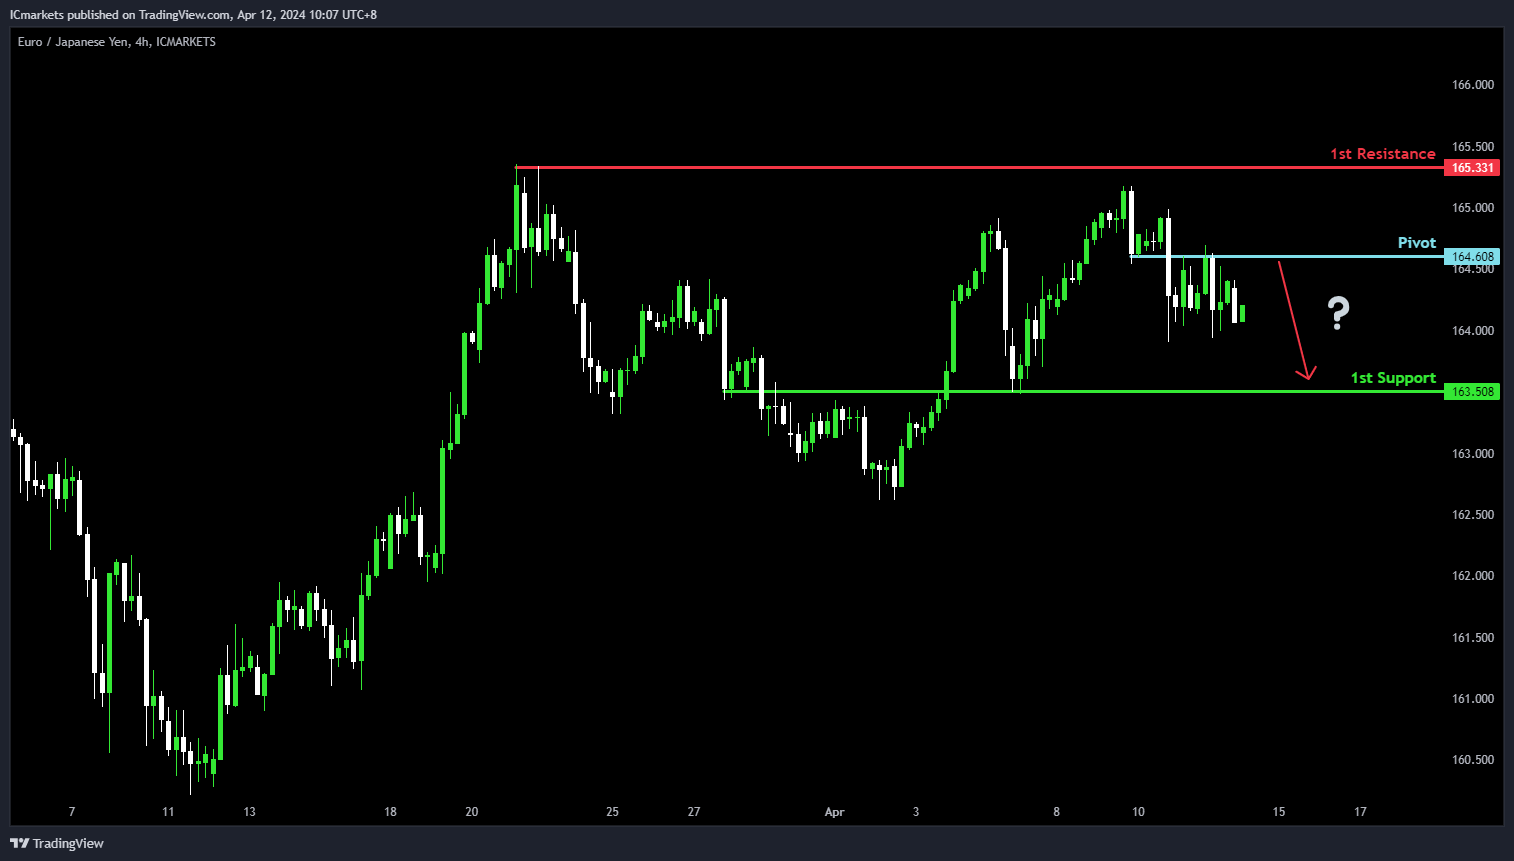
EUR/JPY:
Potential Direction: Bearish
Overall momentum of the chart: Bearish
Price could potentially make a: Bearish continuation towards 1st support
Pivot: 164.60
Supporting reasons: Acts as an Overlap resistance, indicating a key level where selling pressure might intensify, suggesting a potential turning point for the price to reverse and move downwards within the context of the overall bearish trend.
1st support: 163.50
Supporting reasons: Known as an Overlap support, suggesting a significant area where the market has previously found strong buying interest, providing a foundation for potential price stabilization or a minor rebound within the bearish movement.
1st resistance: 165.33
Supporting reasons: Identified as Swing high resistance, marking a significant barrier that has capped previous upward movements.
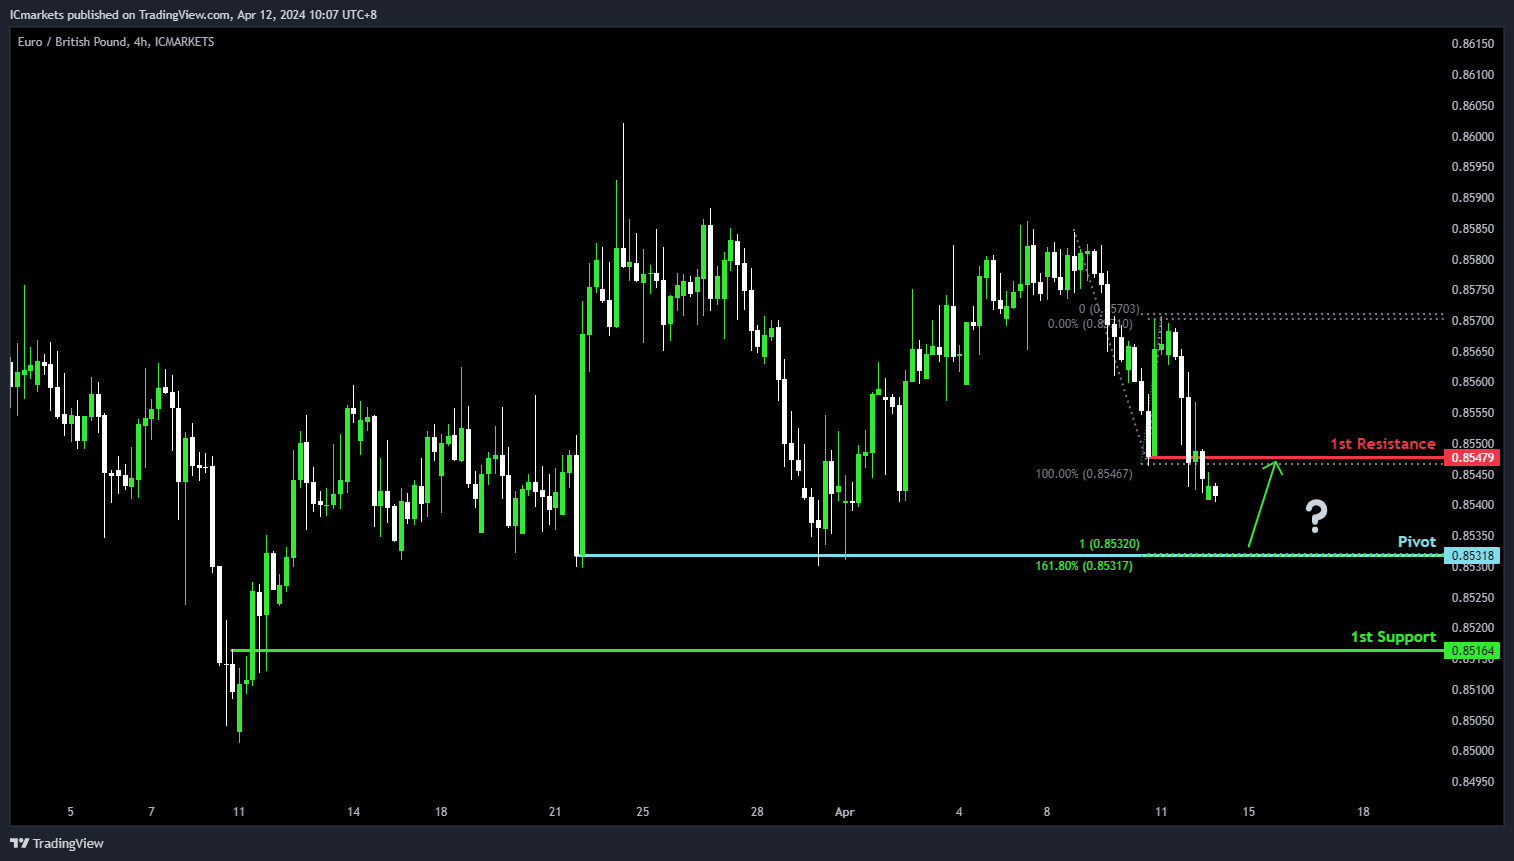
EUR/GBP:
Potential Direction: Bullish
Overall momentum of the chart: Bearish
Price could potentially make a: Bullish bounce off pivot and head towards 1st resistance
Pivot: 0.8531
Supporting reasons: Acts as Multi-swing low support, indicating a key level where buying interest has historically been strong. This suggests a solid foundation for a potential upward movement within the context of a counter-trend bounce.
1st support: 0.8515
Supporting reasons: Known as Pullback support, suggesting a significant area where the market has previously found strong buying interest, reinforcing the potential for price stabilization or a minor rebound if the pivot holds.
1st resistance: 0.8547
Supporting reasons: Identified as Pullback resistance, marking a significant barrier that has capped previous upward movements.
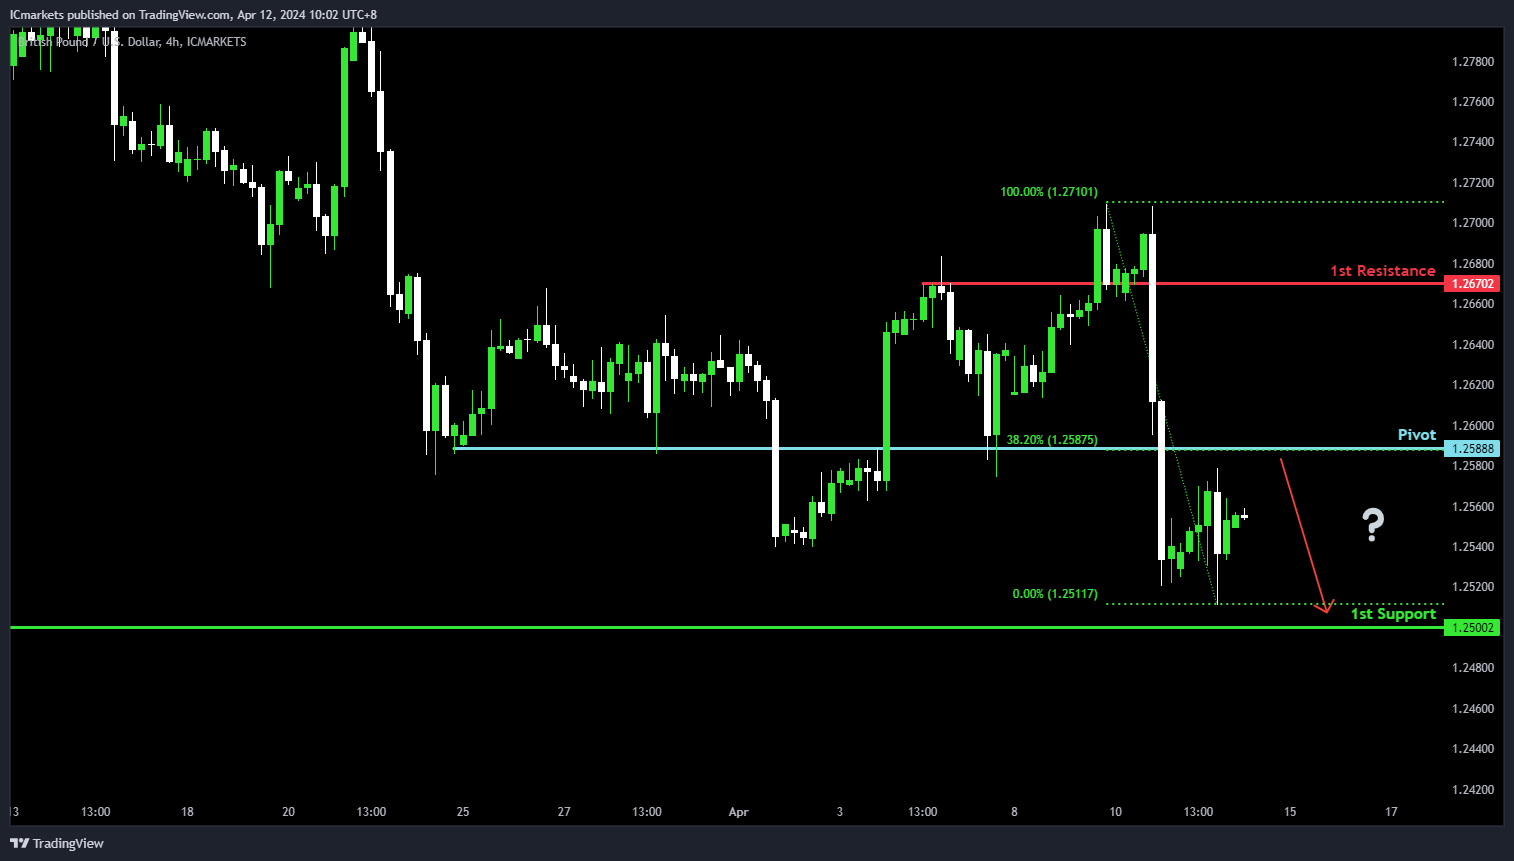
GBP/USD:
Potential Direction: Bearish
Overall momentum of the chart: Bearish
Price could potentially make a: Bearish reaction off pivot and drop to 1st support
Pivot: 1.2588
Supporting reasons: Acts as Pullback resistance with a 38.20% Fibonacci Retracement, indicating a key level where selling pressure might intensify, suggesting a potential turning point for the price to reverse and move downwards within the context of the overall bearish trend.
1st support: 1.2500
Supporting reasons: Known as an Overlap support, suggesting a significant area where the market has previously found strong buying interest, providing a foundation for potential price stabilization or a minor rebound, reinforcing the bearish outlook.
1st resistance: 1.2670
Supporting reasons: Identified as Pullback resistance, marking a significant barrier that has capped previous upward movements.
.
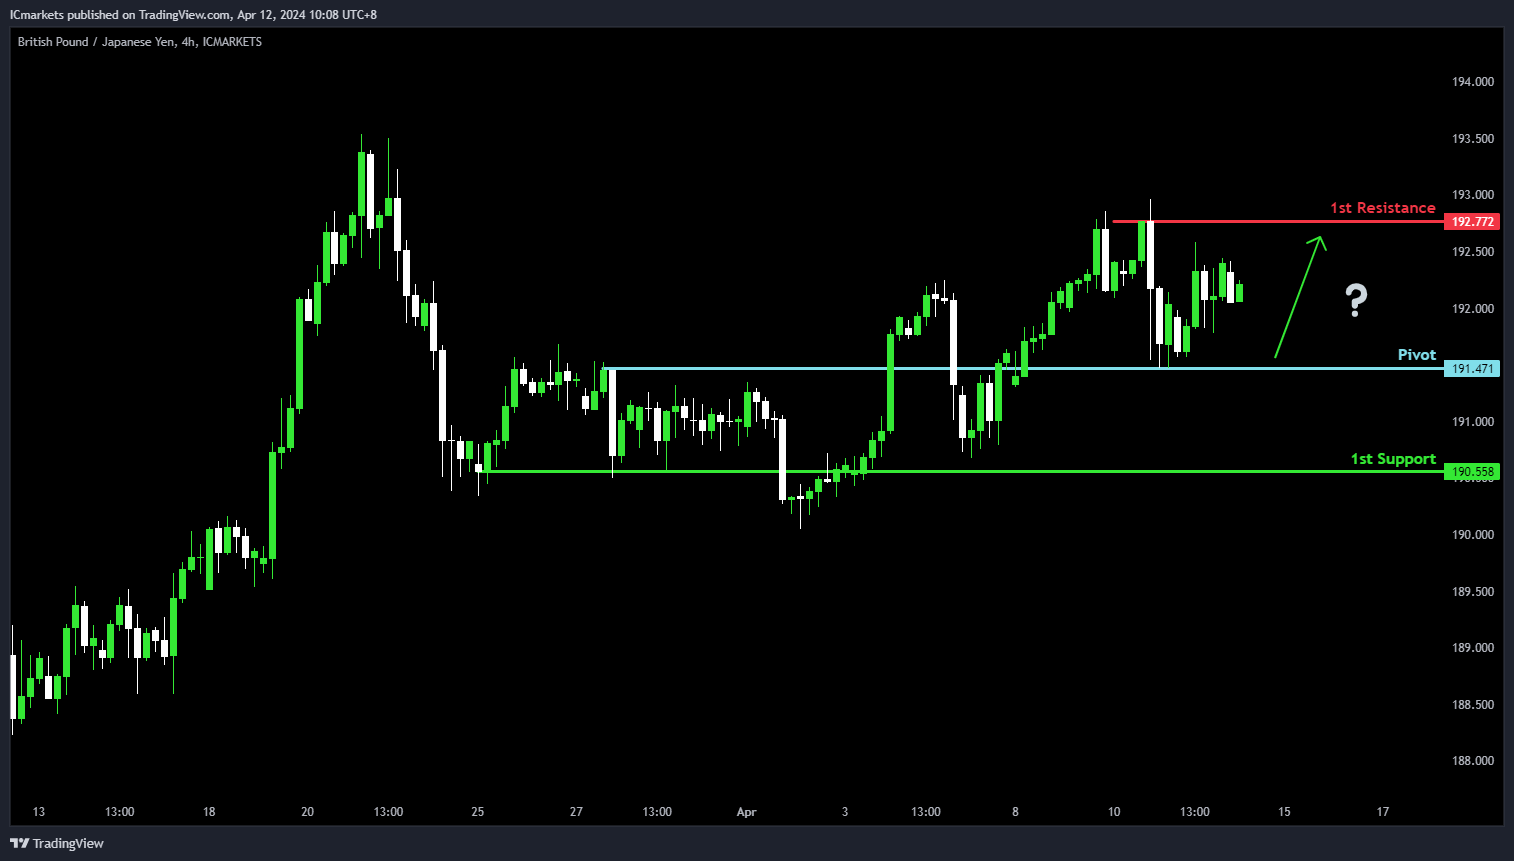
GBP/JPY:
Potential Direction: Bullish
Overall momentum of the chart: Bullish
Price could potentially make a: Bullish bounce off pivot and heads towards 1st resistance
Pivot: 191.47
Supporting reasons: An Overlap support, indicating a significant area where the market has previously found support and resistance, suggesting potential price stability or reversal.
1st support: 190.55
Supporting reasons: Pullback support, marking a level where buyers might step in to defend the uptrend, providing additional support for the bullish bias.
1st resistance: 192.77
Supporting reasons: Swing high resistance, representing a level where the price has previously encountered selling pressure, potentially acting as a barrier to further upside movement.
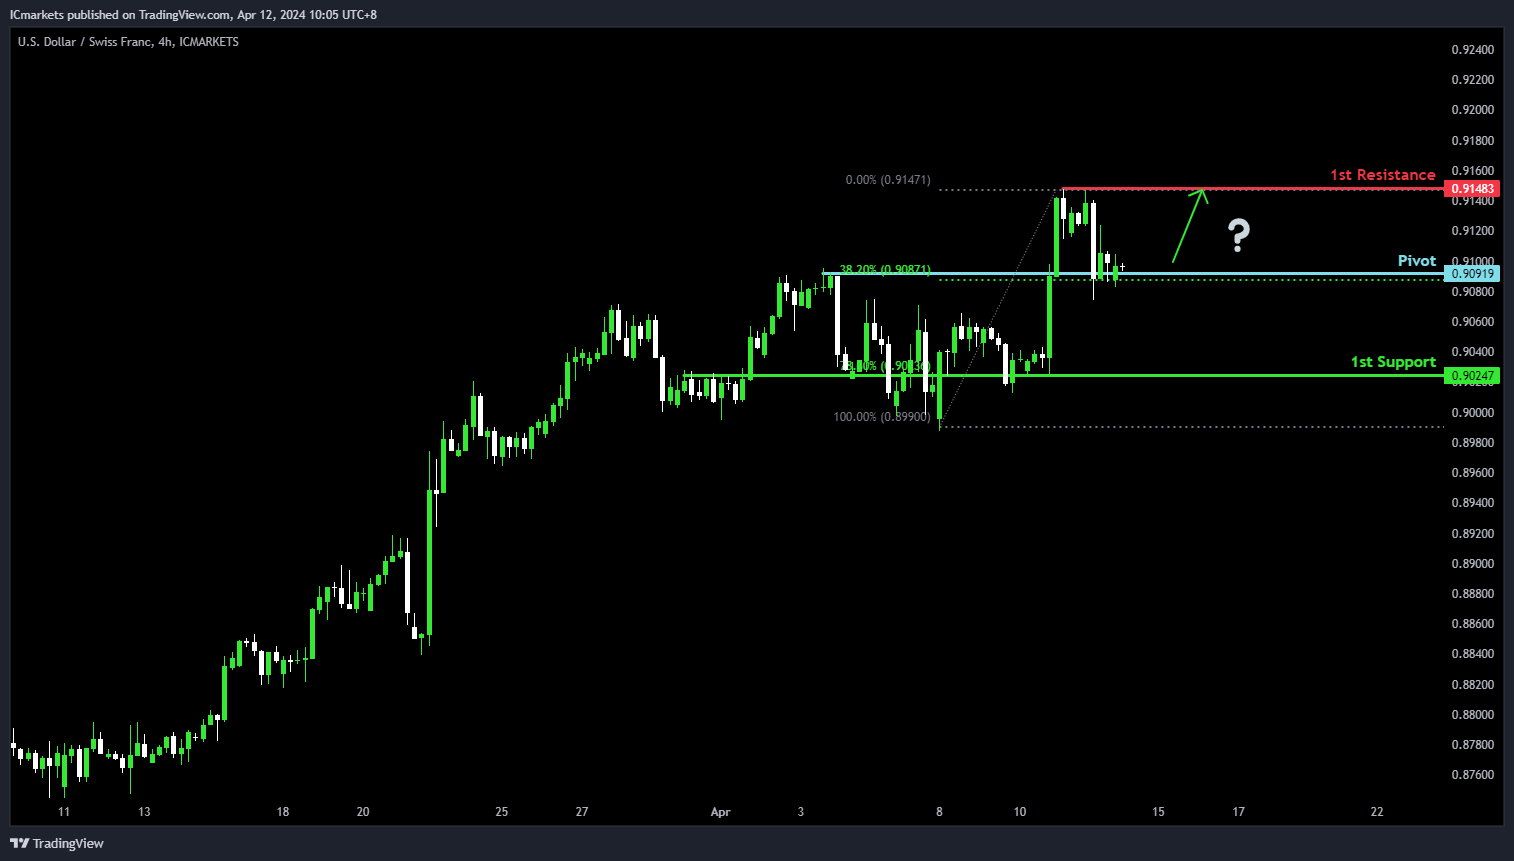
USD/CHF:
Potential Direction: Bullish
Overall momentum of the chart: Bullish
Price could potentially make a: Bullish bounce off pivot and heads towards 1st resistance
Pivot: 0.9091
Supporting reasons: Pullback support with a 38.20% Fibonacci Retracement, indicating a key level where buyers might step in to support the uptrend, suggesting a potential reversal point for the price.
1st support: 0.9024
Supporting reasons: An Overlap support with a 78.60% Fibonacci Retracement, suggesting a significant area where the market has previously found support and resistance, reinforcing the bullish bias.
1st resistance: 0.9148
Supporting reasons: Swing high resistance, representing a level where the price has previously encountered selling pressure, potentially acting as a barrier to further upside movement.
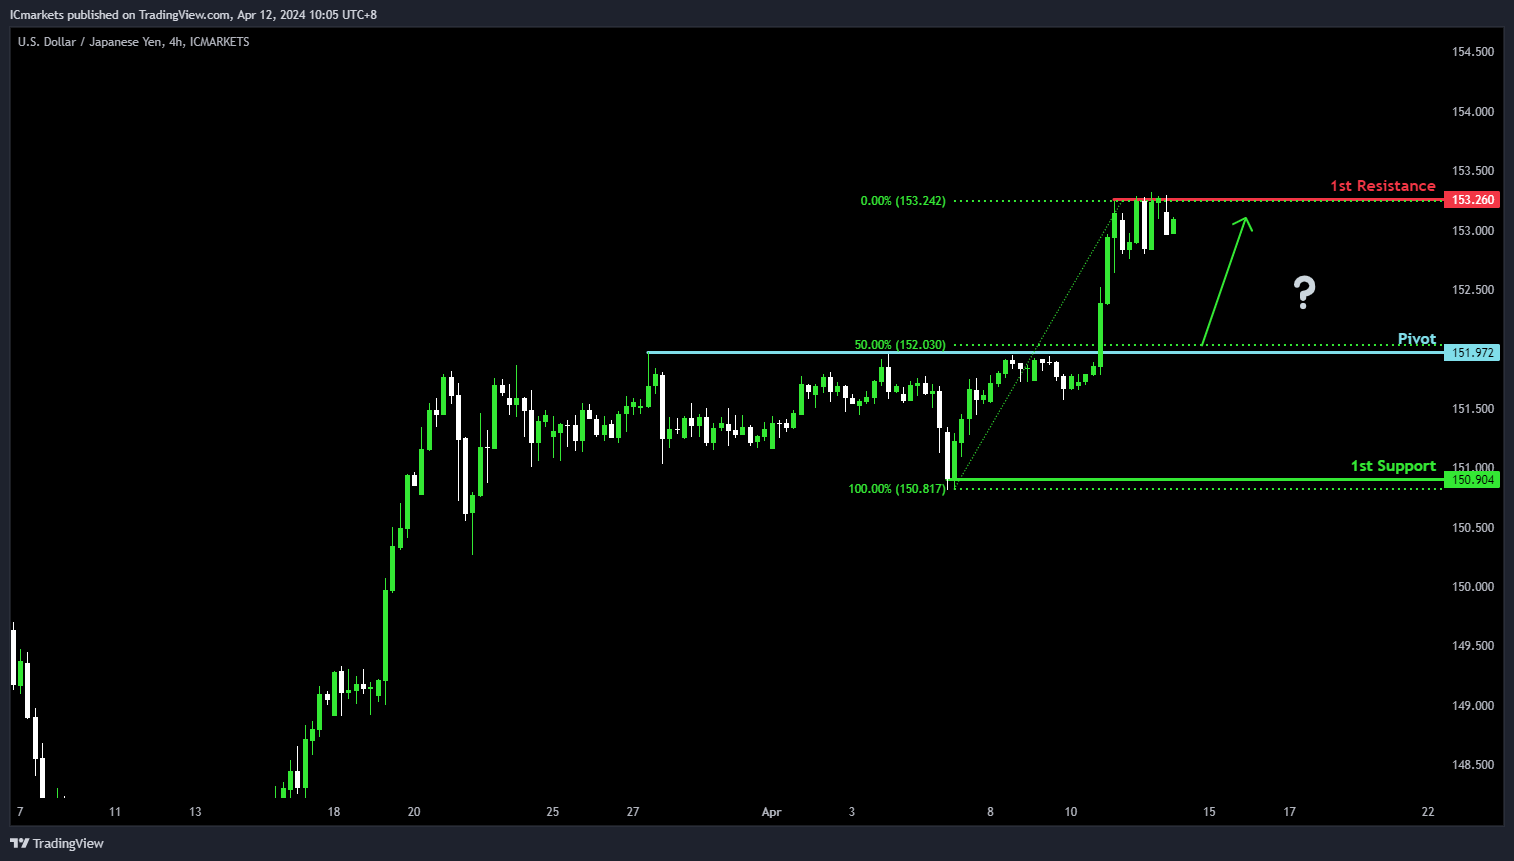
USD/JPY:
Potential Direction: Bullish
Overall momentum of the chart: Bullish
Price could potentially make a: Bullish bounce off pivot and heads towards 1st resistance
Pivot: 151.97
Supporting reasons: Pullback support with a 50% Fibonacci Retracement, indicating a significant level where buyers might enter the market, potentially reversing the price higher.
1st support: 150.90
Supporting reasons: Swing low support, representing a level where the price has previously found support and reversed higher, reinforcing the bullish bias.
1st resistance: 153.26
Supporting reasons: Multi-swing high resistance, suggesting a level where the price has faced selling pressure from multiple highs, potentially acting as a barrier to further upside movement
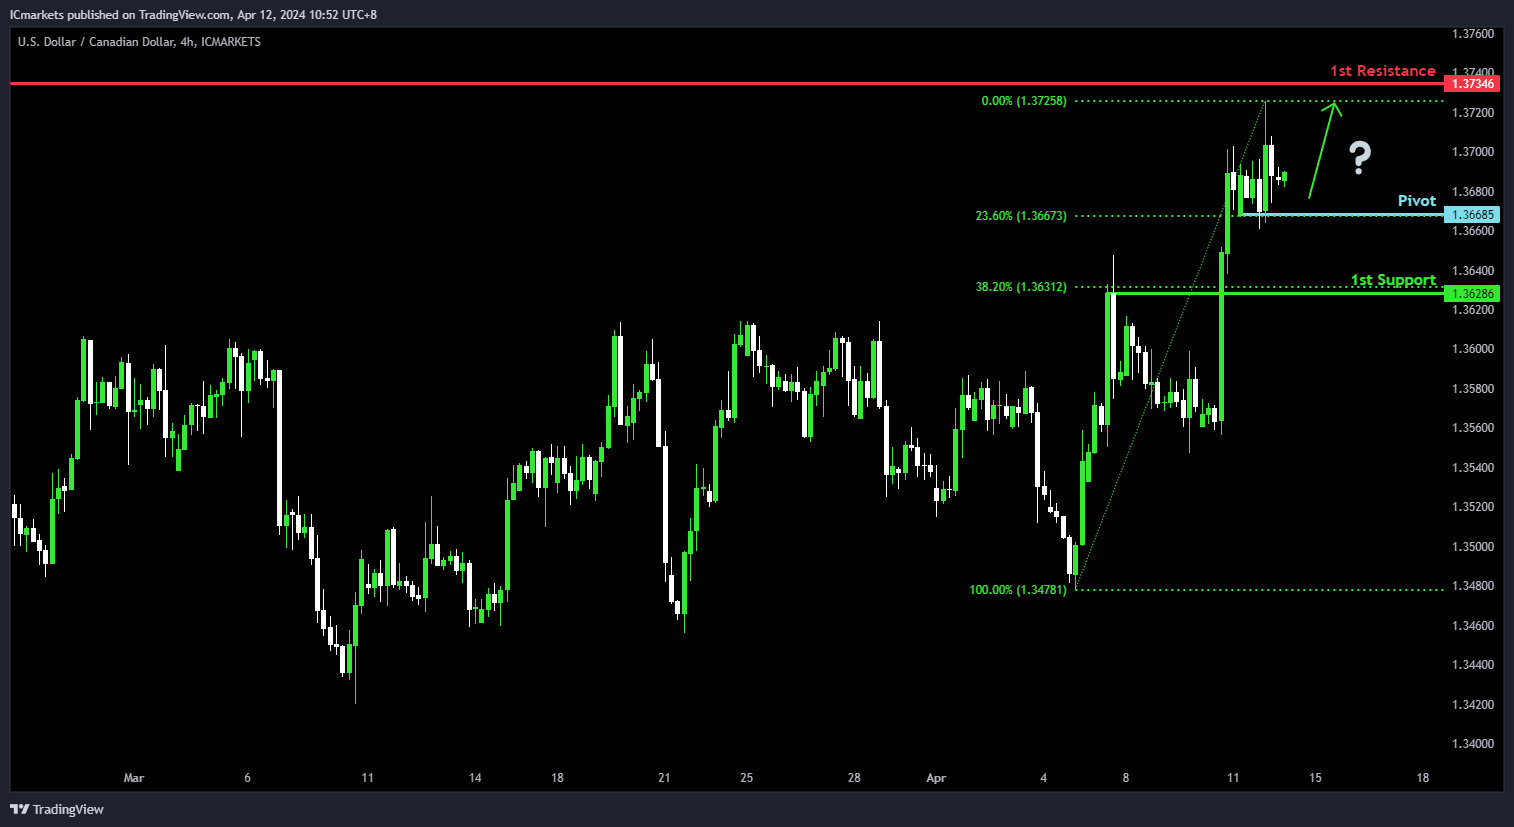
USD/CAD:
Potential Direction: Bullish
Overall momentum of the chart: Bullish
Price has made a bullish reaction off the pivot and could potentially rise towards the 1st resistance
Pivot: 1.3668
Supporting reasons: Acts as a pullback support that aligns with a 23.6% Fibonacci retracement level where price has found strong buying interest recently.
1st support: 1.3628
Supporting reasons: Identified as a pullback support that aligns with a 38.2% Fibonacci retracement level, suggesting a significant area where the market has previously found strong buying interest and could provide a foundation for potential price stabilization.
1st resistance: 1.3734
Supporting reasons: Identified as a pullback resistance, marking a significant barrier that could cap further upward movements.
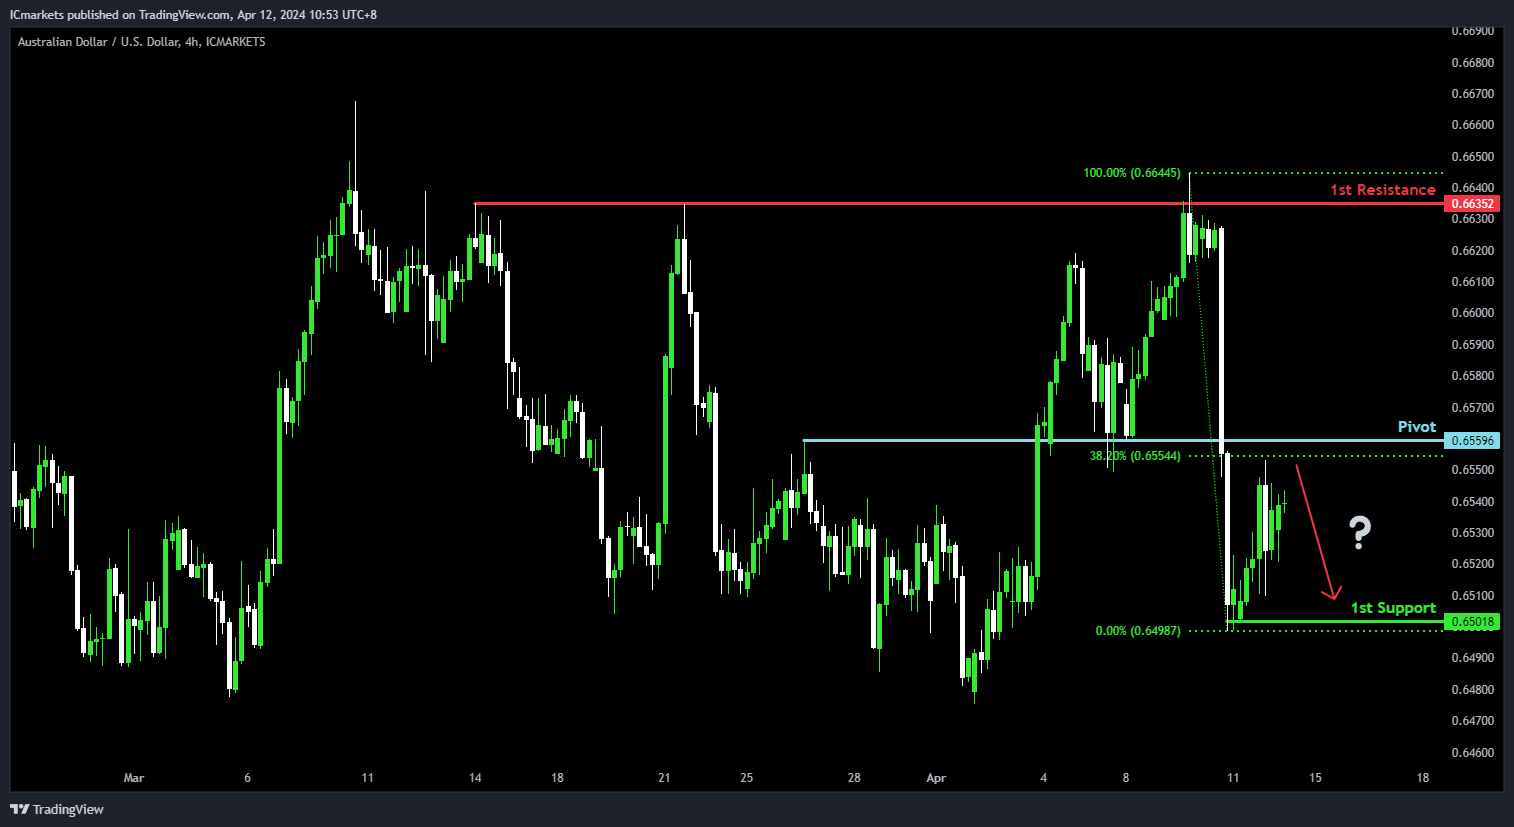
AUD/USD:
Potential Direction: Bullish
Overall momentum of the chart: Bearish
Price could rise towards the pivot and potentially make a bearish reaction off this level to drop lower toward the 1st support
Pivot: 0.6559
Supporting reasons: Acts as an overlap resistance that aligns close to a 38.2% Fibonacci retracement level, suggesting a potential area where selling pressures have increased recently.
1st support: 0.6501
Supporting reasons: Acts as a pullback support, suggesting a significant area where price has previously found strong support and could provide a basis to halt further downward movement.
1st resistance: 0.6635
Supporting reasons: Identified as a multi-swing-high, marking a significant barrier that has previously capped upward movements.
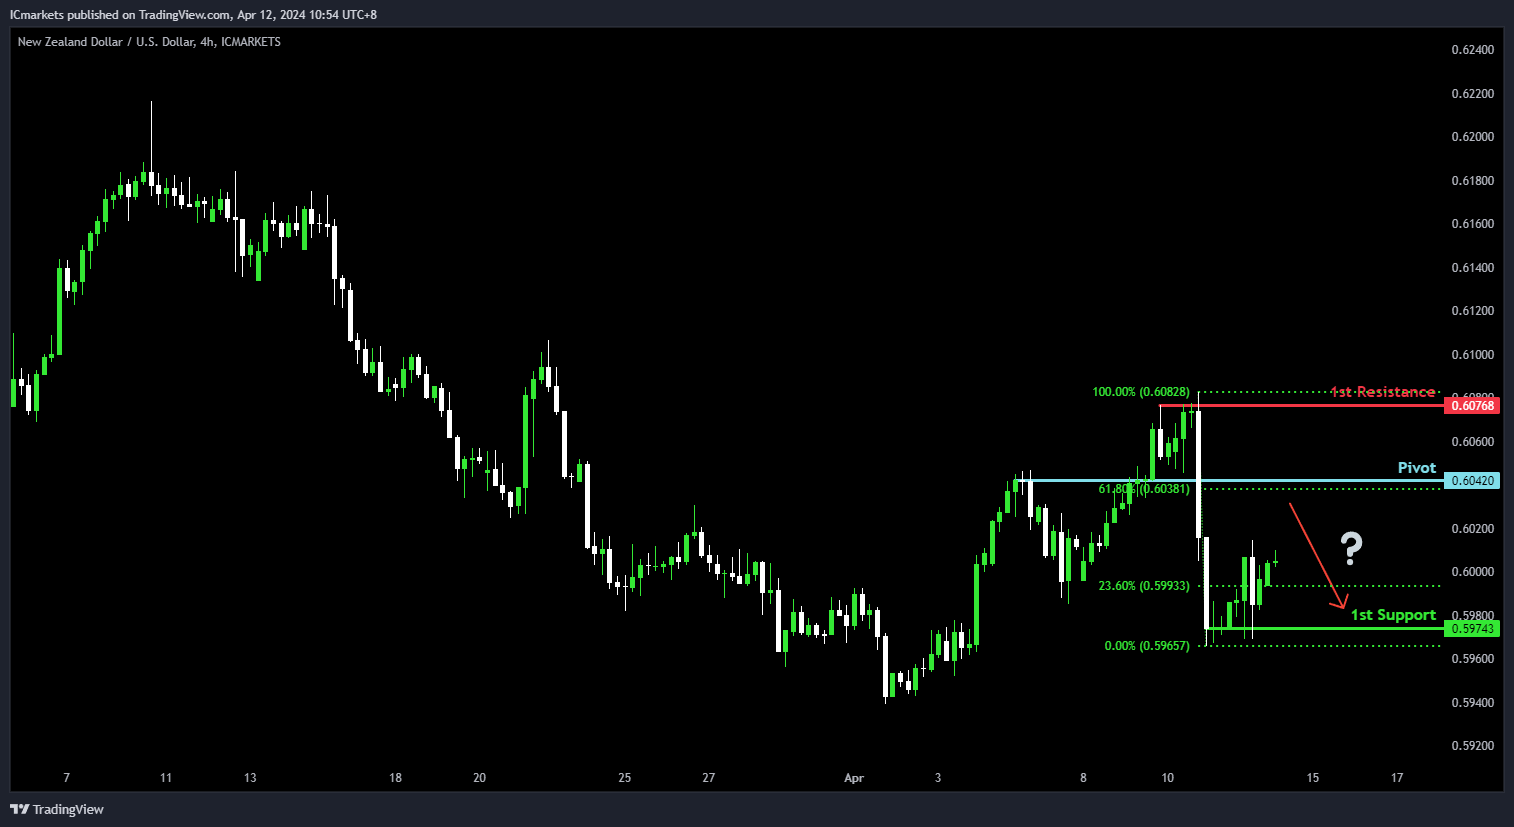
NZD/USD
Potential Direction: Bullish
Overall momentum of the chart: Bearish
Price could rise towards the pivot and potentially make a bearish reaction off this level to drop lower toward the 1st support
Pivot: 0.6042
Supporting reasons: Acts as an overlap resistance that aligns with a 61.8% Fibonacci retracement, indicating a potential reversal point.
1st support: 0.5974
Supporting reasons: Acts as a pullback support, suggesting a potential area for price stabilization or a minor rebound within the bearish context.
1st resistance: 0.6076
Supporting reasons: Identified as a pullback, marking a significant barrier that could cap further upward movements.
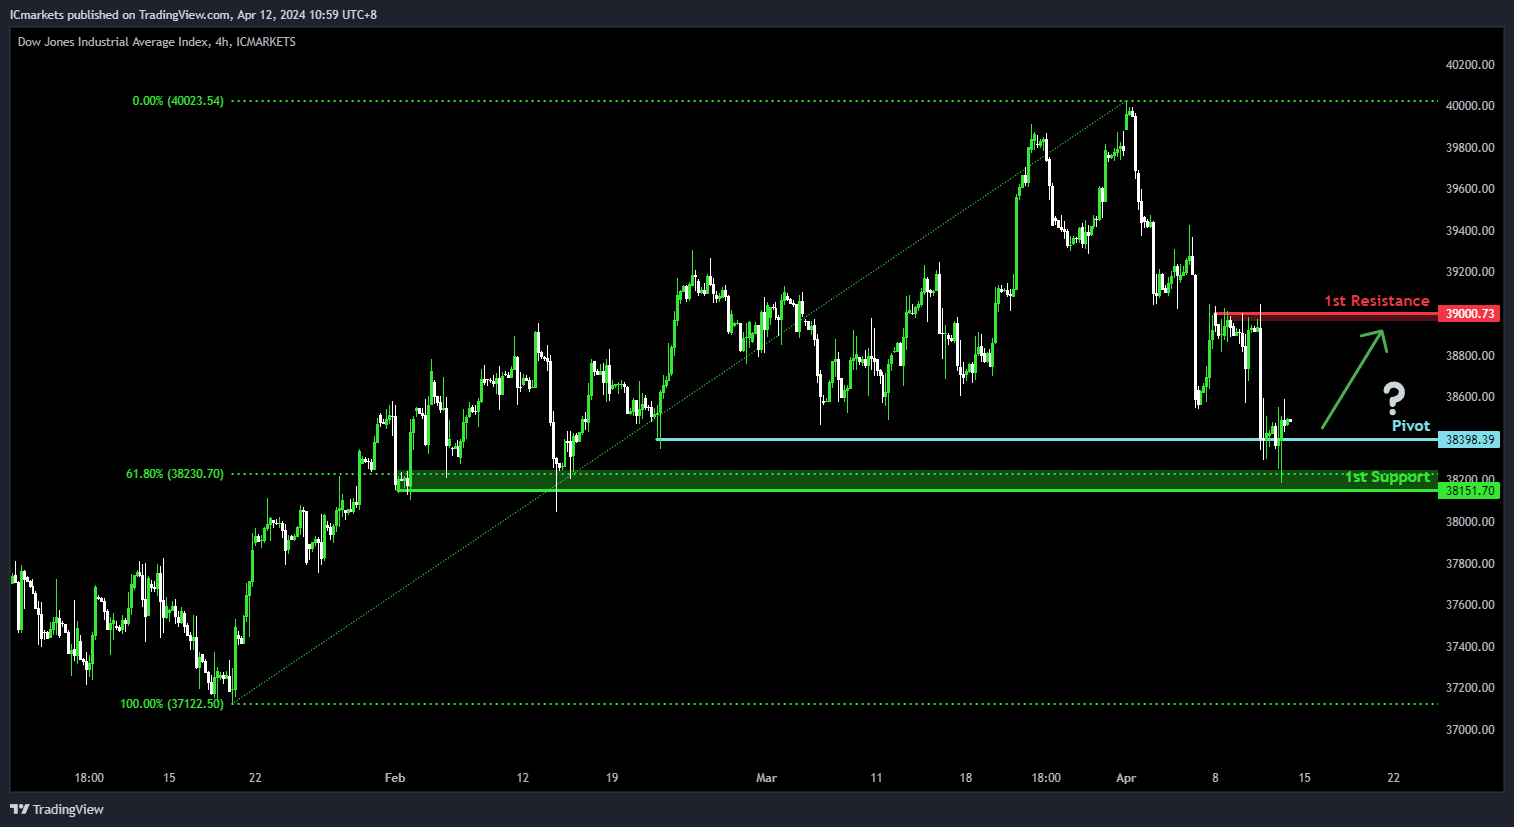
US30 (DJIA):
Potential Direction: Bullish
Overall momentum of the chart: Bearish
Price has made a bullish reaction off the pivot and could potentially rise towards the 1st resistance
Pivot: 38,398.39
Supporting reasons: Acts as a pullback support where price has found strong buying interest in recent weeks.
1st support: 38,151.70
Supporting reasons: Identified as a pullback support that aligns close to a 61.8% Fibonacci retracement level, suggesting a significant area where price has previously found strong buying interest and could provide a solid foundation to halt further downward movement.
1st resistance: 39,000.73
Supporting reasons: Identified as a pullback resistance, indicating a potential barrier that could cap further upward movements.
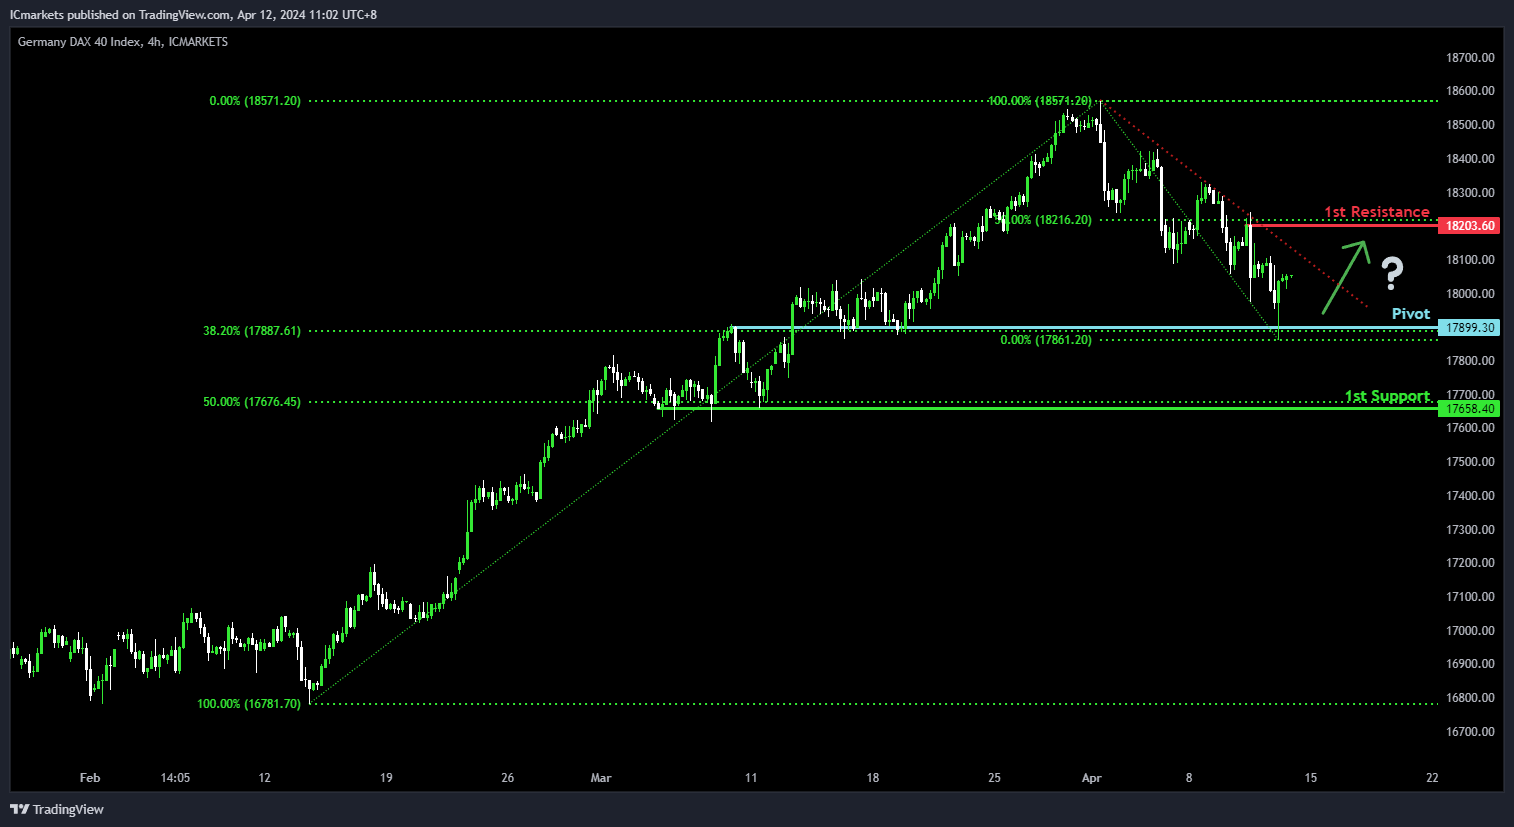
DE40 (DAX):
Potential Direction: Bullish
Overall momentum of the chart: Bearish
Price has made a bullish reaction off the pivot and could potentially rise towards the 1st resistance
Pivot: 17,899.30
Supporting reasons: Identified as an overlap support that aligns with a 38.2% Fibonacci retracement level, suggesting a potential zone where price has found strong buying interest in recent weeks.
1st support: 17,658.40
Supporting reasons: Acts as a pullback support that aligns with a 50% Fibonacci retracement level, suggesting a significant area where price has previously found strong buying interest and could provide a solid foundation to halt further downward movement.
1st resistance: 18,203.60
Supporting reasons: Identified as a pullback resistance that aligns with a 50% Fibonacci retracement level that could potentially function as a significant barrier that could cap further upward movements.
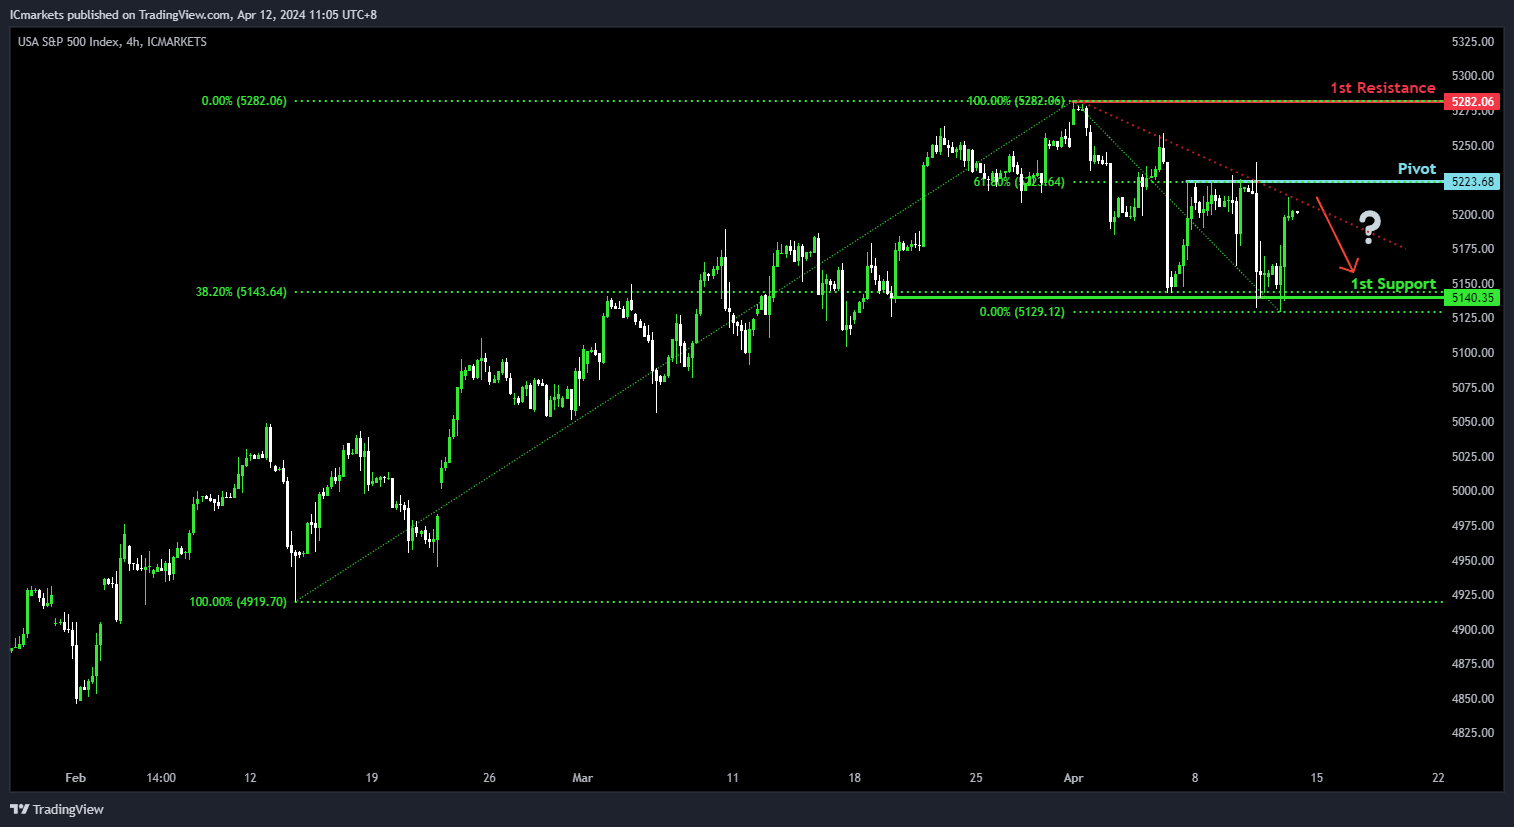
US500 (S&P 500):
Potential Direction: Bearish
Overall momentum of the chart: Neutral
Price is trading close to the pivot and could potentially make a bearish reaction off this level to drop lower towards the 1st support
Pivot: 5,223.68
Supporting reasons: Acts as a pullback support that aligns with a 61.8% Fibonacci retracement level where selling pressures have increased in recent weeks.
1st support: 5,140.35
Supporting reasons: Acts as a pullback support that aligns with a 38.2% Fibonacci retracement level suggesting a significant area where price has previously found strong buying interest, providing a solid foundation to halt further downward movement.
1st resistance: 5,282.06
Supporting reasons: Marked by a pullback resistance at the all-time high, which could function as a potential barrier and cap further upward movements.
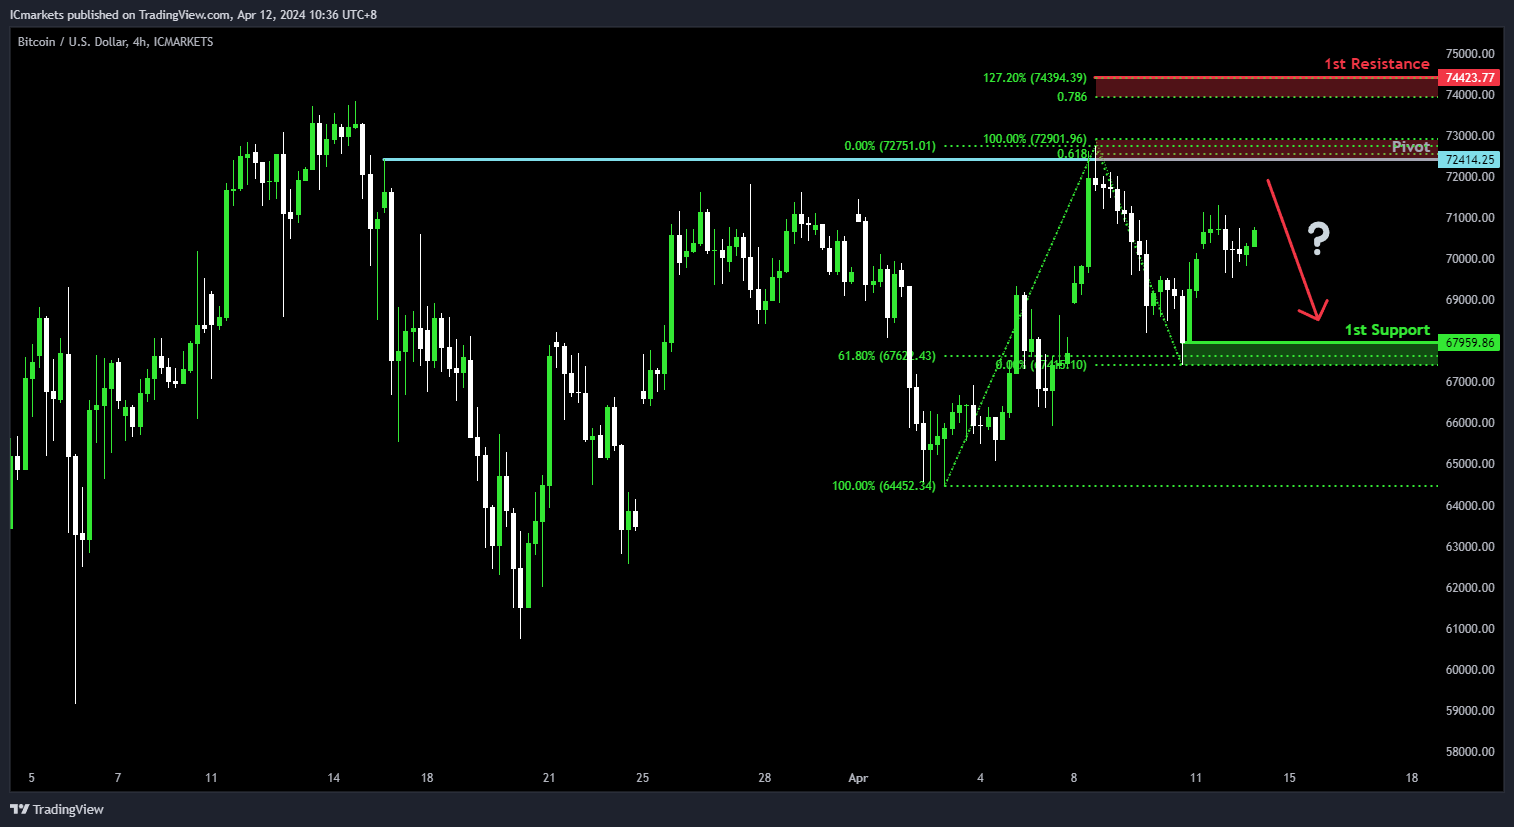
BTC/USD (Bitcoin):
Potential Direction: Bullish
Overall momentum of the chart: Neutral
Price is rising towards the pivot and could potentially make a bearish reaction off this level to drop lower towards the 1st support
Pivot: 72,414.25
Supporting reasons: Acts as a pullback resistance that aligns with a 61.8% Fibonacci projection level where selling pressures have increased recently.
1st support: 67,959.86
Supporting reasons: Acts as a pullback support that aligns close to a 61.8% Fibonacci retracement level, suggesting a significant area where price has previously found strong buying interest and could provide a solid foundation for potential price stabilization or a rebound.
1st resistance: 74,423.77
Supporting reasons: Marked by a resistance that aligns close to a confluence of Fibonacci levels i.e. the 78.6% projection and 127.2% extension, indicating a significant barrier that could cap further upward movements.
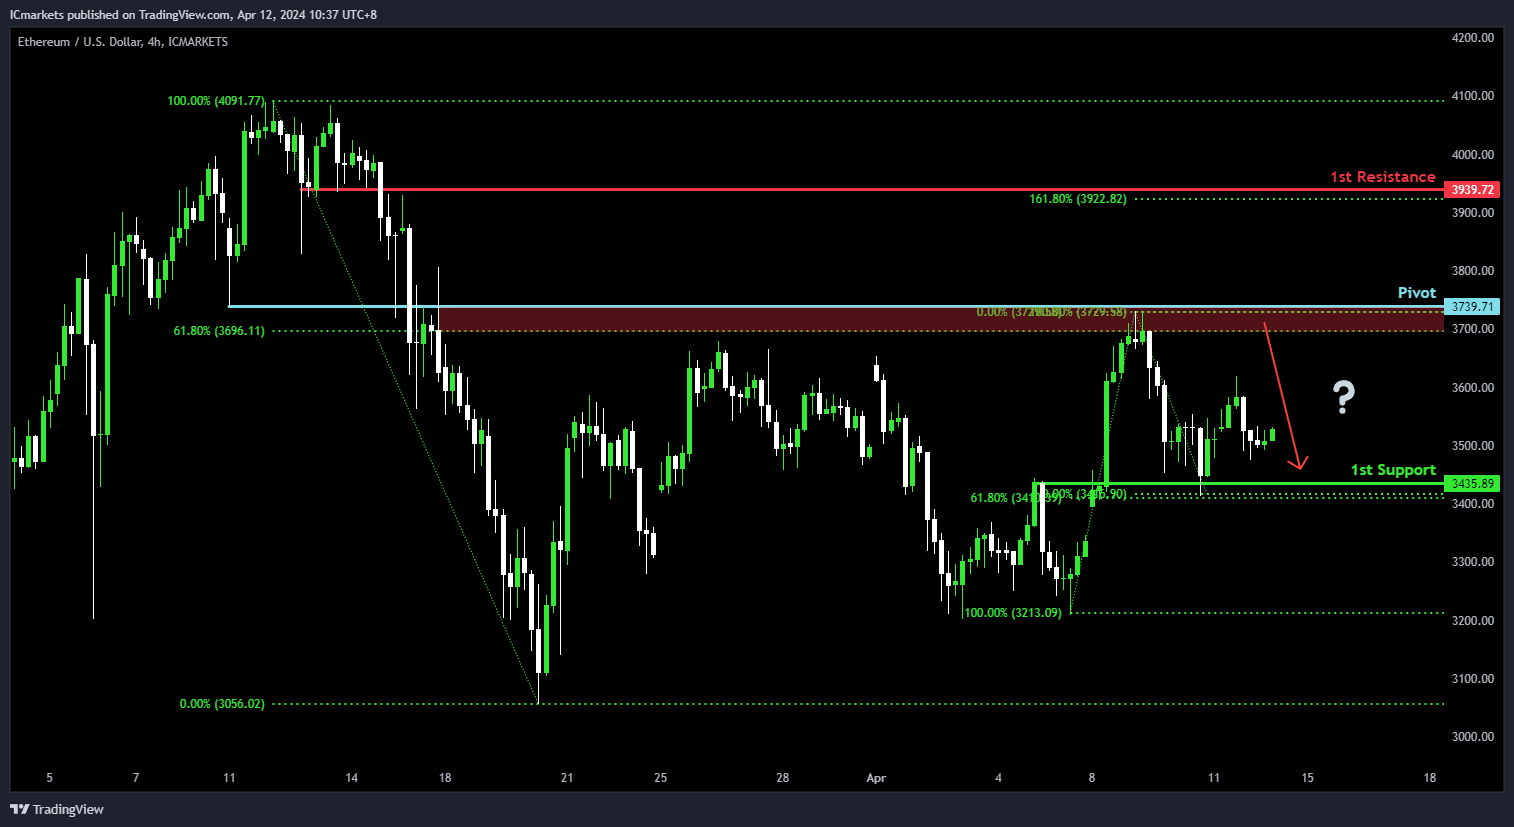
ETH/USD (Ethereum):
Potential Direction: Bullish
Overall momentum of the chart: Neutral
Price is rising towards the pivot and could potentially make a bearish reaction off this level to drop lower towards the 1st support
Pivot: 3,739.71
Supporting reasons: Acts as an overlap resistance that aligns close to a 61.8% Fibonacci retracement level where selling pressures have intensified in recent weeks.
1st support: 3,435.89
Supporting reasons: Identified as an overlap support that aligns close to a 61.8% Fibonacci retracement level suggesting a significant area where price has previously found support, providing a strong foundation to halt further downward movements.
1st resistance: 3,939.72
Supporting reasons: Identified as an overlap resistance that aligns close to a 161.8% Fibonacci extension level, marking a significant barrier that has previously capped further upward movements.
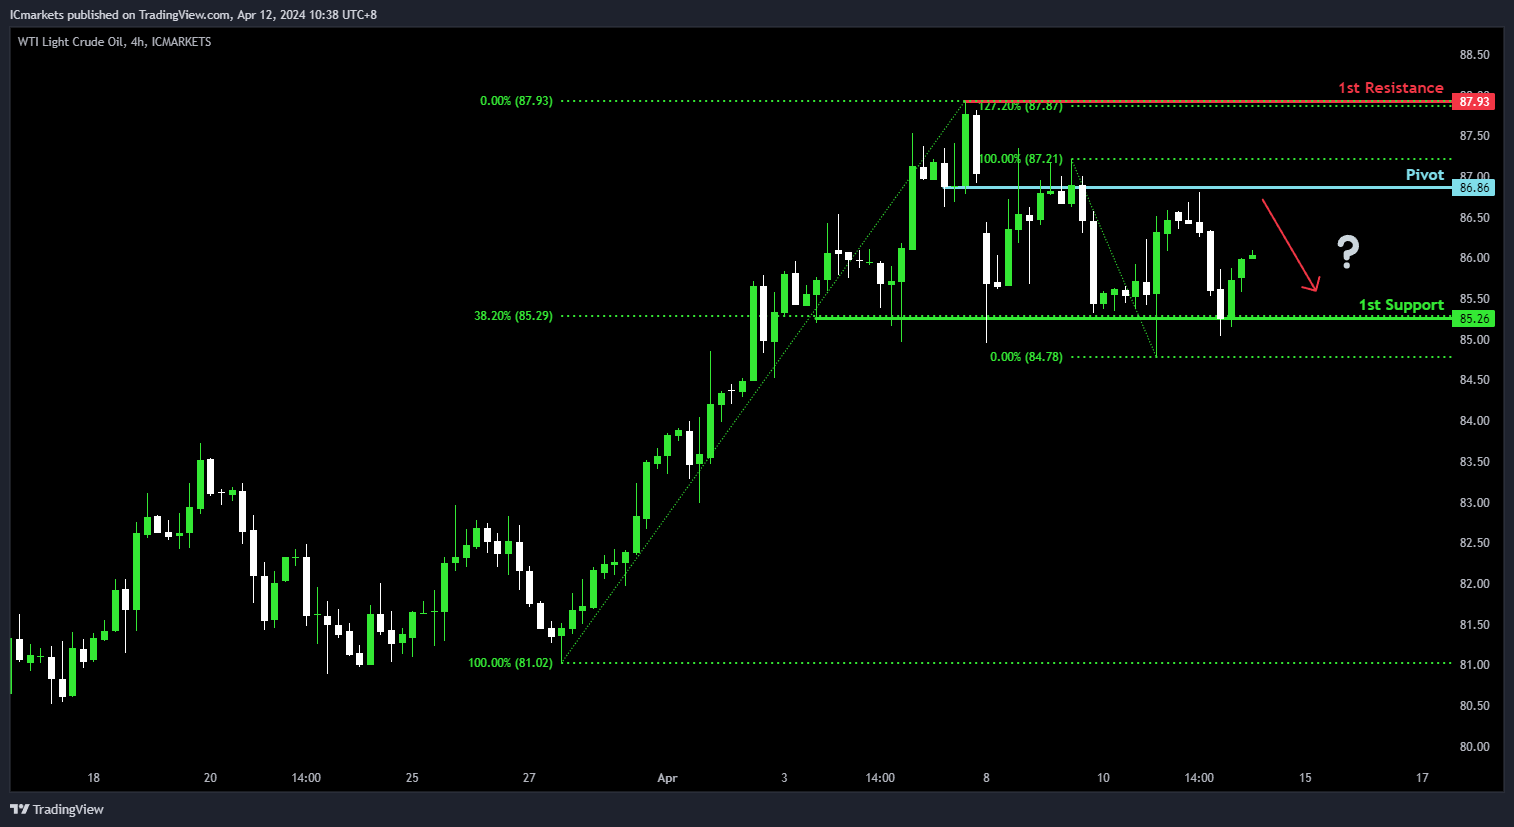
WTI/USD (Oil):
Potential Direction: Bullish
Overall momentum of the chart: Neutral
Price is rising towards the pivot and could potentially make a bearish reaction off this level to drop lower towards the 1st support
Pivot: 86.86
Supporting reasons: Marked by an overlap resistance, indicating a significant level where selling pressures have increased recently.
1st support: 85.26
Supporting reasons: Identified as a pullback support that aligns with a 38.2% Fibonacci retracement level, suggesting a significant area where price has previously found strong buying interest and could provide a solid foundation to halt further downward movements.
1st resistance: 87.93
Supporting reasons: Identified as a pullback resistance that aligns with a 127.2% Fibonacci extension level, marking a significant barrier that could cap further upward movements.
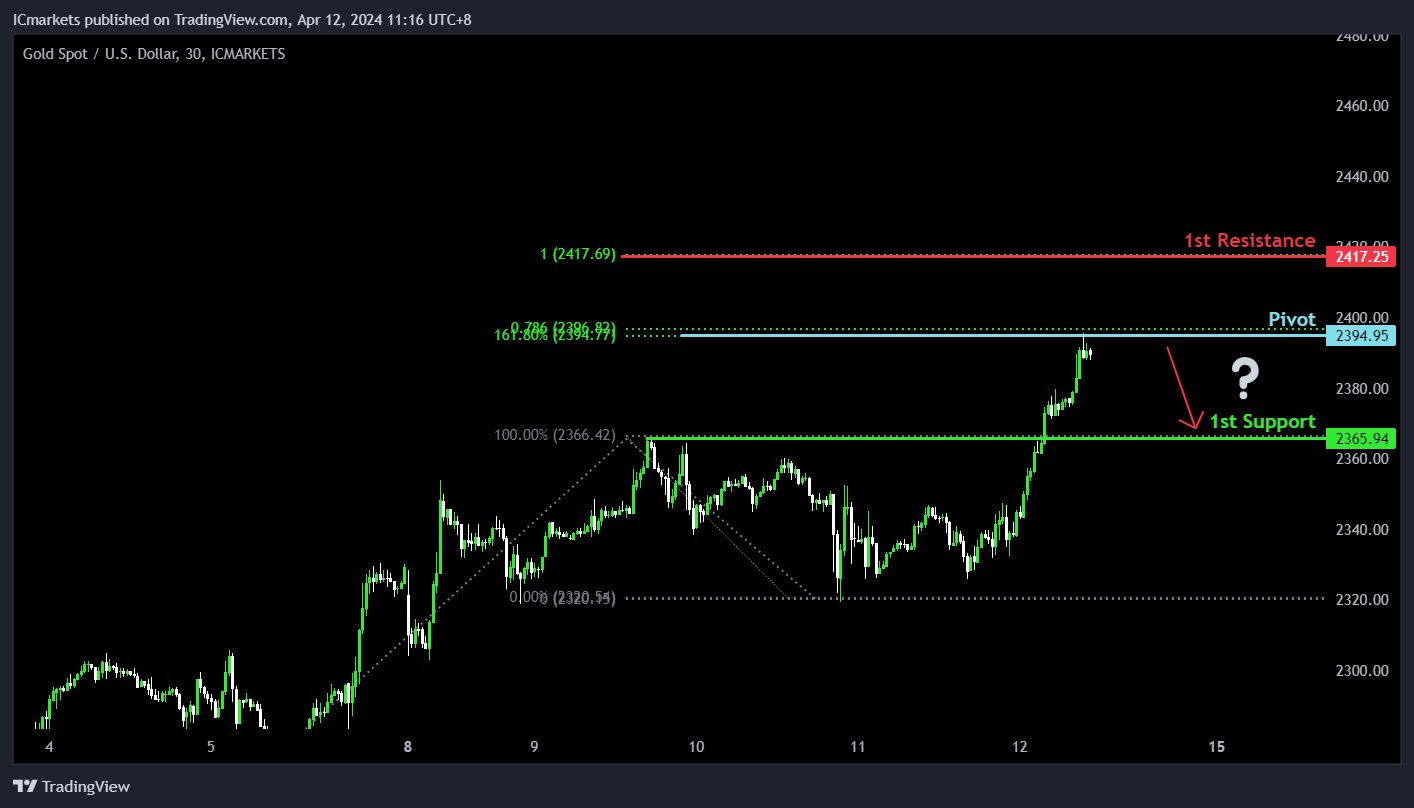
XAU/USD (GOLD):
Potential Direction: Bearish
Overall momentum of the chart: Bullish
Price could potentially make a: Bearish reaction off pivot and drop to 1st support
Pivot: 2394.00
Supporting reasons: 161.80% Fibonacci Extension and 78.60% Fibonacci Projection indicating Fibonacci confluence, suggesting a significant level where selling pressure might intensify, potentially leading to a reversal in the bullish trend.
1st support: 2365.00
Supporting reasons: Pullback support, indicating a level where buyers might enter the market to support the price temporarily within the context of the bullish trend.
1st resistance: 2417.00
Supporting reasons: 100% Fibonacci Projection, representing a level where the price might encounter selling pressure, potentially acting as a barrier to further upside movement within the context of the overall bullish momentum.
The accuracy, completeness and timeliness of the information contained on this site cannot be guaranteed. IC Markets does not warranty, guarantee or make any representations, or assume any liability regarding financial results based on the use of the information in the site.
News, views, opinions, recommendations and other information obtained from sources outside of www.icmarkets.com, used in this site are believed to be reliable, but we cannot guarantee their accuracy or completeness. All such information is subject to change at any time without notice. IC Markets assumes no responsibility for the content of any linked site.
The fact that such links may exist does not indicate approval or endorsement of any material contained on any linked site. IC Markets is not liable for any harm caused by the transmission, through accessing the services or information on this site, of a computer virus, or other computer code or programming device that might be used to access, delete, damage, disable, disrupt or otherwise impede in any manner, the operation of the site or of any user’s software, hardware, data or property.


