
Key risk events today:
Eurogroup Meetings; US Inflation M/M.
(Previous analysis as well as outside sources – italics).
EUR/USD:
Thursday had the European Central Bank (ECB) maintain policy and reaffirm guidance.
Europe’s single currency extended gains against the buck following President Lagarde’s lack of concern regarding recent euro gains.
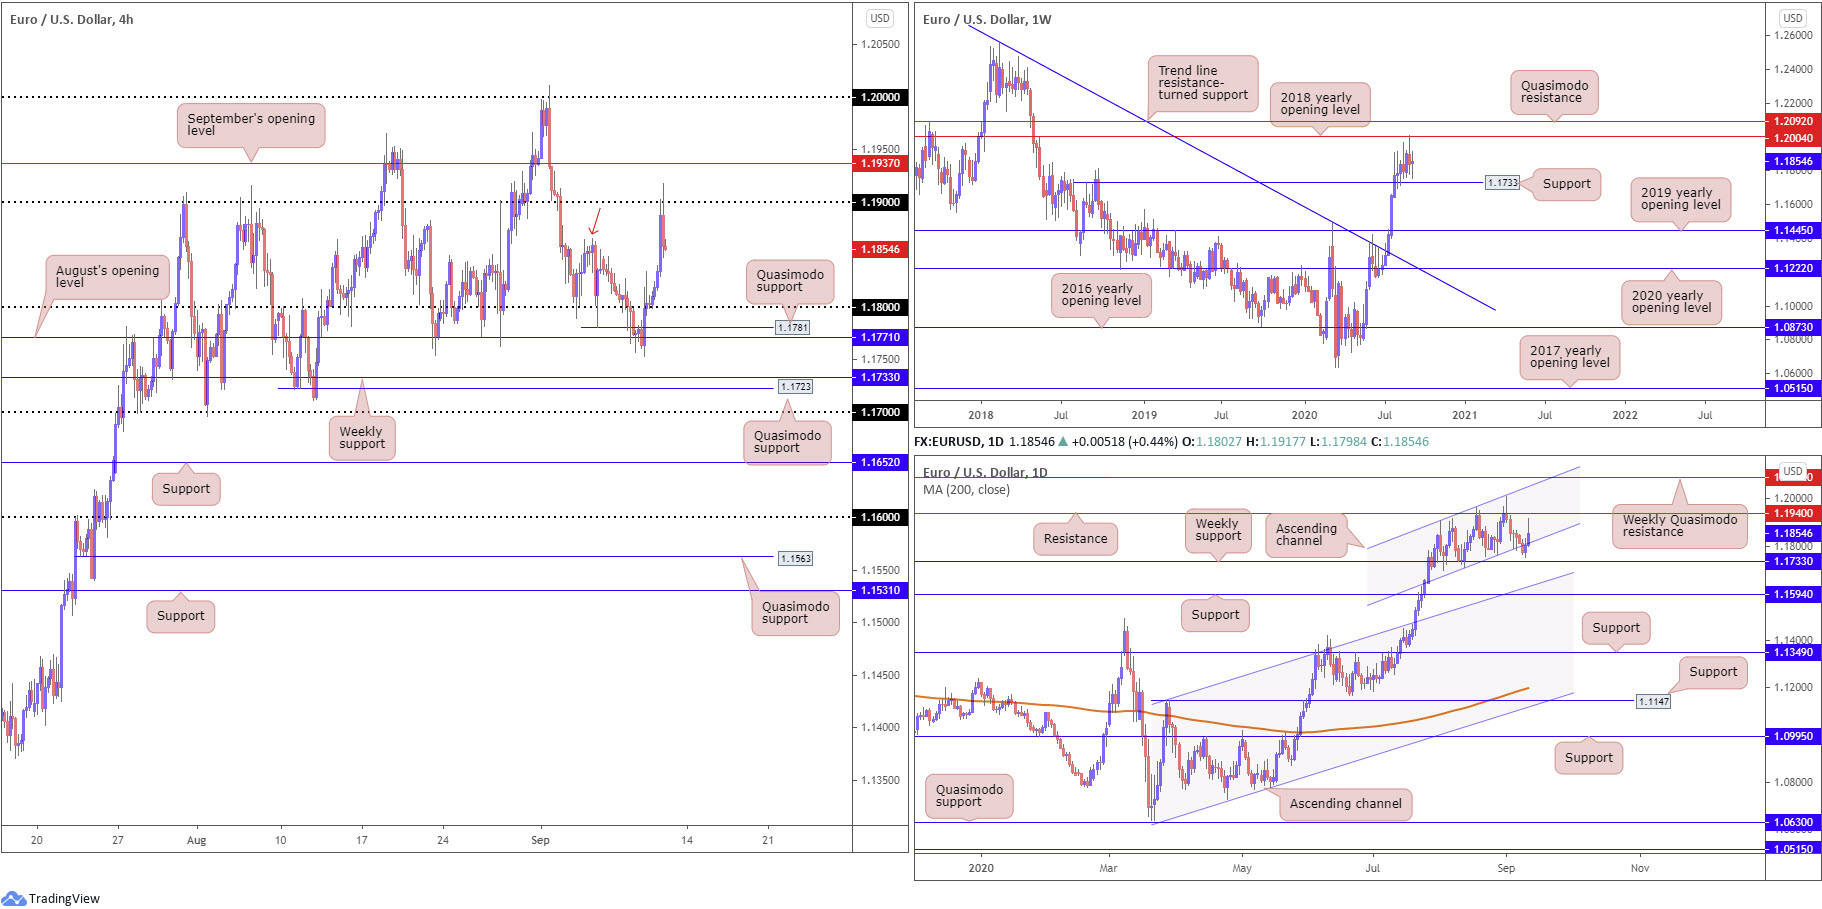
After reclaiming 1.18+ status on the H4 Wednesday, we retested the latter early Thursday and delivered strong upside, moves that shook hands with peaks above the 1.19 handle (a level plotted just south of September’s opening level at 1.1937). Recent hours has seen the pair give up a portion of earlier gains and, at the time of writing, is retesting support around 1.1857 (red arrow).
- Weekly price remains languishing south of the 2018 yearly opening level at 1.2004, sited just under Quasimodo resistance at 1.2092. Support, on the other hand, can be found at 1.1733, a previous Quasimodo resistance level.
- Daily flow, albeit after an outside dip to lows at 1.1834 on Wednesday, is seen respecting channel support on Thursday, taken from the low 1.1711. Resistance forms around the 1.1940ish region.
Areas of consideration:
A fakeout through 1.18 into H4 Quasimodo support at 1.1781/August’s opening level at 1.1771 could be in store in the near future. Tripping sell-stop liquidity under 1.18, and perhaps luring fresh buyers off noted H4 supports, may be enough to generate a H4 close back above 1.18, creating a possible intraday buy signal.
The same can be seen above 1.19 on the H4. Piercing 1.19 and testing September’s opening level at 1.1937 (while tripping buy-stop liquidity above the round number) may force a H4 close under 1.19 and promote a bearish scenario. Note September’s opening level is situated nearby daily resistance mentioned above at 1.1940.
GBP/USD:
Plagued by heightened no-deal Brexit risk, GBP/USD is currently down by 3.5% this week and 1.5% Thursday.
Technically, those who read Thursday’s briefing may recall the following (italics):
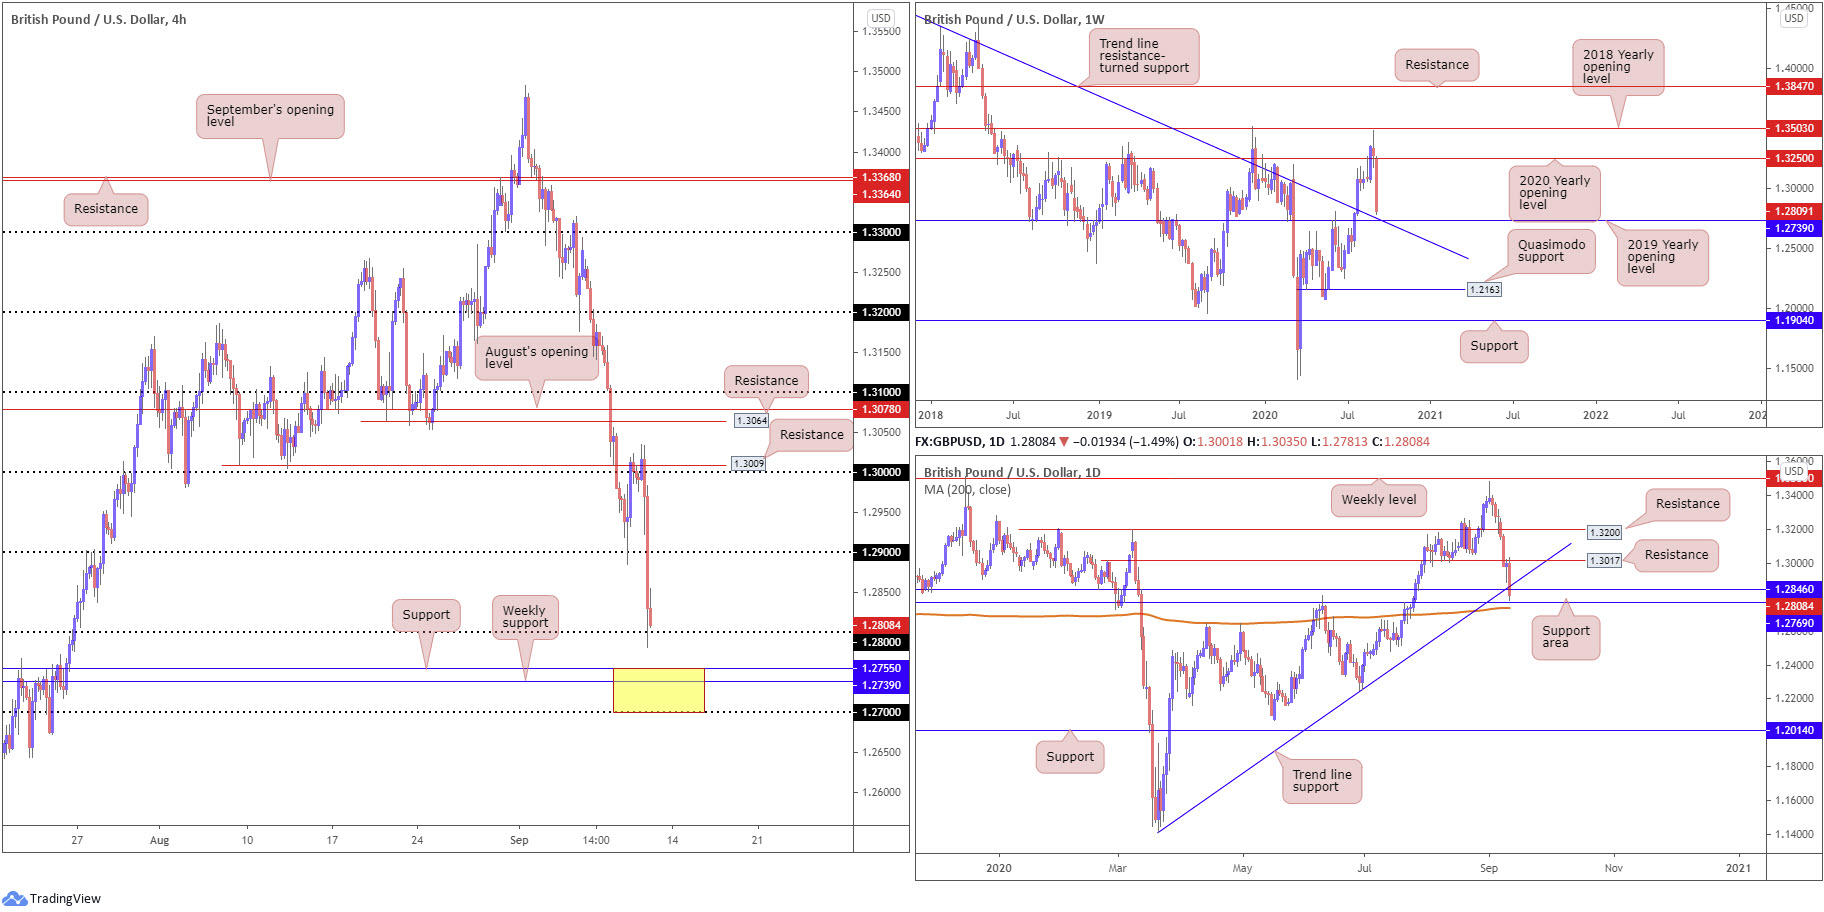
Selling from 1.30 is likely on the watchlist for many traders going forward. The fact we have H4 resistance at 1.3009 and daily resistance at 1.3017 located nearby offers healthy confluence to work with, targeting H4 support at 1.2939 as an initial take-profit zone.
As evident from the H4 timeframe this morning, the 1.30 region proved stable resistance and prompted another wave of aggressive selling Thursday: a swift 200-pip move to 1.28.
- Technical studies on the weekly timeframe show we’re trading within touching distance of the 2019 yearly opening value at 1.2739, merging closely with trend line resistance-turned support, extended from the high 1.5930, after firmly overthrowing the 2020 yearly opening value at 1.3250.
- The daily timeframe, however, is seen touching gloves with trend line support, taken from the low 1.1409, and a support area coming in at 1.2769/1.2846, positioned just ahead of a 200-day SMA (orange – 1.2736).
Areas of consideration:
The area (yellow) consisting of 1.27 on the H4, weekly support at 1.2739 and H4 support at 1.2755 could provide some much-needed respite if tested. Note also that the 200-day SMA lurks within the 1.27/1.2755 region.
Breaking 1.28 to the downside today could ignite additional selling and spark an intraday bearish signal to approach 1.27/1.2755.
AUD/USD:
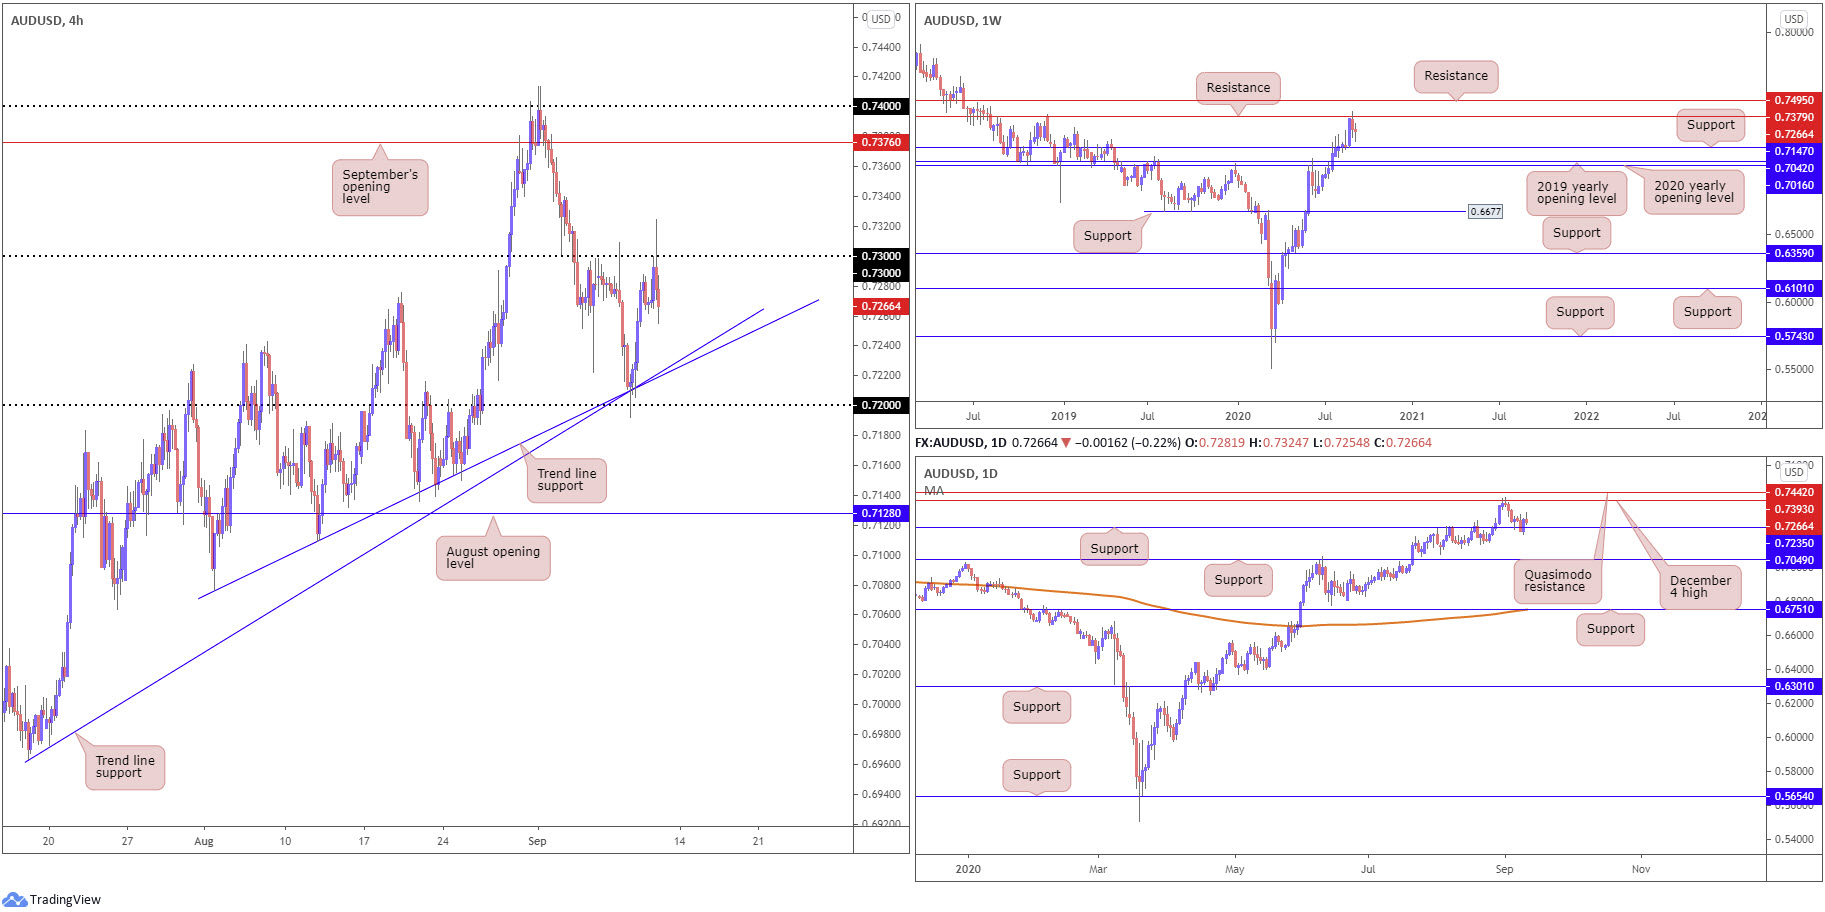
Risk sentiment souring Thursday and the DXY concluding off worst levels weighed on AUD/USD, capping upside attempts north of the 0.73 handle on the H4.
- H4 is now eyeing a possible retest at two nearby trend line supports (0.7076/0.6963).
- Daily remains off support at 0.7235, though is struggling to preserve gains, consequently forming a shooting star candle pattern yesterday (bearish signal).
- Weekly offers an indecisive tone between resistance at 0.7379 and support from 0.7147.
Areas of consideration:
In the event we fail to reach H4 trend line supports today and regain a bullish footing, a break above 0.73 could have bullish themes take over and approach September’s opening level at 0.7376. The latter, as aired in previous writing, is plotted nearby weekly resistance at 0.7379 and daily resistance at 0.7393 (December 4 high – the next upside target on the daily scale).
Reaching H4 trendline support, however, could also draw in buyers, owing to the ascending lines merging with daily support mentioned above at 0.7235.
USD/JPY:
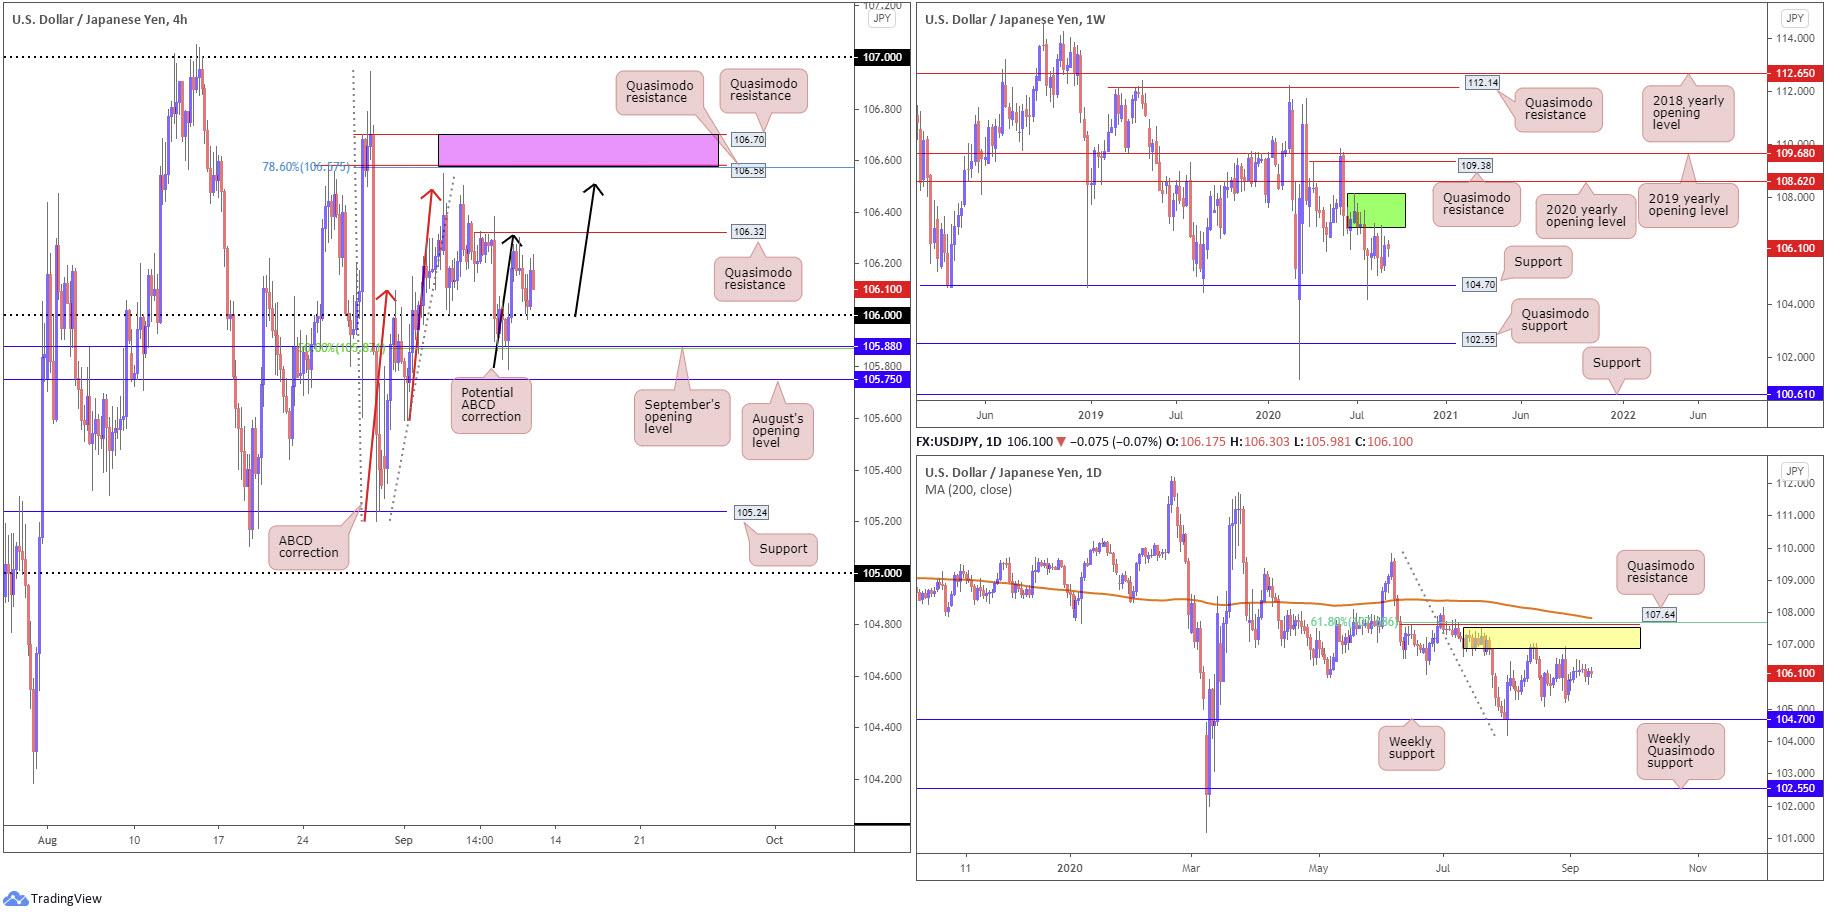
USD/JPY failed to exploit recent upside on Thursday, dipping to 106 on the H4 and modestly rebounding into the close. Downbeat risk sentiment capped any meaningful USD/JPY upside.
This has landed H4 candles back within touching distance of Quasimodo resistance at 106.32, with a break featuring two Quasimodo formations at 106.58 (merges with 78.6% Fibonacci resistance at 106.57) and 106.70 (pink), as well as possible ABCD bearish structure circling 106.50 (black arrows).
Technical structure on the higher timeframes remains unchanged.
Weekly timeframe:
- Supply remains prominent at 108.16-106.88 (dark green) after price made its way off support at 104.70 at the end of July. Should buyers hold upside, the 2020 yearly opening level at 108.62 may eventually enter view, closely tracked by Quasimodo resistance at 109.38.
Daily timeframe:
- Supply at 107.55/106.89 (yellow), an area housed within the lower boundary of weekly supply mentioned above at 108.16-106.88, has proved a tough nut to crack. Downside from current price could target weekly support underlined above at 104.70. In the event buyers climb, Quasimodo resistance at 107.64 might enter play, reinforced by a 61.8% Fibonacci retracement ratio at 107.68 and 200-day SMA (orange – 107.83).
Areas of consideration:
Outlook unchanged due to Thursday’s lacklustre range.
A reaction from H4 Quasimodo resistance at 106.32 is possible, though many traders will seek additional confirmation before shorting, given the level’s lack of confluence, both locally and on the higher timeframes.
Should buyers take out H4 Quasimodo resistance at 106.32, bullish scenarios may be on the cards to ABCD resistance at 106.50 and 106.70/106.58, followed by a possible run to the underside of higher timeframe supplies around 106.88ish and 107 resistance (H4).
USD/CAD:
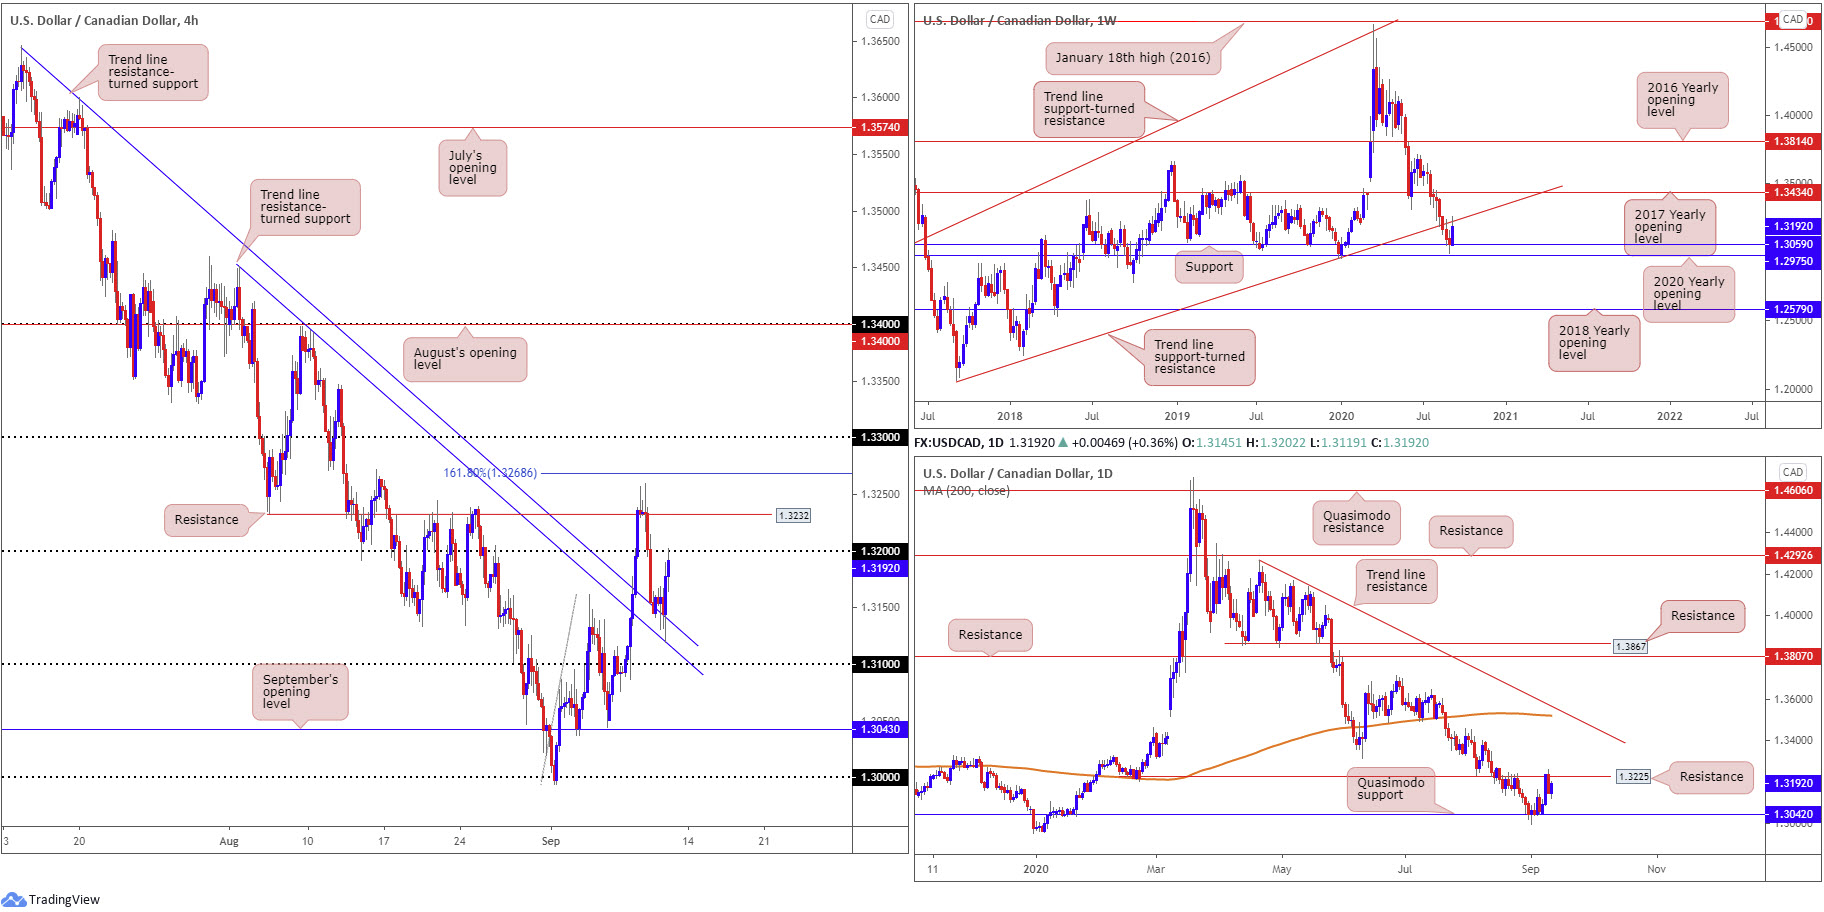
The combination of trend line support-turned resistance, taken from the low 1.2061, on the weekly timeframe, daily resistance at 1.3225, a prior Quasimodo support and H4 resistance at 1.3232 saw USD/CAD decisively turn lower Wednesday. This led H4 candles through 1.32 to tackle trend line resistance-turned support, extended from the high 1.3646, located close by another trend line resistance-turned support, from the high 1.3451.
Thursday had price action respond from the aforementioned H4 trend line supports and revisit the underside of 1.32, as WTI tested waters under $37.00 a barrel and DXY ended the session significantly off worst levels.
Areas of consideration:
This is an interesting market right now.
On one side we had weekly support at 1.3059 and daily Quasimodo support at 1.3042 making an appearance earlier this week, prompting a bullish reversal. On the other side we recently had weekly price test trend line resistance and daily price test resistance from 1.3225.
With the above in mind, further buying could prove difficult above 1.32 on the H4, possibly hindered by daily resistance and H4 resistance from 1.3232.
Technically speaking, a sell-off from the 1.32 region is a possibility as we’re quite a way off higher timeframe supports and we only recently engaged higher timeframe resistances. Couple this with the market trending lower since mid-March, the 1.3232 (H4 resistance)/1.32 region could see active selling emerge.
USD/CHF:
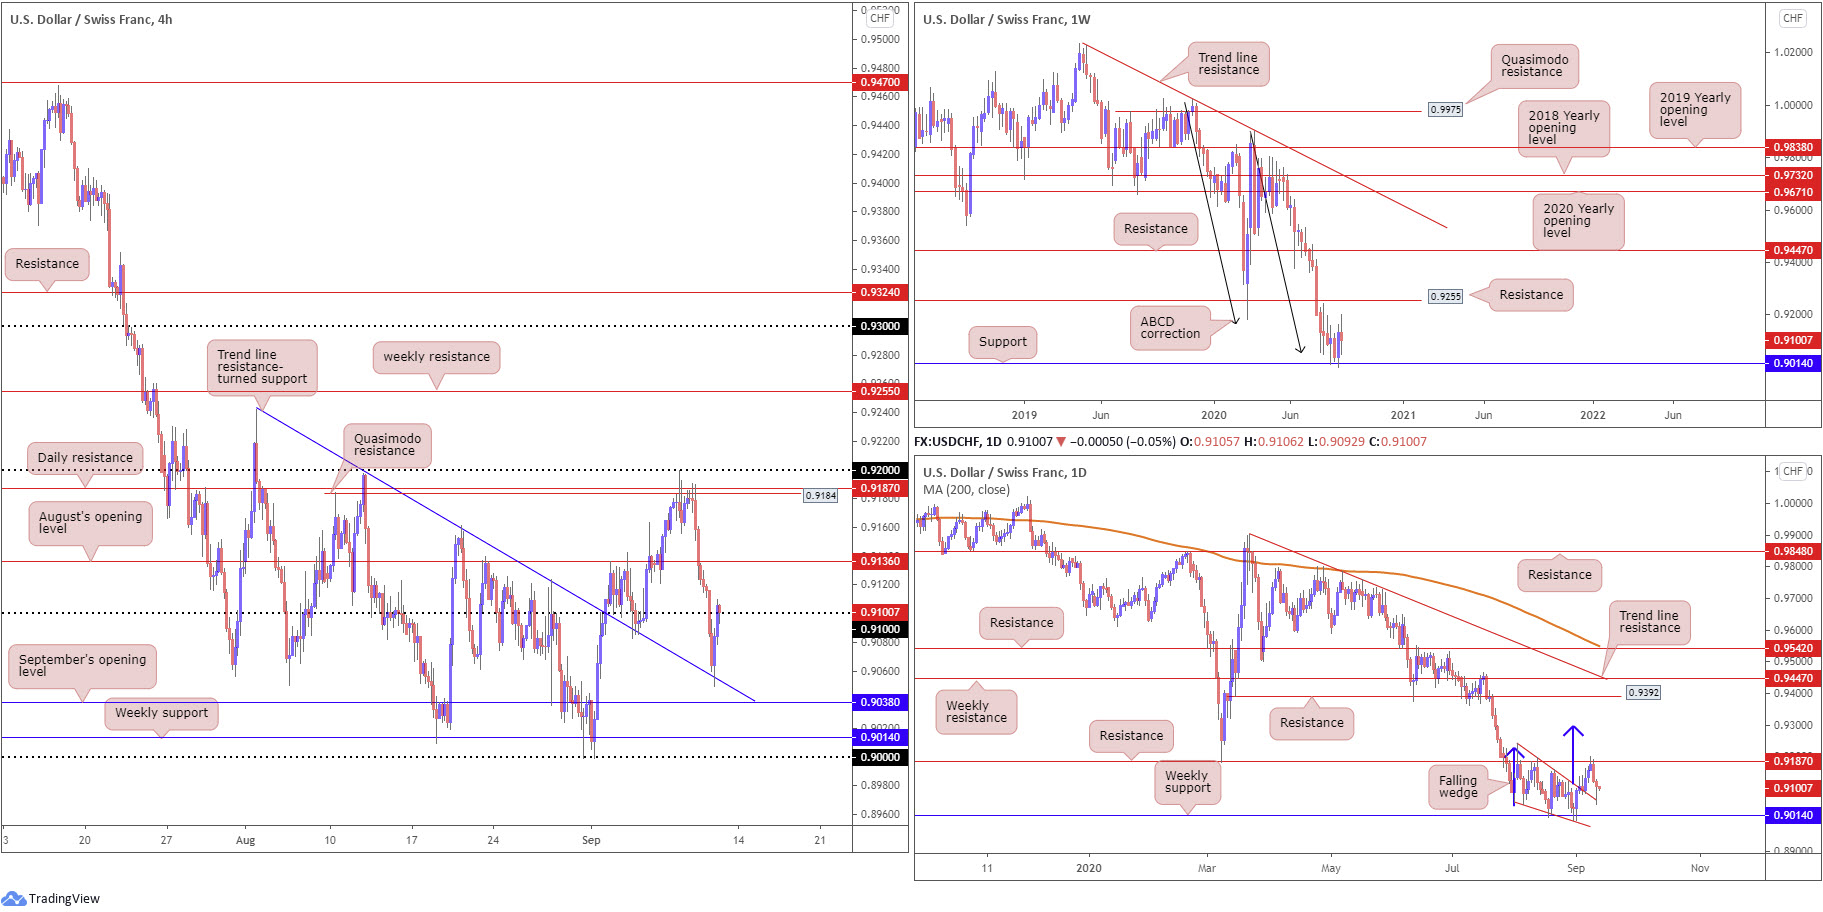
USD/CHF wrapped up Thursday considerably off session lows, recoiling from a H4 trend line resistance-turned support, taken from the high 0.9241. Those who have been following our USD/CHF analysis over the past week will note the aforementioned H4 trend line represents the upper limit of a falling wedge on the daily timeframe, pencilled in from the high 0.9241 and a low of 0.9056.
The next port of call on the daily timeframe, in terms of resistance, falls in at 0.9187, though before reaching for this level we must contend with August’s opening level at 0.9136 on the H4 timeframe. Also note that daily resistance merges closely with H4 Quasimodo resistance at 0.9184.
Further out on the weekly timeframe, we can see price remains buoyed above support at 0.9014/ABCD support at 0.9051 (black arrows), eyeing possible resistance at 0.9255, a previous Quasimodo support level.
Areas of consideration:
With daily price finishing Thursday in the shape of a hammer candlestick formation (bullish signal) after retesting the upper boundary of a daily falling wedge configuration, along with H4 marginally closing above 0.91, we could have buyers attempt to make a run for August’s opening level at 0.9136 (H4) today. This, assuming we pursue higher levels, could observe follow-through buying take hold, pushing for daily resistance mentioned above at 0.9187.
Conservative buyers are likely to wait and see how we respond off the 0.91 retest (occurring as we write) before pulling the trigger. A solid bullish reaction may entice buying.
Dow Jones Industrial Average:
US equity benchmarks fell sharply Thursday amid losses in big tech stocks. The Dow Jones Industrial Average declined 405.89 points, or 1.45%; the S&P 500 dropped 59.77 points, or 1.76% and the Nasdaq traded lower by 221.97 points, or 1.99%.
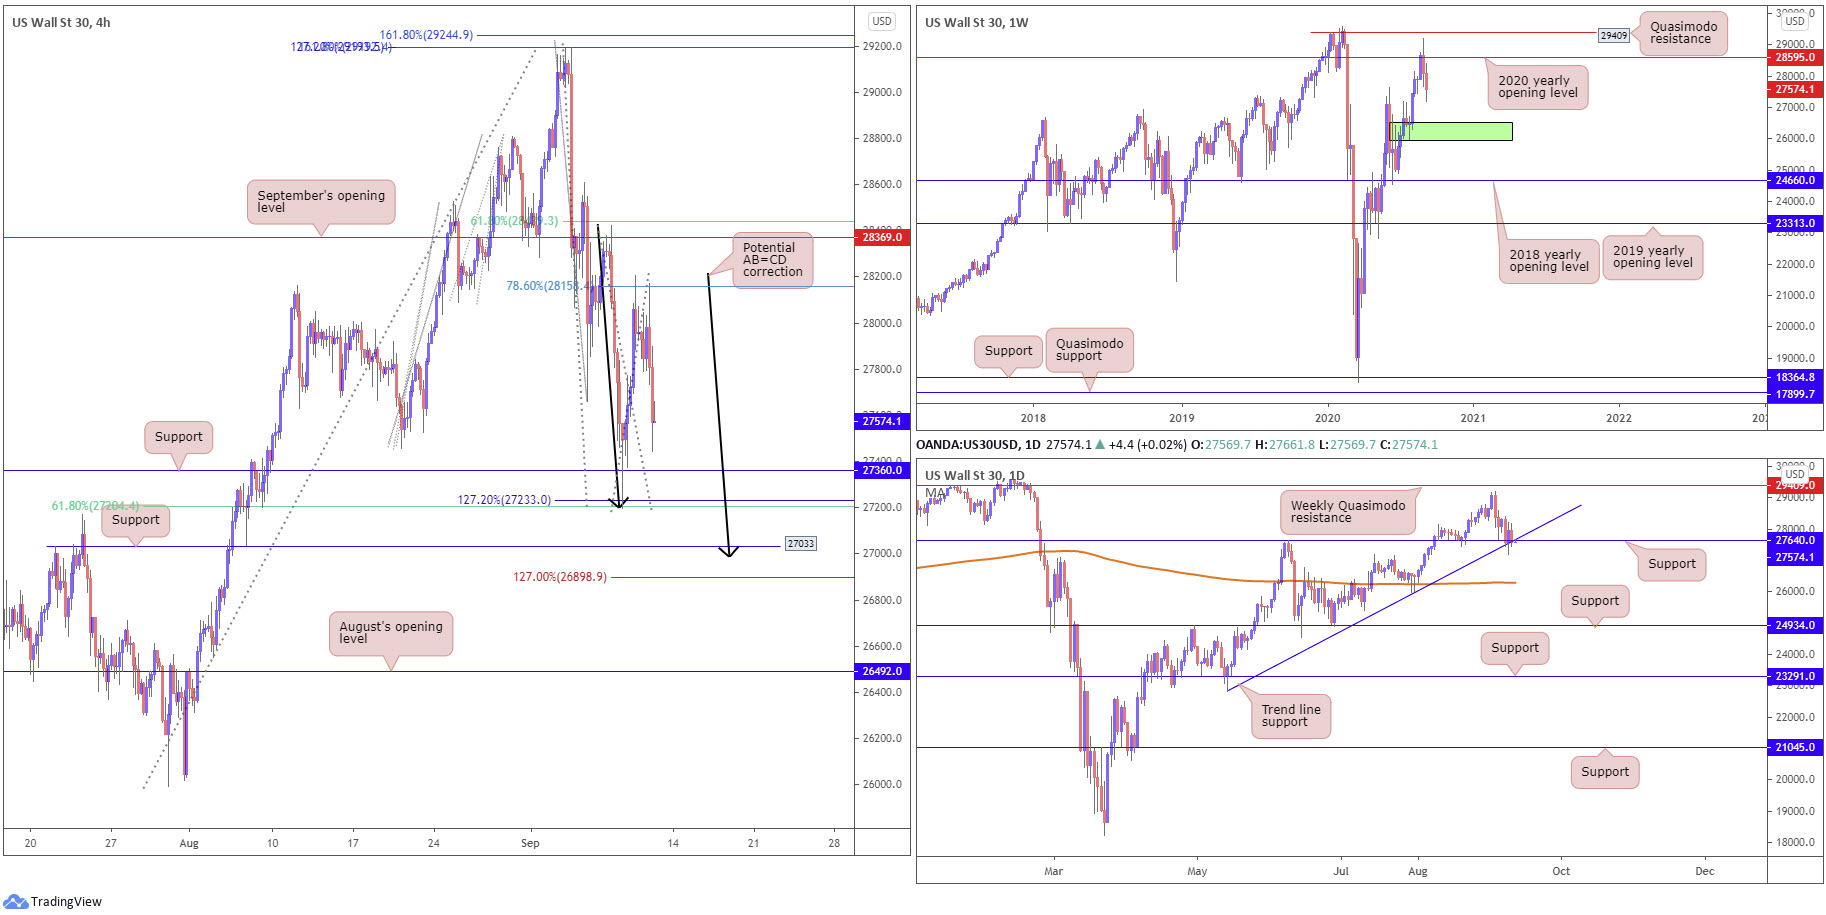
The weekly timeframe reveals price movement holding south of the 2020 yearly opening value at 28595 (sited just under Quasimodo resistance at 29409). Downside movement from here could retreat as far south as demand (green) at 25916-26523.
Trend line support, taken from the low 22803, and support at 27640 continues to reinforce this market on the daily timeframe. An extension higher could eventually draw things to the 29193 September peak, followed by weekly Quasimodo resistance mentioned above at 29409. If a break lower comes to pass, this could bring light to the 200-day SMA (orange – 26294).
The H4 timeframe reveals price to be fast approaching support at 27360, shadowed closely by a 127.2% Fibonacci extension point at 27233 and a 61.8% Fibonacci retracement ratio at 27204. Beyond the latter, we’re watching support at 27033, a level that joins closely with a potential AB=CD correction (black arrows) at 26985 and 1.27% BC projection at 26898.
Areas of consideration:
Weekly suggests sellers may attempt to explore lower levels south of resistance at 28595, yet daily price reveals a support/trend line support combination remains in motion.
H4 support found between 27204/27360 could hamper downside today and perhaps promote bullish themes, as could H4 support at 27033 and joining AB=CD correction.
XAU/USD (GOLD):
For those who read Thursday’s technical piece you may recall the following (italics):
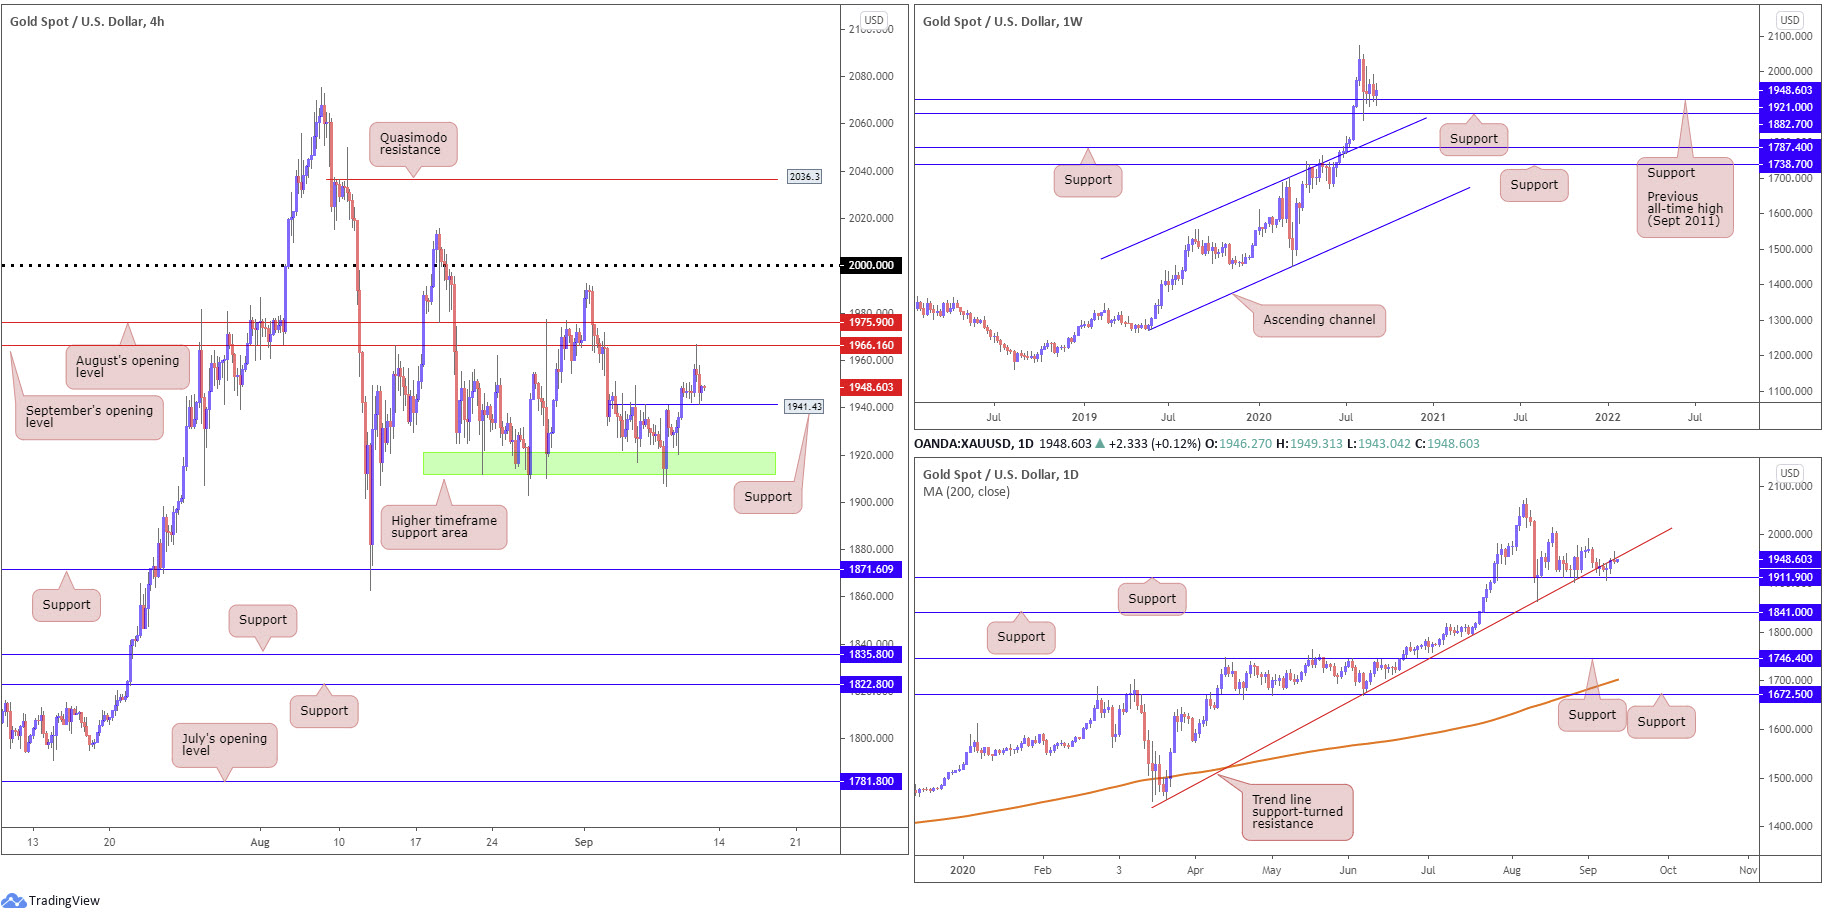
Only recently have we seen H4 action make headway above a familiar area of higher timeframe support at $1,911.90-$1,921.00 (green). This was a noted base to keep eyeballs on. Of particular interest was Tuesday’s strong bullish rejection. Areas to keep a tab on should an advance materialise are September’s opening value at $1,966.16, and August’s opening value coming in at $1,975.90.
As evident from the H4 chart this morning, XAU/USD made a run for September’s opening value at $1,966.16 and modestly rebounded. This, given the level joins with trend line support-turned resistance on the daily timeframe, taken from the low $1,455.32, was likely enough to have current buyers from $1,911.90-$1,921.00 reduce risk to breakeven and bank partial profits.
Further buying remains a possibility, despite daily resistance, having seen weekly support make a stand at $1,921.00, the previous major all-time high (September 2011), located ahead of weekly support at $1,882.70. Clearing August’s opening value at $1,975.90 (H4) could see price make its way back to the $2,000.00 level.
Areas of consideration:
Overall, this remains a buyers’ market, according to the current trend – higher since bottoming in 2016.
Traders long will likely be watching H4 support at $1,941.43 to hold today. Breaking below here indicates daily sellers may be strengthening their grip off trend line resistance, whereas holding current support suggests higher timeframe buyers could take aim at higher levels off weekly support from $1,921.00.
A Notable H4 bullish candlestick configuration printed from $1,941.43 will not only please current buyers, it also provides opportunity for fresh buying in favour of consuming $1,975.90 for $2,000.00.
The accuracy, completeness and timeliness of the information contained on this site cannot be guaranteed. IC Markets does not warranty, guarantee or make any representations, or assume any liability regarding financial results based on the use of the information in the site.
News, views, opinions, recommendations and other information obtained from sources outside of www.icmarkets.com.au, used in this site are believed to be reliable, but we cannot guarantee their accuracy or completeness. All such information is subject to change at any time without notice. IC Markets assumes no responsibility for the content of any linked site.
The fact that such links may exist does not indicate approval or endorsement of any material contained on any linked site. IC Markets is not liable for any harm caused by the transmission, through accessing the services or information on this site, of a computer virus, or other computer code or programming device that might be used to access, delete, damage, disable, disrupt or otherwise impede in any manner, the operation of the site or of any user’s software, hardware, data or property.


