
Friday 11th March: Daily technical outlook and review.
A note on lower timeframe confirming price action…
Waiting for lower timeframe confirmation is our main tool to confirm strength within higher timeframe zones, and has really been the key to our trading success. It takes a little time to understand the subtle nuances, however, as each trade is never the same, but once you master the rhythm so to speak, you will be saved from countless unnecessary losing trades. The following is a list of what we look for:
- A break/retest of supply or demand dependent on which way you’re trading.
- A trendline break/retest.
- Buying/selling tails – essentially we look for a cluster of very obvious spikes off of lower timeframe support and resistance levels within the higher timeframe zone.
- Candlestick patterns. We tend to only stick with pin bars and engulfing bars as these have proven to be the most effective.
For us, lower timeframe confirmation starts on the M15 and finishes up on the H1, since most of our higher timeframe areas begin with the H4. Stops usually placed 5-10 pips beyond your confirming structures.
EUR/USD:
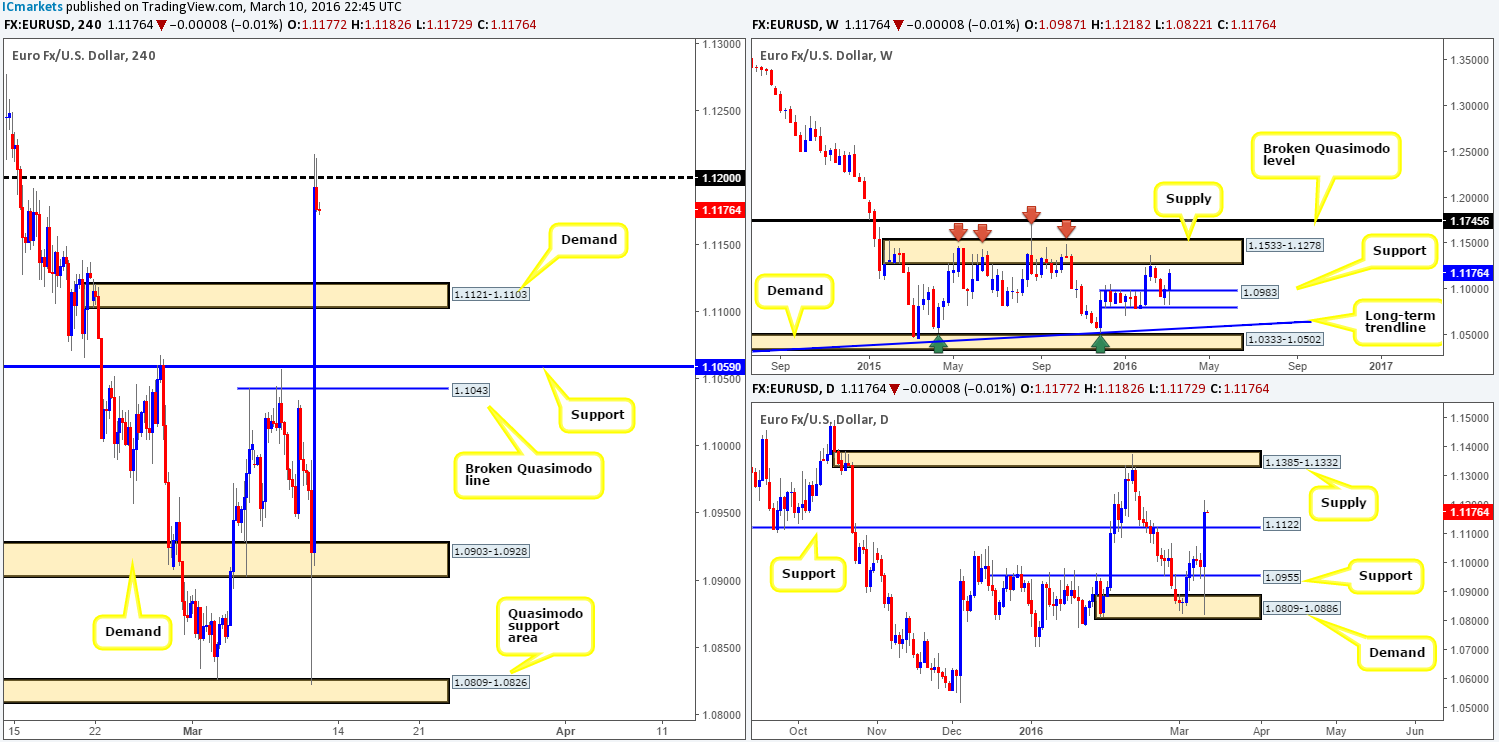
Following an exciting ECB press conference yesterday where Draghi cut rates to 0.0% and expanded the QE program to 80 billion Euros per month, the EUR immediately tumbled to lows of 1.0822 – hitting our H4 Quasimodo support area at 1.0809-1.0826 to-the-pip. However, shortly after this, Draghi added that he saw no need for further rate cuts from here which saw the EUR reverse its recent losses and aggressively rally around 400 pips.
This buying, as you can see, took out multiple H4 resistances along the way, only pausing once it reached the 1.1200 figure which continues to hold the single currency lower as we write. Given this recent action let’s see how the land lies on the higher-timeframe picture. Up on the weekly chart, price shows room to continue driving north up to a weekly supply zone coming in at 1.1533-1.1278. Meanwhile below on the daily chart, resistance at 1.1122 was taken out yesterday which in theory should act as support now for a bounce up to supply at 1.1385-1.1332 (located within the weekly supply discussed above).
In light of the points made above, our attention will mostly be driven toward looking for price to bounce from H4 demand at 1.1121-1.1103 today for a confirmed long into the market. First target will obviously depend on how price approaches this barrier, but the final destination will, at least for us, be the underside of weekly supply at 1.1278.
Levels to watch/live orders:
- Buys: 1.1121-1.1103 [Tentative – confirmation required] (Stop loss: dependent on where one confirms this area).
- Sells: Flat (Stop loss: N/A).
GBP/USD:
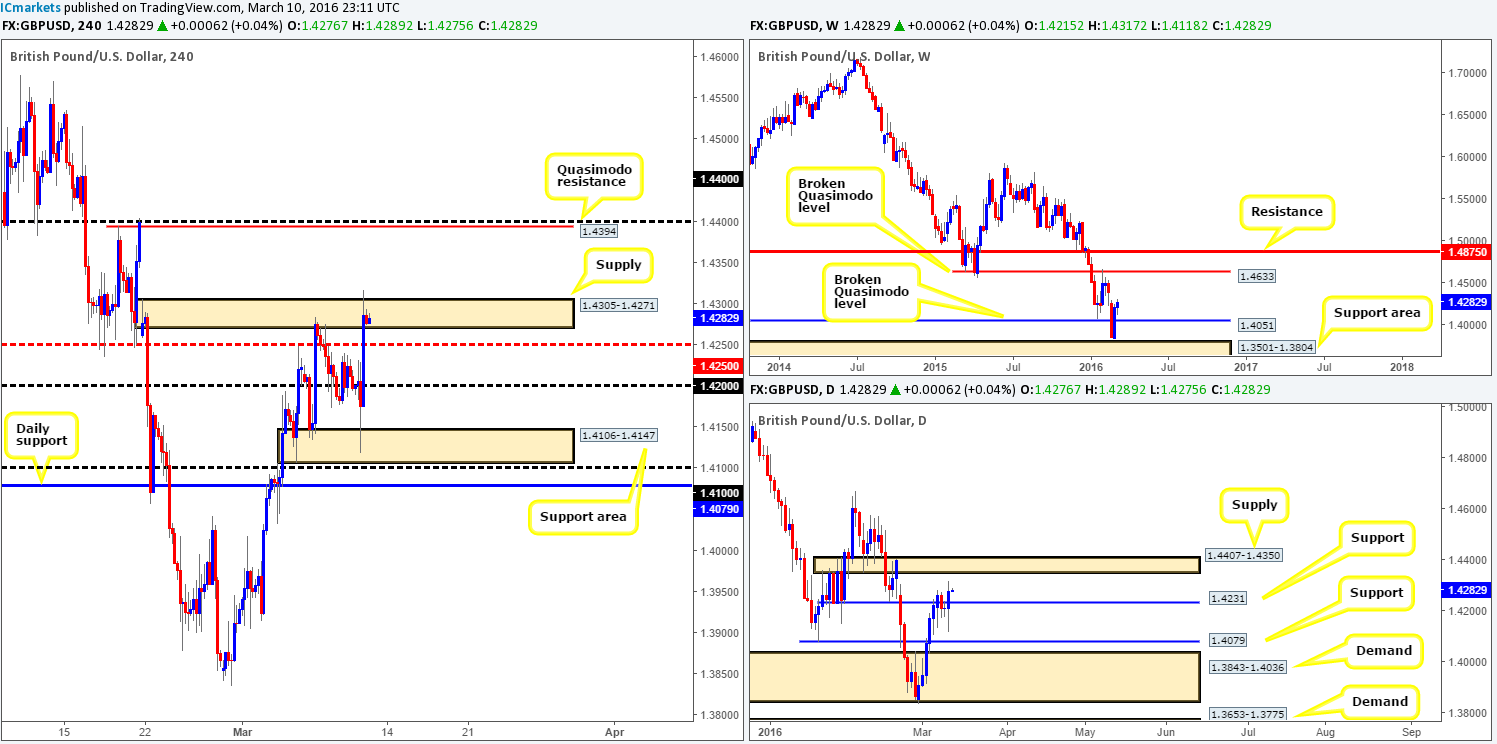
Yesterday’s ECB shenanigans, as can be seen from the H4 chart, drove Cable higher which ended with price surpassing supply penciled in at 1.4305-1.4271. We feel the break above this zone has likely taken out a truckload of stops and potentially cleared the runway north for this pair to challenge the H4 Quasimodo level coming in at 1.4394. From current price, the most we see this pair reversing to is around the 1.4250 region, or maybe a little lower due to daily support lurking at 1.4231.
With the above in mind, our plan of attack will consist of the following:
- Watch for price to close above the current H4 supply. This, in effect will be our cue to begin watching for this market to retest the broken area as demand and bounce higher (confirmation required). Any positions executed from this zone will be closed at the aforementioned H4 Quasimodo resistance line.
- Once, or indeed if price connects with the Quasimodo barrier our attention will turn to shorts since at that point not only is there a psychological figure at 1.4400 supporting this Quasimodo, but it’s also housed within a daily supply zone drawn from 1.4407-1.4350. We would advise waiting for the lower timeframes to confirm this area before shorting due to the possibility of a fakeout being seen here.
Levels to watch/live orders:
- Buys: Watch for price to consume the 1.4305-1.4271 area and look to trade any retest seen thereafter (lower timeframe confirmation required).
- Sells: 1.4394 [Tentative – confirmation required] (Stop loss: dependent on where one confirms this level).
AUD/USD:
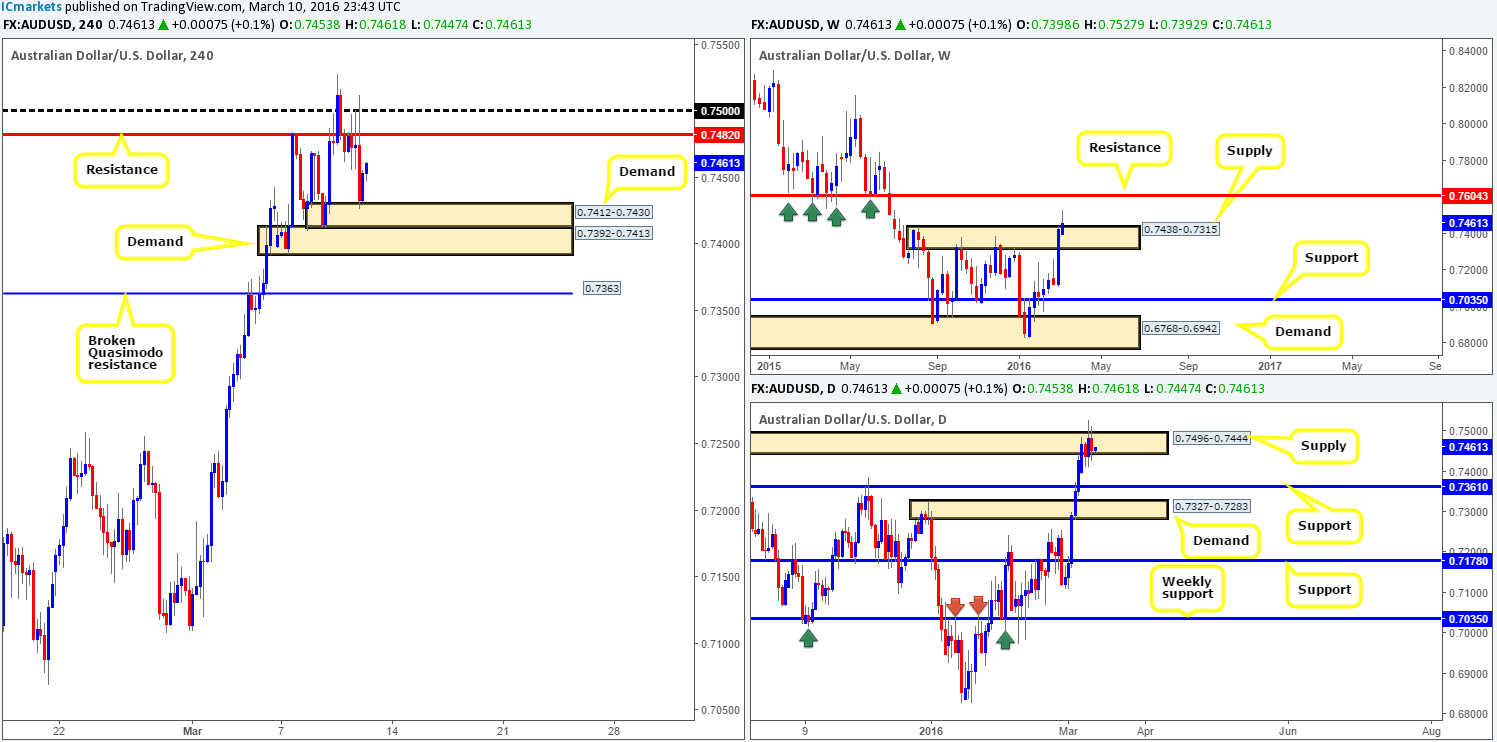
Reporting from the weekly chart this morning, the buyers and sellers continue to battle for position around the upper limit of supply seen at 0.7438-0.7315, and so far the sellers seem to have the upper hand. Looking down to the daily chart, however, we can see that this pair has been consolidating within supply at 0.7496-0.7444 since Tuesday with the balance of bids to offers here appearing even right now.
From the H4 chart, the commodity currency sold off going into yesterday’s U.S. session following a beautiful array of selling wicks printed around the underside of resistance at 0.7482, bringing this market to lows of 0.7426 by the day’s end. In view of price now trading from demand chalked up at 0.7412-0.7430 (upper base of stacked demand), and the aforementioned H4 resistance barrier lurking directly above (price effectively trading mid-range between the two areas at the moment), neither a long nor short seems attractive at this time. With that being the case and the fact that the higher-timeframe action is yet to show any definite direction, opting to stand on the sidelines here may very well be the best path to take today.
Levels to watch/live orders:
- Buys: Flat (Stop loss: N/A).
- Sells: Flat (Stop loss: N/A).
USD/JPY:
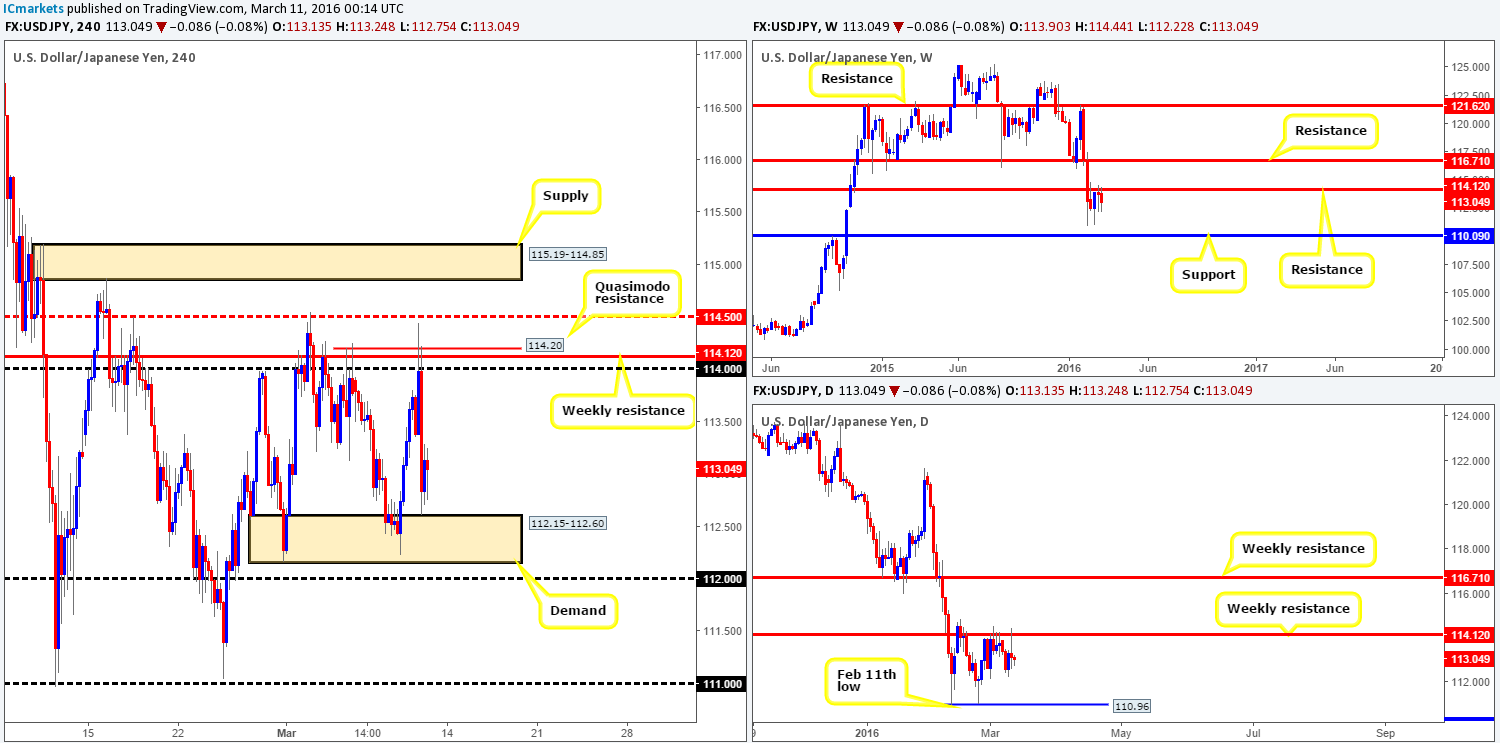
For those who read our previous report on the USD/JPY pair (http://www.icmarkets.com/blog/thursday-10th-march-volatility-expected-today-as-the-ecb-takes-center-stage/) you may recall us mentioning to watch for shorts around the weekly resistance line at 114.12. We personally did not take a trade from this level as the ECB press conference was in the spotlight at that time. However, well done to any of our readers who did manage to short from here, the risk/reward was very attractive.
At the time of writing, the H4 chart shows that demand at 112.15-112.60 has once again been brought back into view. Now, although this area has held price higher once already this week, we don’t feel comfortable buying from here due to both the weekly and daily charts showing room for this market to continue lower. The closest support structure below is seen on the daily chart around the 110.96 region (the Feb 11th low). Therefore, the best, and in our opinion, most logical setup to watch for today is a break below and retest of the 112.00 figure. This would, along with a lower timeframe sell setup, allow us to short this market down to the 111.00 region – essentially the daily support we just discussed above.
Levels to watch/live orders:
- Buys: Flat (Stop loss: N/A).
- Sells: Watch for price to consume the 112.00 level and look to trade any retest seen thereafter (lower timeframe confirmation required).
USD/CAD:
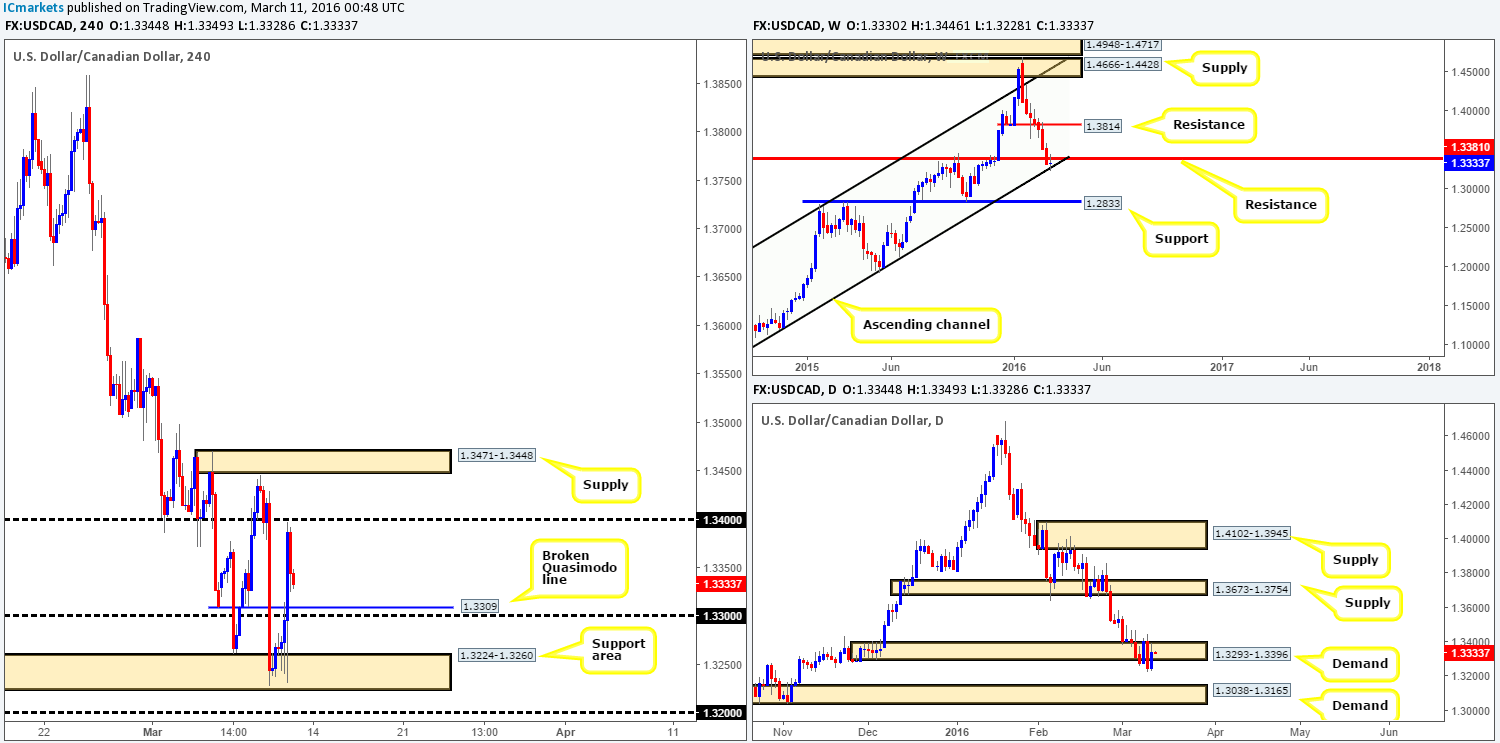
After the USD/CAD dropped to new lows and connected with a H4 support area at 1.3224-1.3260 on Wednesday, the Loonie aggressively pulled back yesterday, falling a few pips shy of the 1.3400 figure. Alongside this, Oil was and still is trading from a critical resistance level on the H4 drawn from 38.19 which likely assisted yesterday’s rally higher.
This pair, at least in our view, is a tricky beast to read at the moment! On the weekly chart, a clear-cut indecision candle is currently in the process of forming between an ascending channel support line extended from the low 1.0620 and resistance painted at 1.3381. Meanwhile down on the daily chart, demand at 1.3293-1.3396 has been struggling to hold this week, thus indicating further downside is possible towards demand seen at 1.3038-1.3165.
With the higher timeframes showing conflicting signals at the moment, it may be best to stick with looking for intraday bounces today. Here are the levels we currently have our eye on:
- H4 broken Quasimodo line at 1.3309/1.3300.
- 1.3400 figure.
- H4 supply at 1.3471-1.3448.
- H4 support area at 1.3224-1.3260.
Levels to watch/live orders:
- Buys: 1.3309/1.3300 [Tentative – confirmation required] (Stop loss: dependent on where one confirms this area). 1.3224-1.3260 [Tentative – confirmation required] (Stop loss: dependent on where one confirms this area).
- Sells: 1.3400 [Tentative – confirmation required] (Stop loss: dependent on where one confirms this level). 1.3471-1.3448 [Tentative – confirmation required] (Stop loss: dependent on where one confirms this area).
USD/CHF:
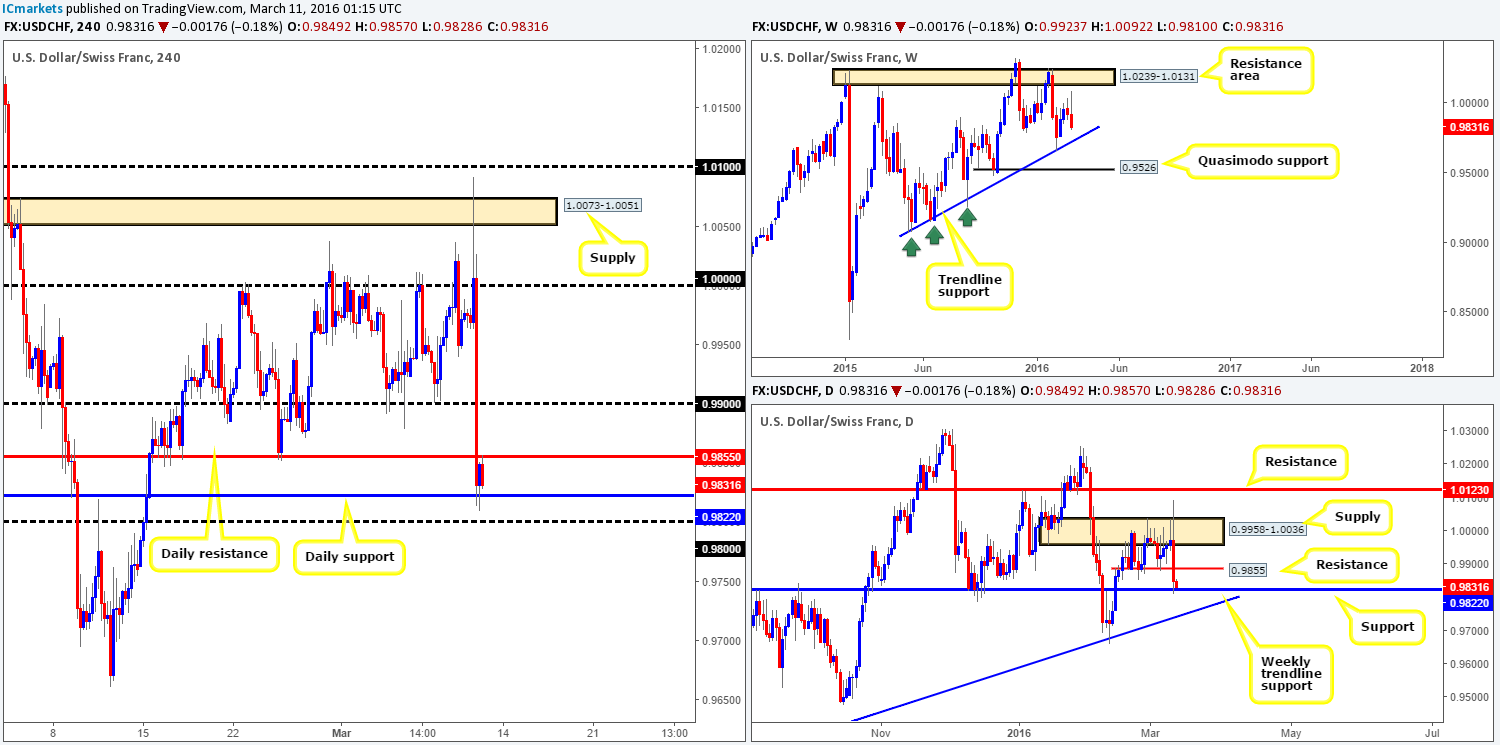
Similar to that of the EUR/USD, only in reverse, the USD/CHF jumped to highs of 1.0092 in yesterday’s trading (breaking H4 supply at 1.0073-1.0051) following the ECB’s decision to cut rates. Shortly after, however, Draghi added that he saw no need for further rate cuts from here which saw the pair reverse its recent gains and aggressively drop over 250 pips.
As we write, this unit is confined between a recently broken daily support (now resistance) at 0.9855 and a daily support drawn from 0.9822. From the daily chart, one can see that the current daily support hurdle has fantastic history so further upside from here would not be a surprise. Nevertheless, before we’d look to buy into this move, a close above the near-term daily resistance would need to take place first. One must also take into consideration that weekly action still shows room to move lower down to trendline support extended from the low 0.9071, potentially opening up the possibility that the daily support could give way.
Levels to watch/live orders:
- Buys: Watch for price to consume the 0.9855 level and look to trade any retest seen thereafter (lower timeframe confirmation required).
- Sells: Flat (Stop loss: N/A).
DOW 30:
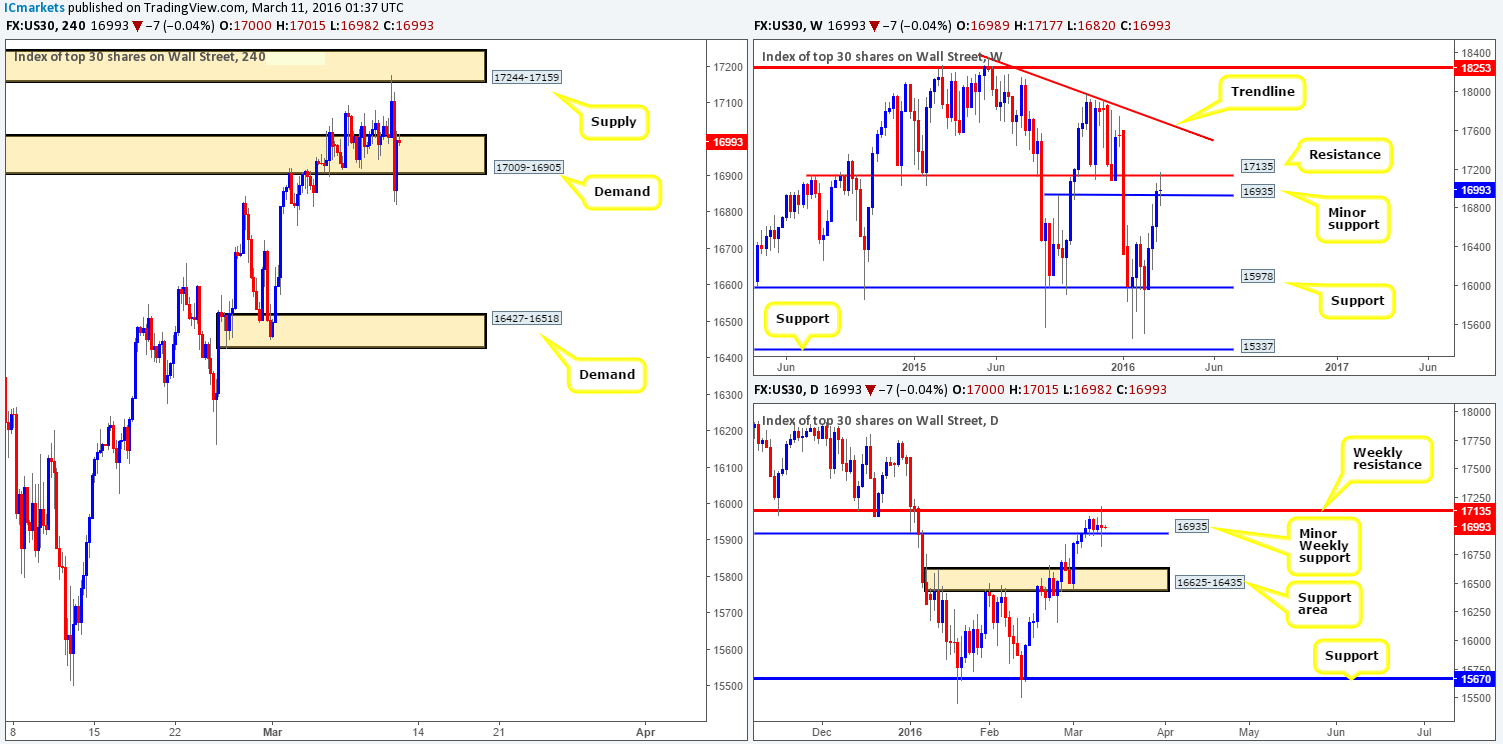
U.S. stocks closed relatively neutral yesterday despite the ECB firing off on all cylinders. The weekly chart is currently showing indecision as the bulls and bears cross swords between minor support at 16935 and resistance penciled in at 17135. In a similar fashion, the daily chart also printed a clear-cut indecision candle yesterday betwixt the two aforementioned weekly barriers.
Stepping across to the H4 chart, we can see that the supply area at 17244-17159 was brought into the action yesterday and, as expected, responded very well. Despite the small breach beyond demand at 17009-16905, the DOW remains capped between these two areas for now. And as such, until we see a decisive break, there is very little opportunity seen in this market to trade unless of course you go down into the lower timeframes and trade based on that structure.
Levels to watch/live orders:
- Buys: Flat (Stop loss: N/A).
- Sells: Flat (Stop loss: N/A).
XAU/USD: (Gold)
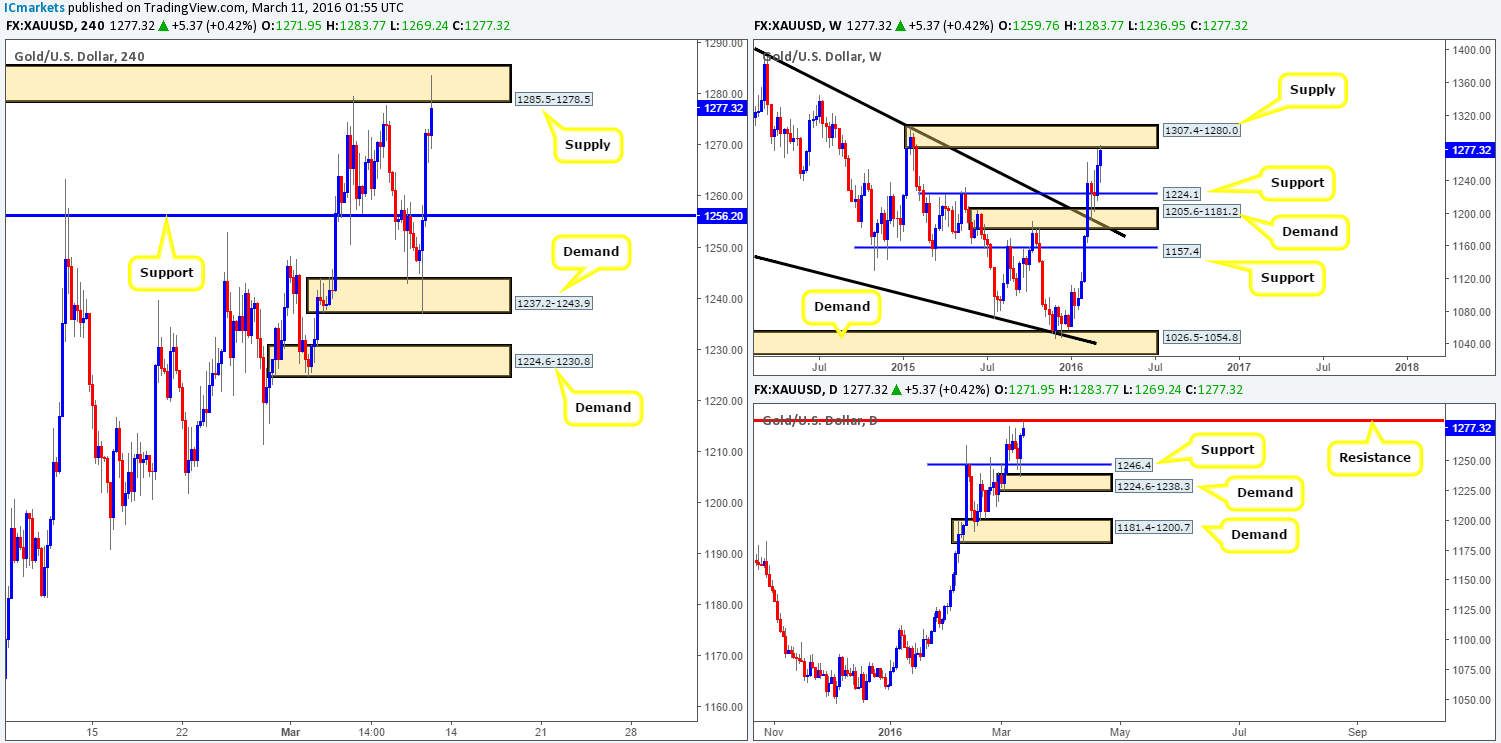
The yellow metal had a rather eventful session yesterday with the ECB announcing it will be cutting rates. Gold initially stabbed into the extremes of H4 demand coming in at 1237.2-1243.9 and then proceeded to rocket north, surpassing H4 resistance at 1256.2 and just recently connecting with H4 supply painted at 1285.5-1278.5.
Despite the aggressive rally north yesterday, price is now considered overbought in our opinion. Here’s why: Over on the weekly chart, it’s clear to see that price is now nibbling at the underside of a very strong-looking supply zone at 1307.4-1280.0. Not only this, but down on the daily chart this market is also responding to a clear resistance hurdle coming in at 1283.4.
Therefore, our plan of attack for this market today is relatively simple. Look for a lower timeframe sell setup (preferably between the M15 to M60) within the current H4 supply to jump in short, targeting H4 support at 1256.2 first and foremost.
Levels to watch/live orders:
- Buys: Flat (Stop loss: N/A).
- Sells: 1285.5-1278.5 [Tentative – confirmation required] (Stop loss: dependent on where one confirms this area).


