
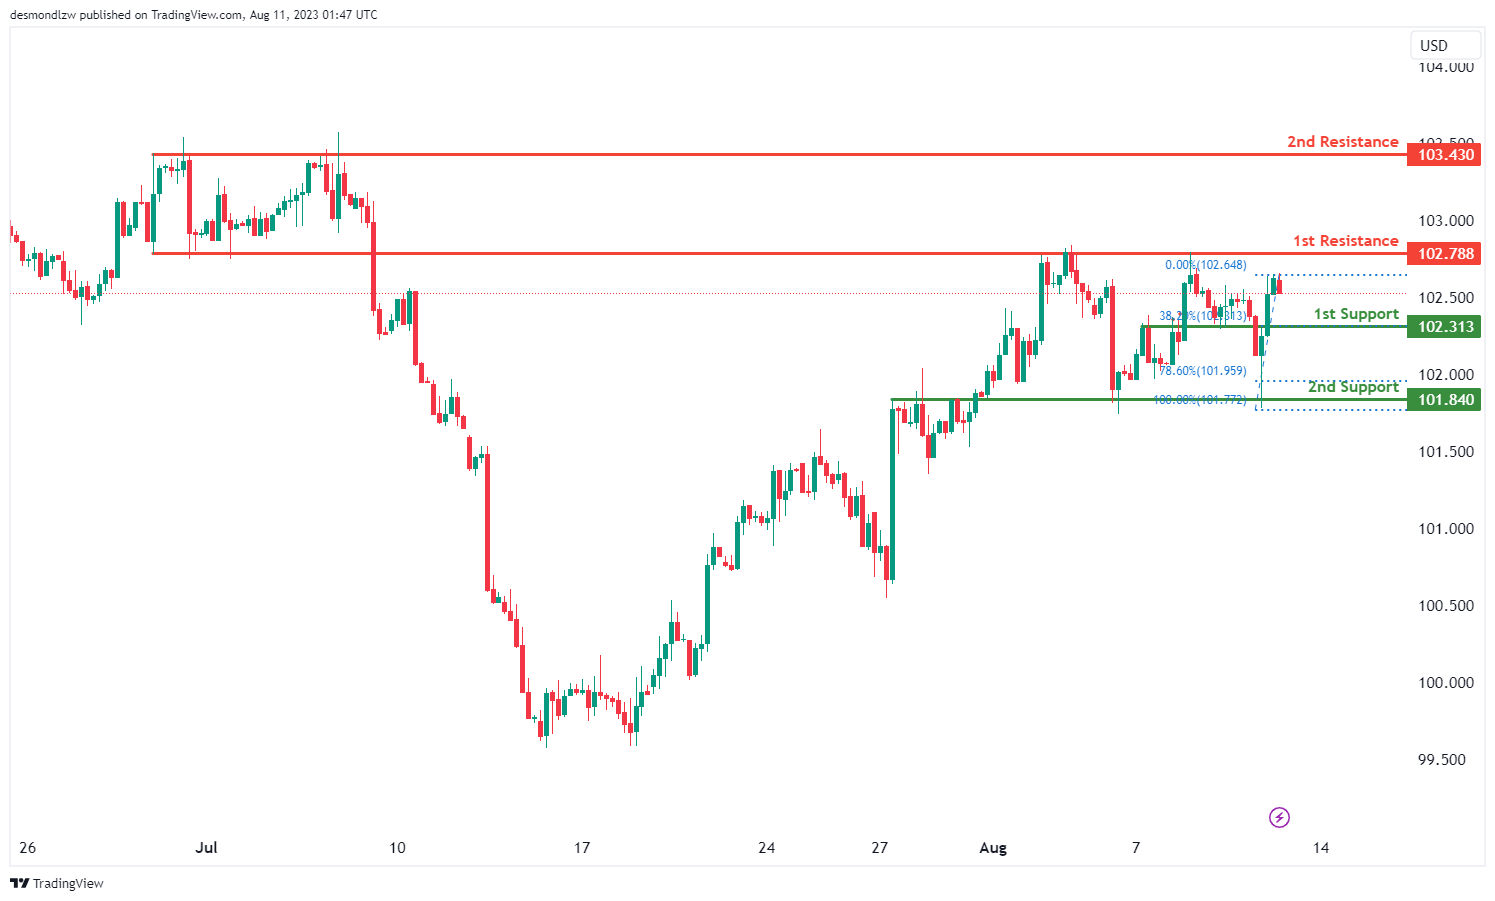
DXY:
The DXY chart currently demonstrates a bearish momentum, indicating a prevailing downward trend.
Within this context, there’s a potential for the price to sustain a bearish continuation towards the 1st support level at 102.31.
The significance of the 1st support is highlighted as a pullback support, coinciding with a 38.20% Fibonacci Retracement level.
Furthermore, reinforcement to the support structure is provided by secondary support at 101.84, identified as an overlap support, and aligning with a 78.60% Fibonacci Retracement.
Conversely, the 1st resistance level at 102.78 is notable as an overlap resistance.
Additionally, the presence of a 2nd resistance level at 103.43 is identified as a multi-swing high resistance, emphasizing its potential influence on potential price movement.
EUR/USD:
The EUR/USD chart is currently indicating a bullish momentum, suggesting a prevailing upward trend. This momentum is attributed to the price being positioned above a significant ascending trend line, indicating potential for further bullish movement. Additionally, the price is within the bearish Ichimoku cloud, a situation that often signals a potential reversal.
Given this context, there’s potential for a bullish continuation towards the 1st resistance level. The importance of the 1st support at 1.0959 lies in its identification as an overlap support. Similarly, a 2nd support at 1.0917 also holds significance as an overlap support.
On the other hand, the 1st resistance at 1.1040 is noted as an overlap resistance. Further reinforcing potential resistance, a 2nd resistance at 1.1094 is identified as a multi-swing high resistance, adding to its potential impact on price movement.

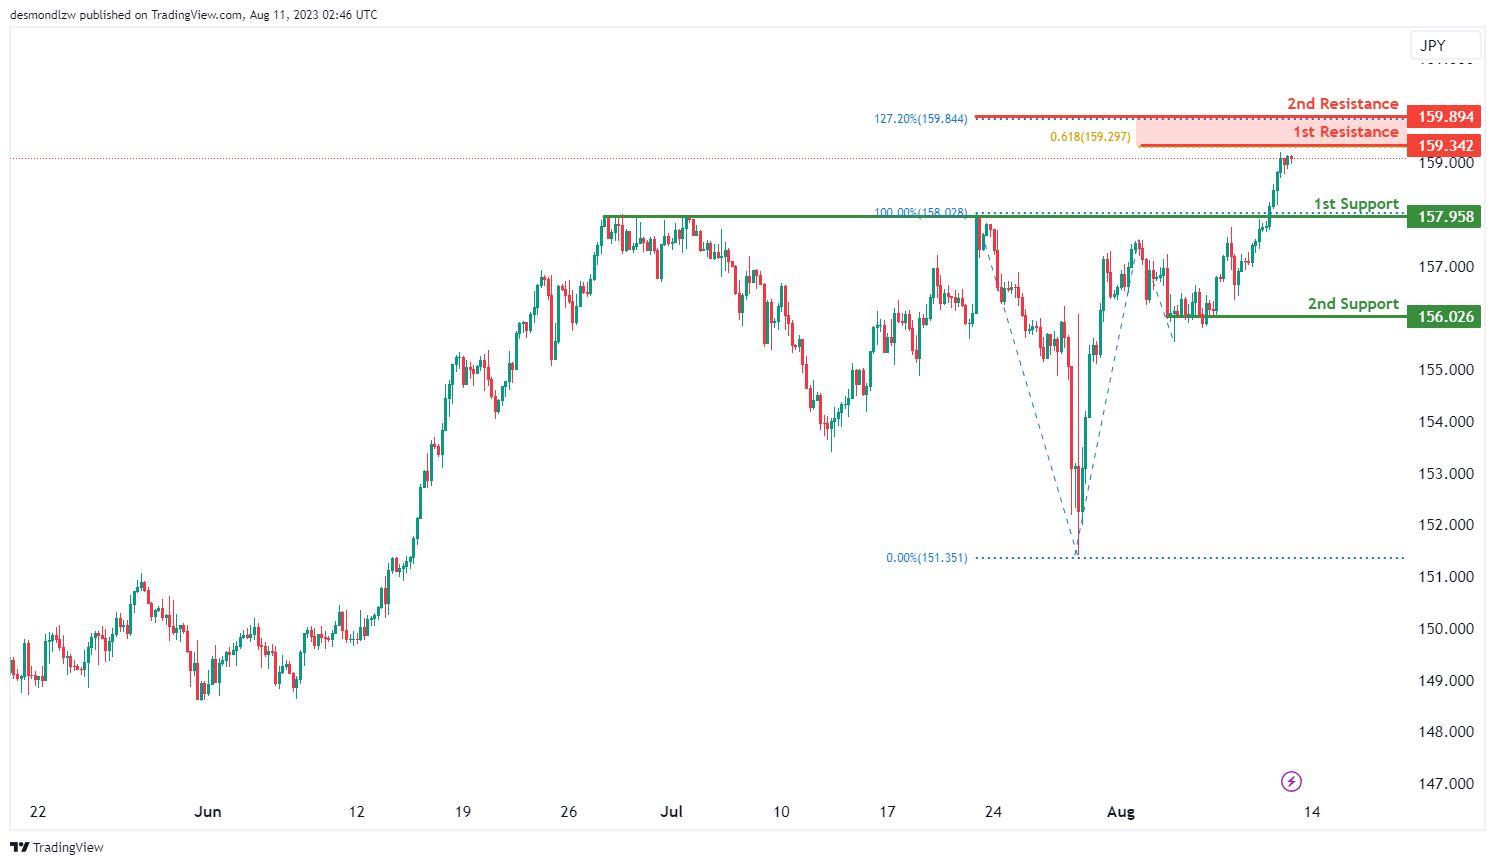
EUR/JPY:
The current trend on the EUR/JPY chart indicates a bullish momentum, suggesting a prevailing upward movement. Within this context, there’s a potential for the price to continue its bullish trend towards the resistance level.
The significance of the support at 157.95 is in its capacity as a pullback support, while the 2nd support at 156.02 is identified as a support level during multiple swing lows.
On the other hand, the resistance at 159.34 gains importance due to its association with a 61.80% Fibonacci Projection.
Further indication of potential resistance is provided by the presence of a 2nd resistance at 159.89, which aligns with a 127.20% Fibonacci Extension.
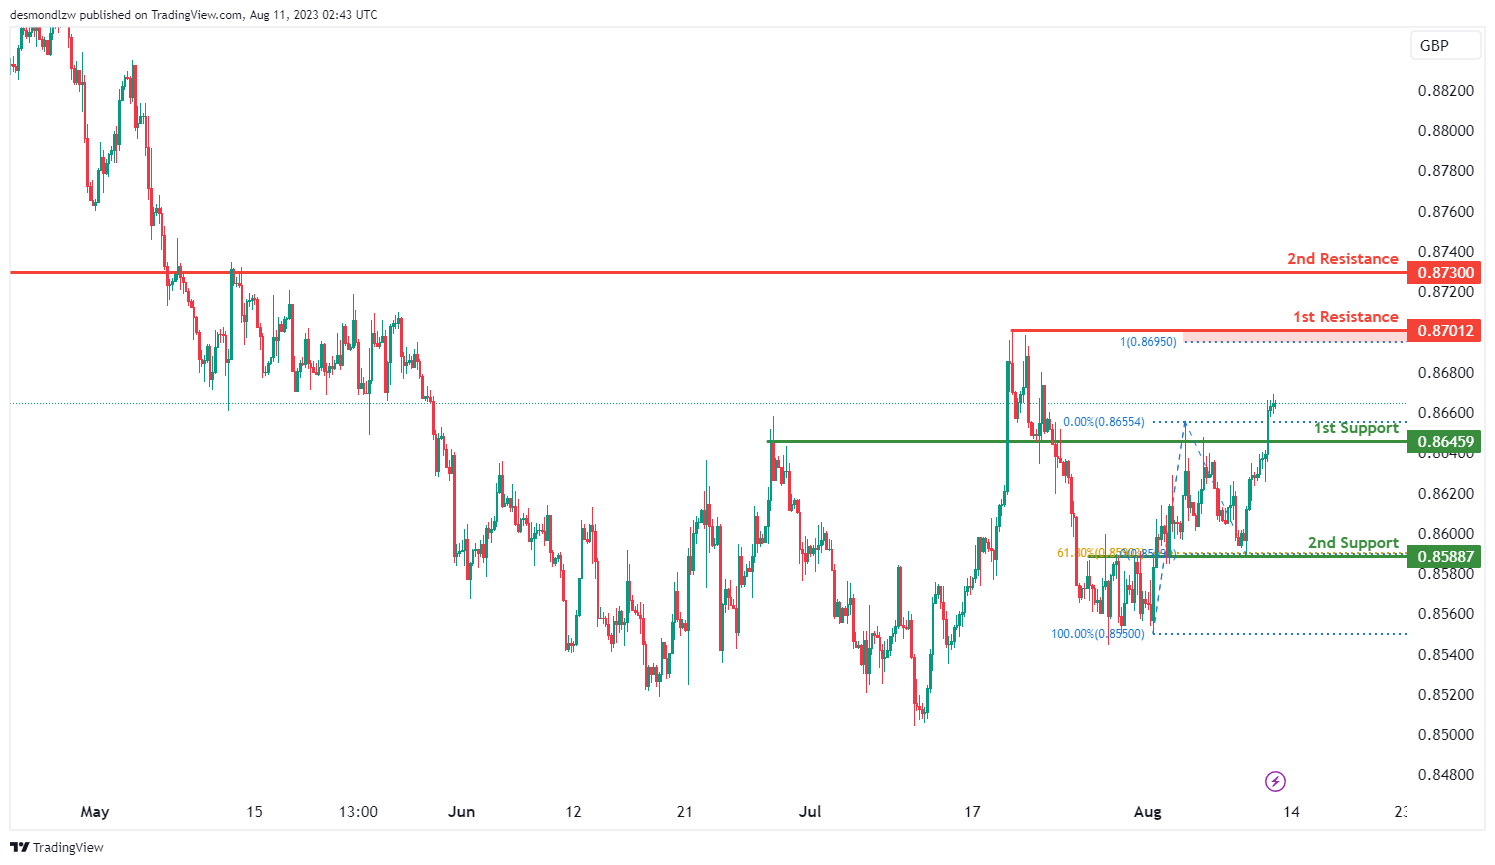
EUR/GBP:
The EUR/GBP chart currently indicates a bullish momentum, suggesting an ongoing upward trend. In light of this bullish sentiment, there is potential for the price to continue its bullish movement towards the resistance level.
The support level at 0.8645 is noted as a pullback support, and there is an additional 2nd support at 0.8588, identified as a pullback support aligned with a 61.80% Fibonacci Retracement.
Conversely, the resistance level at 0.8701 is significant as it acts as a swing high resistance with the reinforcement of a 100% Fibonacci Projection.
Further reinforcement for potential resistance is provided by a 2nd resistance level at 0.8730, characterized as a pullback resistance.
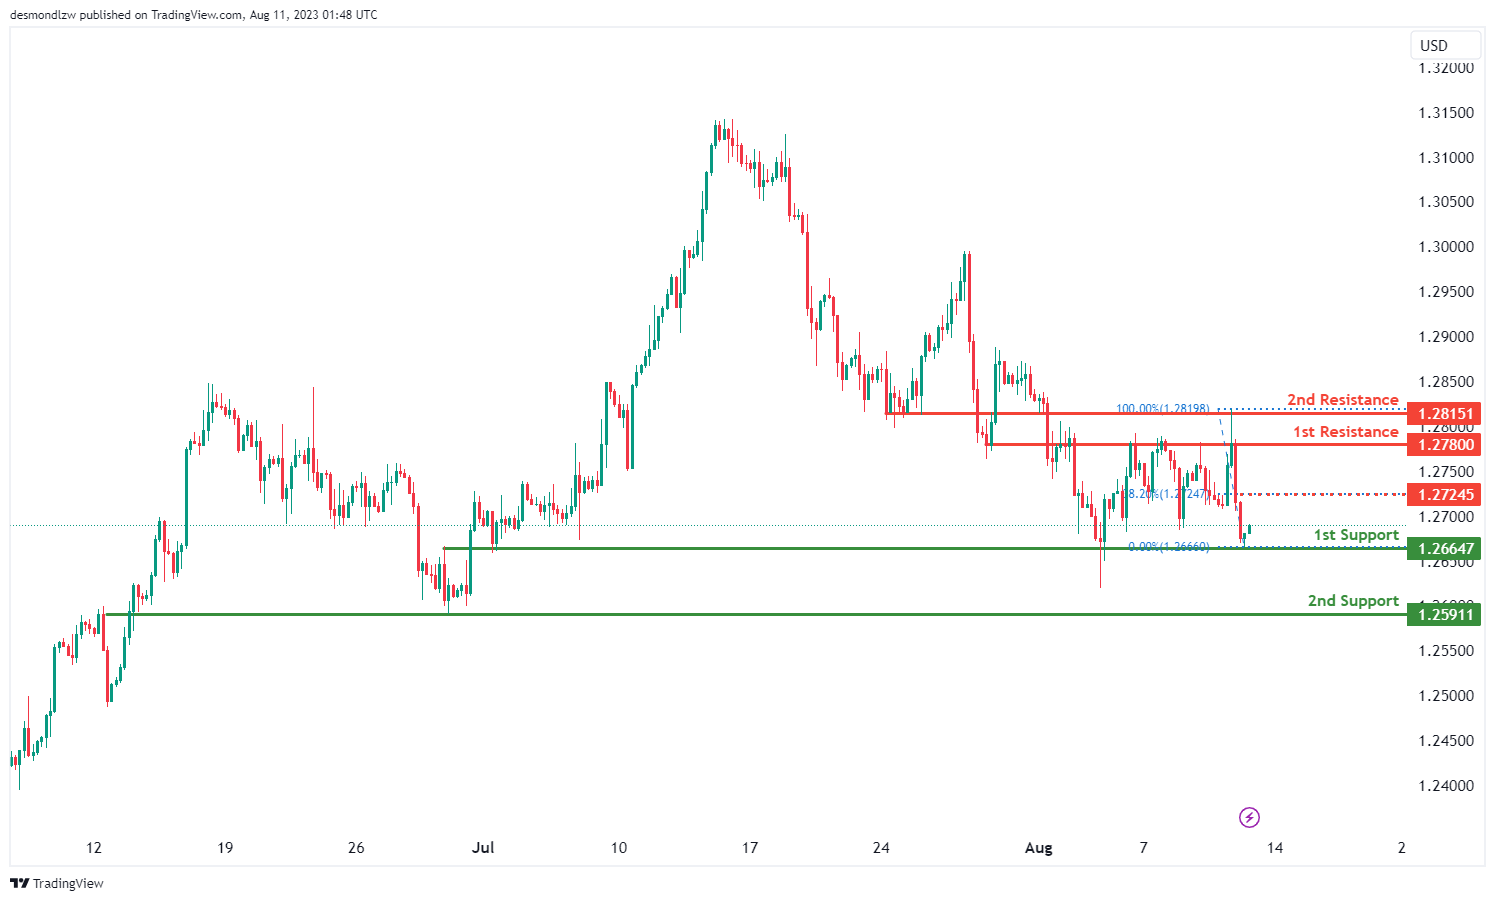
GBP/USD:
The GBP/USD chart currently demonstrates a bullish momentum, indicating a prevailing upward trend.
Given this momentum, there’s potential for a bullish continuation towards the 1st resistance level.
The significance of the 1st support at 1.2664 lies in its identification as an overlap support. Similarly, the 2nd support at 1.2591 also holds importance as an overlap support.
Conversely, the 1st resistance level at 1.2780 is noted as an overlap resistance. Further reinforcing potential resistance, a 2nd resistance at 1.2815 is identified as an overlap resistance.
Furthermore, an intermediate resistance at 1.2724 is highlighted due to its alignment with a 38.20% Fibonacci Retracement, adding to its potential as a resistance level.
GBP/JPY:
The current momentum of the GBP/JPY chart is bullish, indicating a predominant upward trend. This sentiment is supported by the fact that the price is currently trading above the bullish Ichimoku cloud.
In light of this bullish outlook, there is a potential opportunity for the price to continue its upward movement towards the resistance level at 183.89.
The support level at 183.21 holds importance as it serves as a pullback support, with additional reinforcement coming from a 2nd support level at 182.48.
Conversely, the resistance level at 183.89 is noteworthy as it is a multi-swing high resistance, which could potentially hinder further upward advancement.
The presence of a 2nd resistance level at 185.01, identified as a pullback resistance, adds further weight to the potential resistance areas on the chart.

USD/CHF:
The USD/CHF chart currently reflects a neutral momentum, suggesting an absence of a clear directional trend.
Within this context, there’s potential for the price to fluctuate between the 1st resistance and 1st support levels.
The 1st support at 0.8696 gains significance as an overlap support. Additionally, a 2nd support at 0.8627 is identified as a pullback support.
Conversely, the 1st resistance level at 0.8776 holds importance as a multi-swing high resistance. Further reinforcing potential resistance, a 2nd resistance at 0.8824 is categorized as a pullback resistance.

USD/JPY:
The USD/JPY chart currently presents a bearish momentum, signifying a prevailing downward trend.
In light of this momentum, there is a potential scenario where the price reacts bearishly upon reaching the 1st resistance level, resulting in a potential decline towards the 1st support.
The 1st support at 143.81 gains importance as it serves as an overlap support, further reinforced by a 38.20% Fibonacci Retracement. Similarly, the 2nd support at 142.78 is identified as an overlap support and aligns with a 61.80% Fibonacci Retracement.
On the opposing side, the 1st resistance level at 144.86 is of significance as a multi-swing high resistance. This level gains additional strength from its alignment with a 61.80% Fibonacci Projection and a 161.80% Fibonacci Extension, showcasing a notable Fibonacci confluence.

USD/CAD:
The current momentum of the USD/CAD chart indicates a bearish trend, suggesting a potential for further downward movement. In light of this bearish sentiment, there’s a possibility that the price could experience a bearish reaction off the 1st resistance before declining towards the 1st support level.
The 1st support at 1.3374 is notable due to its status as an overlap support and its alignment with significant Fibonacci levels, including the 38.20% Fibonacci retracement and 61.80% Fibonacci projection, indicating a confluence of Fibonacci levels. The 2nd support level at 1.3322 is recognized as a pullback support that also aligns with the 50.00% Fibonacci retracement level, acting as further support should price retreat lower.
Conversely, the 1st resistance level at 1.3449 is recognized as an overlap resistance. Further upward movement might be constrained by the presence of the 2nd resistance at 1.3502, characterized as a swing high resistance.

AUD/USD:
The current state of the AUD/USD chart indicates a neutral momentum, suggesting an absence of a clear directional trend. Given this neutral sentiment, it is possible for the price to experience fluctuations between the 1st resistance and 1st support levels.
The 1st support level at 0.6503 is supported by a pullback support and the 2nd support at 0.6463 is also recognized as a pullback support that is further reinforced by its alignment with the -27.20% Fibonacci expansion level.
To the upside, the 1st resistance level at 0.6585 is marked by a swing-high resistance that is aligned with the 78.60% Fibonacci projection level. An additional barrier of resistance is observed at the 2nd resistance level of 0.6605 which is identified as an overlap resistance.

NZD/USD
The current trend of the NZD/USD chart indicates a bearish momentum, implying a downward movement. In this context, there is potential for the price to continue its bearish movement, targeting the 1st support level.
The intermediate support level at 0.6007 is supported by a pullback support and the -27.20% Fibonacci expansion level. The 1st support level at 0.5992 is also significant as a swing low support.
To the upside, the 1st resistance level at 0.6036 is noteworthy as an overlap resistance. Furthermore, a 2nd resistance at 0.6067 is identified as an overlap resistance, acting as an additional barrier to upward price movement.

DJ30:
The current momentum of the DJ30 chart indicates a bearish direction, implying a prevailing downward trend.
In light of this bearish sentiment, the potential exists for the price to continue its bearish movement towards the support level at 35122.66, supported by multiple instances of swing low points. An additional support at 34953.11 is reinforced by pullback dynamics and a 38.20% Fibonacci retracement level.
On the flip side, the resistance at 35403.06 is notable for its overlap resistance and a 61.80% Fibonacci retracement level. Additionally, the presence of a 2nd resistance at 35693.87 gains importance due to its alignment with multiple instances of swing high resistance points.

GER30:
The GER30 chart currently displays a bullish momentum, suggesting an ongoing upward trend.
In line with this bullish sentiment, there is potential for the price to continue its bullish movement towards the resistance level.
The support level at 15833.90 holds significance as it is marked by both an overlap support and a 50% Fibonacci retracement level. Further reinforcing the support structure, a secondary support is identified at 15714.10, characterized by its alignment with a 78.60% Fibonacci retracement level.
On the other hand, the resistance level at 16003.03 gains importance as it is associated with a pullback resistance and a 38.20% Fibonacci retracement level. Additionally, a 2nd resistance level at 16240.68 is notable for its overlap resistance, further contributing to its potential impact on price movements.

US500
The US500 chart currently exhibits a bullish momentum, indicating an ongoing upward trend. Given this bullish sentiment, there is potential for the price to continue its bullish movement towards the resistance level.
The support level at 4456.6 is highlighted as a pullback support. Additionally, there is a secondary support at 4432.2, identified as an overlap support.
On the other hand, the resistance level at 4522.1 holds significance as a multi-swing high resistance, reinforced by a 100% Fibonacci Projection.
Furthermore, a 2nd resistance level at 4540.6 is identified as a pullback resistance, which adds to its potential impact on potential price movement.

BTC/USD:
The BTC/USD chart shows a bearish overall momentum. There is a potential for a bearish continuation towards the 1st support level.
The 1st support is positioned at 29277 and is considered advantageous due to its pullback support and a 61.80% Fibonacci retracement. Furthermore, the 2nd support at 28827 is also seen as a valuable level because of its multi-swing low support characteristics.
On the resistance side, the 1st resistance level at 29707 is considered noteworthy as it represents an overlap resistance. Additionally, the 2nd resistance at 30200 is significant due to its swing high resistance and a 50% Fibonacci retracement.

ETH/USD:
The ETH/USD chart indicates a bearish overall momentum. There is a potential for a bearish continuation towards the 1st support level.
The 1st support is located at 1816.05 and is considered favorable due to its overlap support and a 38.20% Fibonacci retracement. Additionally, the 2nd support at 1814.90 is also seen as a valuable level because of its multi-swing low support and a 78.60% Fibonacci retracement.
On the resistance side, the 1st resistance level at 1872.34 is noteworthy as it represents a multi-swing high resistance. Furthermore, the 2nd resistance at 1886.44 is considered significant due to its overlap resistance characteristics.

WTI/USD:
The current trend in the WTI/USD chart is bearish, indicating a downward movement in the market. With this bearish sentiment, there is potential for the price to continue its downward momentum towards the 1st support level should the ascending trendline be broken.
The 1st support level at 80.36 is significant due to its association with a pullback support and the 23.60% Fibonacci retracement level. Additionally, a 2nd support at 78.93 is identified as an overlap support.
To the upside, the 1st resistance level at 82.69 represents an overlap resistance.Furthermore, the presence of a 2nd resistance level at 84.52 represents an overlap resistance and that is is reinforced by the 161.80% Fibonacci extension level.

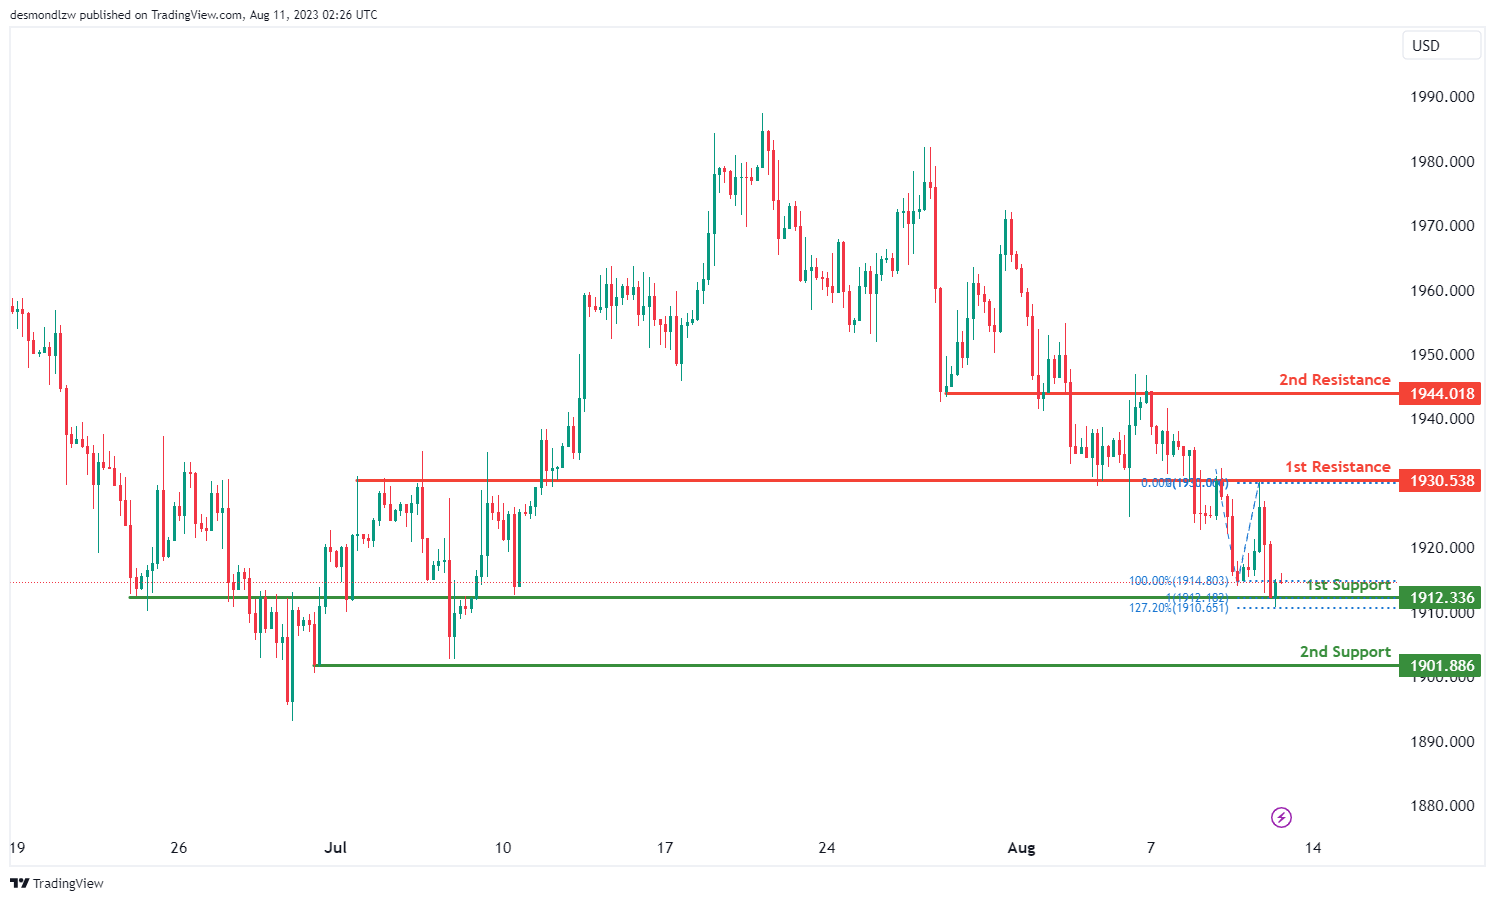
XAU/USD (GOLD):
The XAU/USD chart currently exhibits a bullish momentum, suggesting a prevailing upward trend. This momentum may lead to a potential bullish continuation towards the resistance level at 1930.53.
The support level located at 1912.33 is supported by both a 127.20% Fibonacci Extension and a 100% Fibonacci Projection, which adds to its significance as an overlap support. Additionally, a secondary support at 1901.88, identified as a swing low support, further reinforces the potential for a support zone.
Conversely, the resistance level at 1930.53 is important as it acts as an overlap resistance, possibly influencing future price movements. Furthermore, a 2nd resistance level at 1944.01, classified as an overlap resistance, could potentially contribute to resistance against upward movements.
The accuracy, completeness and timeliness of the information contained on this site cannot be guaranteed. IC Markets does not warranty, guarantee or make any representations, or assume any liability regarding financial results based on the use of the information in the site.
News, views, opinions, recommendations and other information obtained from sources outside of www.icmarkets.com, used in this site are believed to be reliable, but we cannot guarantee their accuracy or completeness. All such information is subject to change at any time without notice. IC Markets assumes no responsibility for the content of any linked site.
The fact that such links may exist does not indicate approval or endorsement of any material contained on any linked site. IC Markets is not liable for any harm caused by the transmission, through accessing the services or information on this site, of a computer virus, or other computer code or programming device that might be used to access, delete, damage, disable, disrupt or otherwise impede in any manner, the operation of the site or of any user’s software, hardware, data or property.


