
Key risk events today:
Canada Employment Change and Unemployment Rate; US Core PPI m/m and PPI m/m.
(Previous analysis as well as outside sources – italics).
EUR/USD:
The US dollar index staged a recovery Thursday, though it remains to be seen if price can sustain recovery momentum as bouts of risk-on counter moves.
On the data front, the latest unemployment claims came in better than expected. The US Department of Labour noted:
In the week ending July 4, the advance figure for seasonally adjusted initial claims was 1,314,000, a decrease of 99,000 from the previous week’s revised level. The previous week’s level was revised down by 14,000 from 1,427,000 to 1,413,000. The 4-week moving average was 1,437,250, a decrease of 63,000 from the previous week’s revised average. The previous week’s average was revised down by 3,500 from 1,503,750 to 1,500,250.
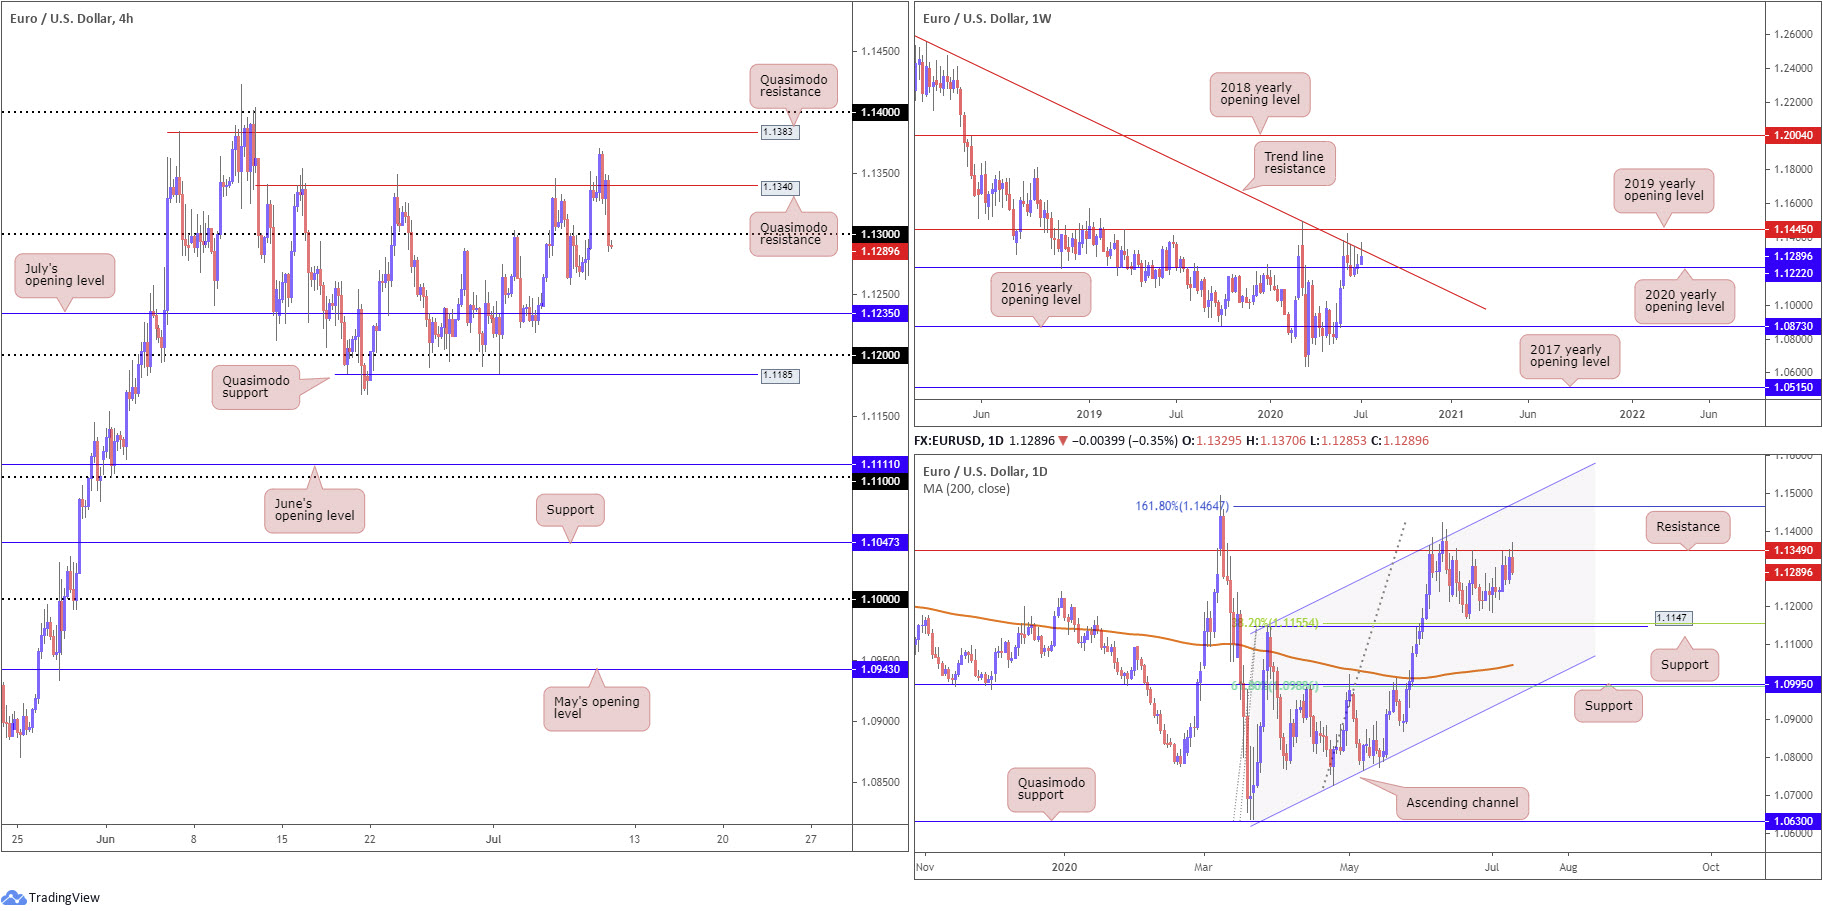
EUR/USD, based on the H4 timeframe, chalked up a two-candle fakeout through Quasimodo resistance at 1.1340, reaching highs at 1.1370, and headed marginally south of 1.13 into the European close. Further weakness at this point shines the spotlight on July’s opening level at 1.1235, with a break revealing the 1.12 handle.
Trade on the weekly timeframe remains contained between the 2020 yearly opening level at 1.1222 and long-standing trend line resistance, taken from the high 1.2555, with the latter making an appearance in recent trade. Further buying here shifts focus to the possibility of reaching the 2019 yearly opening level at 1.1445, while a dip to lower levels highlights the 2016 yearly opening level at 1.0873.
Since the beginning of June on the daily timeframe, resistance at 1.1349 has capped upside, a level brought back into play in recent movement. Breaking 1.1349 points to a 161.8% Fibonacci extension point at 1.1464, combined with channel resistance, extended from the high 1.1147. A decisive move south, on the other hand, assuming we overrun the 1.1168 June 22 low, has support from the 1.1147 27 March high in view, a level that merges closely with a 38.2% Fibonacci retracement ratio at 1.1155.
Areas of consideration:
H4 crossing through 1.13, alongside weekly price defending its trend line resistance and daily price flexing off resistance at 1.1349, advertises the possibility of additional selling today.
Breakout traders may already be short on the H4 close under 1.13; conservative traders, however, are likely eyeing a 1.13 retest as an entry point. Irrespective of the entry, July’s opening level at 1.1235 represents an initial downside target.
GBP/USD:
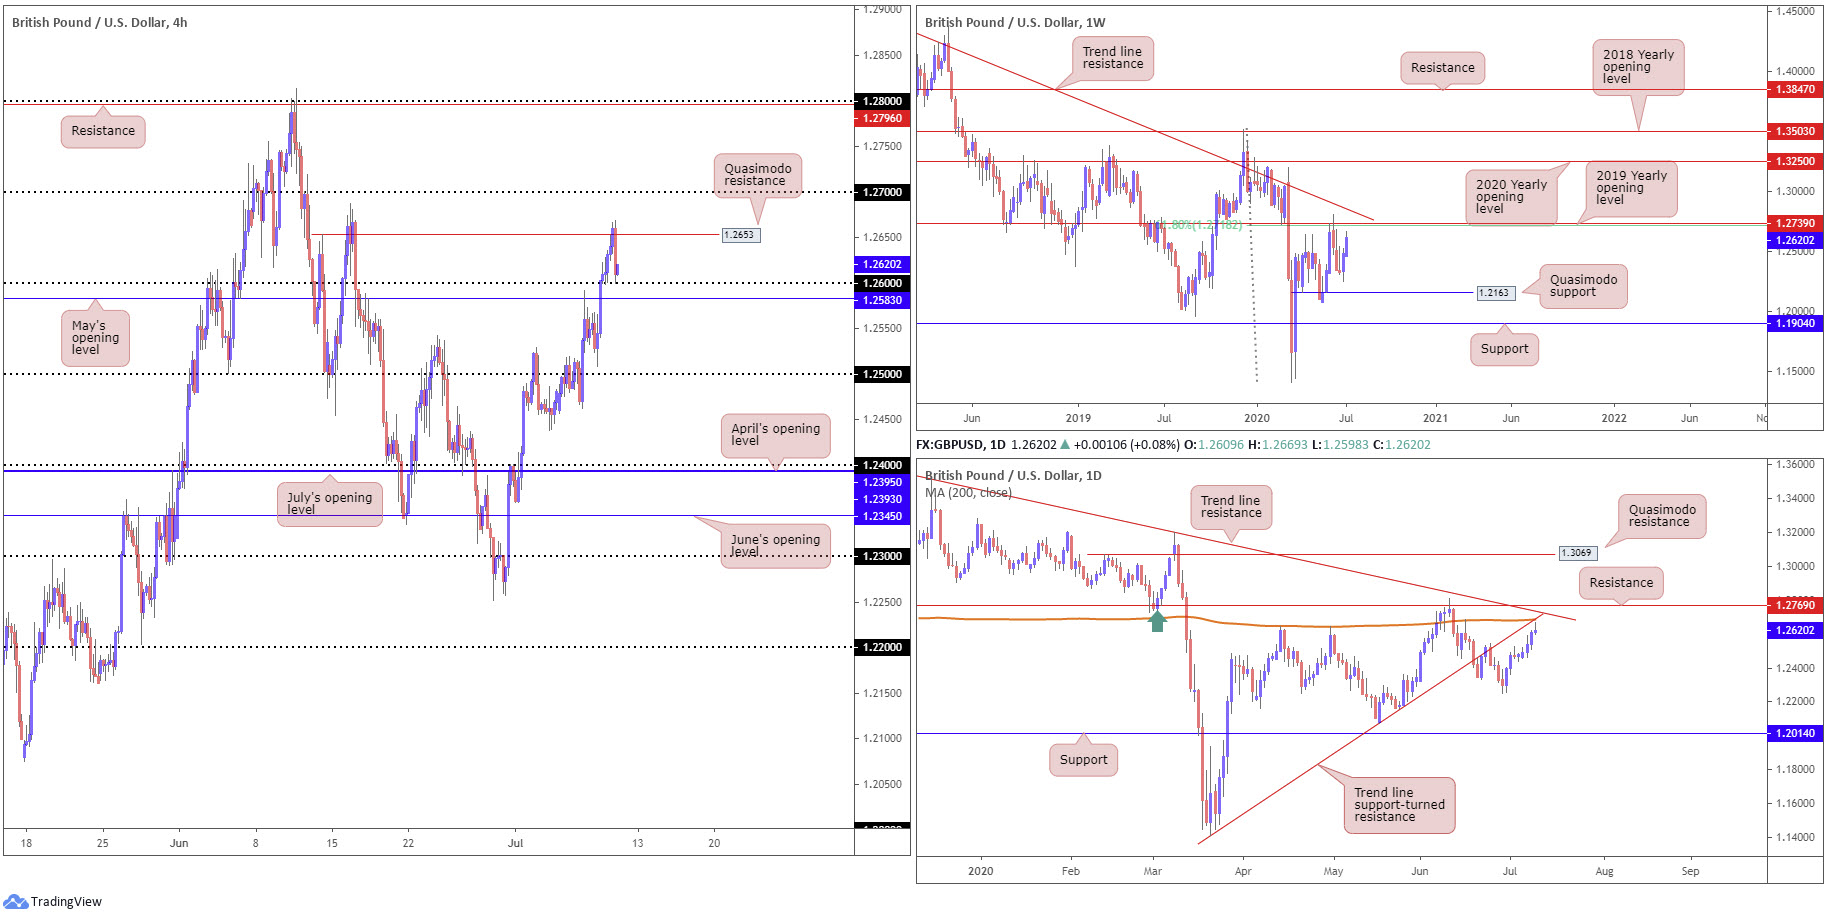
Pound sterling finished considerably off best levels Thursday, unable to weather DXY’s recovery momentum off lows at 96.24. H4 Quasimodo resistance at 1.2653 also played a role in holding back buyers, guiding the action to 1.26, a psychological level fixed just north of May’s opening level at 1.2583.
With respect to structure on the weekly timeframe, support resides at 1.2163, a Quasimodo formation. Follow-through buying, nevertheless, may eventually see price meet with a 61.8% Fibonacci retracement ratio at 1.2718 and 2019 yearly opening level at 1.2739.
Price movement on the daily timeframe, meanwhile, receded ahead of considerable resistance on the daily timeframe (trend line support-turned resistance, taken from the low 1.1409, another trend line resistance, taken from the high 1.3514, and the 200-day SMA [orange – 1.2687]). This combination is closely followed by resistance at 1.2769. Readers may also want to acknowledge yesterday’s candle produced a shooting star signal.
Areas of consideration:
For those who read Thursday’s technical briefing you may recall the following piece (italics):
The break of 1.26 will capture the attention of buyers on the H4 scale. This, alongside both weekly and daily timeframes suggesting territory north is clear until around the 1.27 handle (a point of robust resistance on the daily timeframe), will likely persuade breakout buyers to engage above 1.26 today, initially targeting H4 Quasimodo resistance at 1.2653, followed by 1.27.
As evident from the H4 chart, 1.2653 was achieved. Well done to any readers who managed to jump aboard.
Moving forward, the recent retest at 1.26 may still glean interest from buyers as we have yet to shake hands with the 1.27ish region (projected resistance on the daily timeframe).
AUD/USD:
Risk currencies weakened Thursday, as global equities fell and the safe-haven dollar latched onto a reasonably healthy bid.
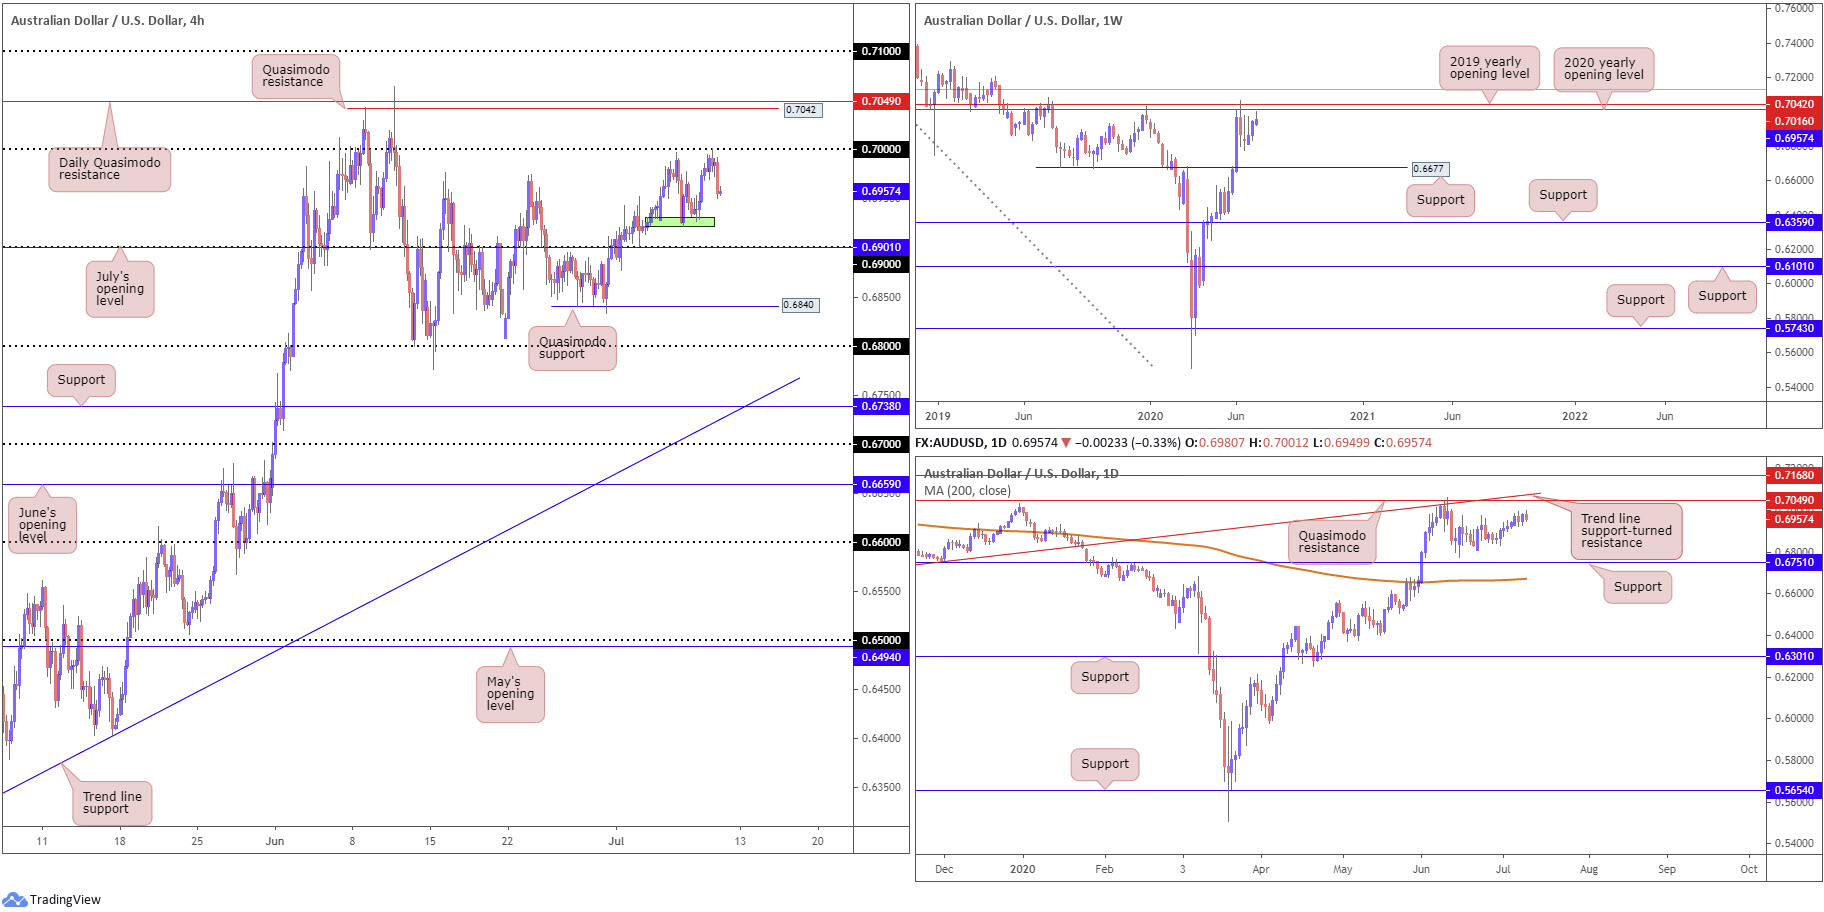
The key figure 0.70 made an appearance on the H4 timeframe, a widely watched level in this market, and directed AUD/USD to 0.6950. Local support is brewing nearby around 0.6930ish (green), which if violated will draw attention to the 0.69 handle and July’s opening level at 0.6901. Above 0.70, on the other hand, crosshairs are likely fixed on Quasimodo resistance at 0.7042, closely shadowed by daily Quasimodo resistance at 0.7049.
Note on the daily timeframe we also see the aforementioned Quasimodo merging with trend line support-turned resistance, taken from the low 0.6670. Attention on the daily timeframe also remains at support coming in from 0.6751.
Resistance, forged in the shape of a 2020 yearly opening level and a 2019 yearly opening level, at 0.7016 and 0.7042, respectively, continues to offer a central presence nearby on the weekly timeframe. It might also interest traders to note just above the said resistances we have a 61.8% Fibonacci retracement ratio at 0.7128 (green). In terms of support, crosshairs remain fixed on 0.6677.
Areas of consideration:
With the round number 0.70 sharing space with weekly resistance at 0.7016, the 2020 yearly opening level, it was not a surprise to see the noted round number hold as resistance yesterday. Sellers from this region are likely contemplating reducing risk to breakeven at 0.6950ish, with H4 eyes also on 0.6930 and 0.69 as additional downside objectives. Beyond here, price could potentially stretch as far south as H4 Quasimodo support at 0.6840.
USD/JPY:
USD/JPY prices enter Friday pretty much unmoved, as DXY recovery momentum failed to provide any meaningful impetus yesterday.
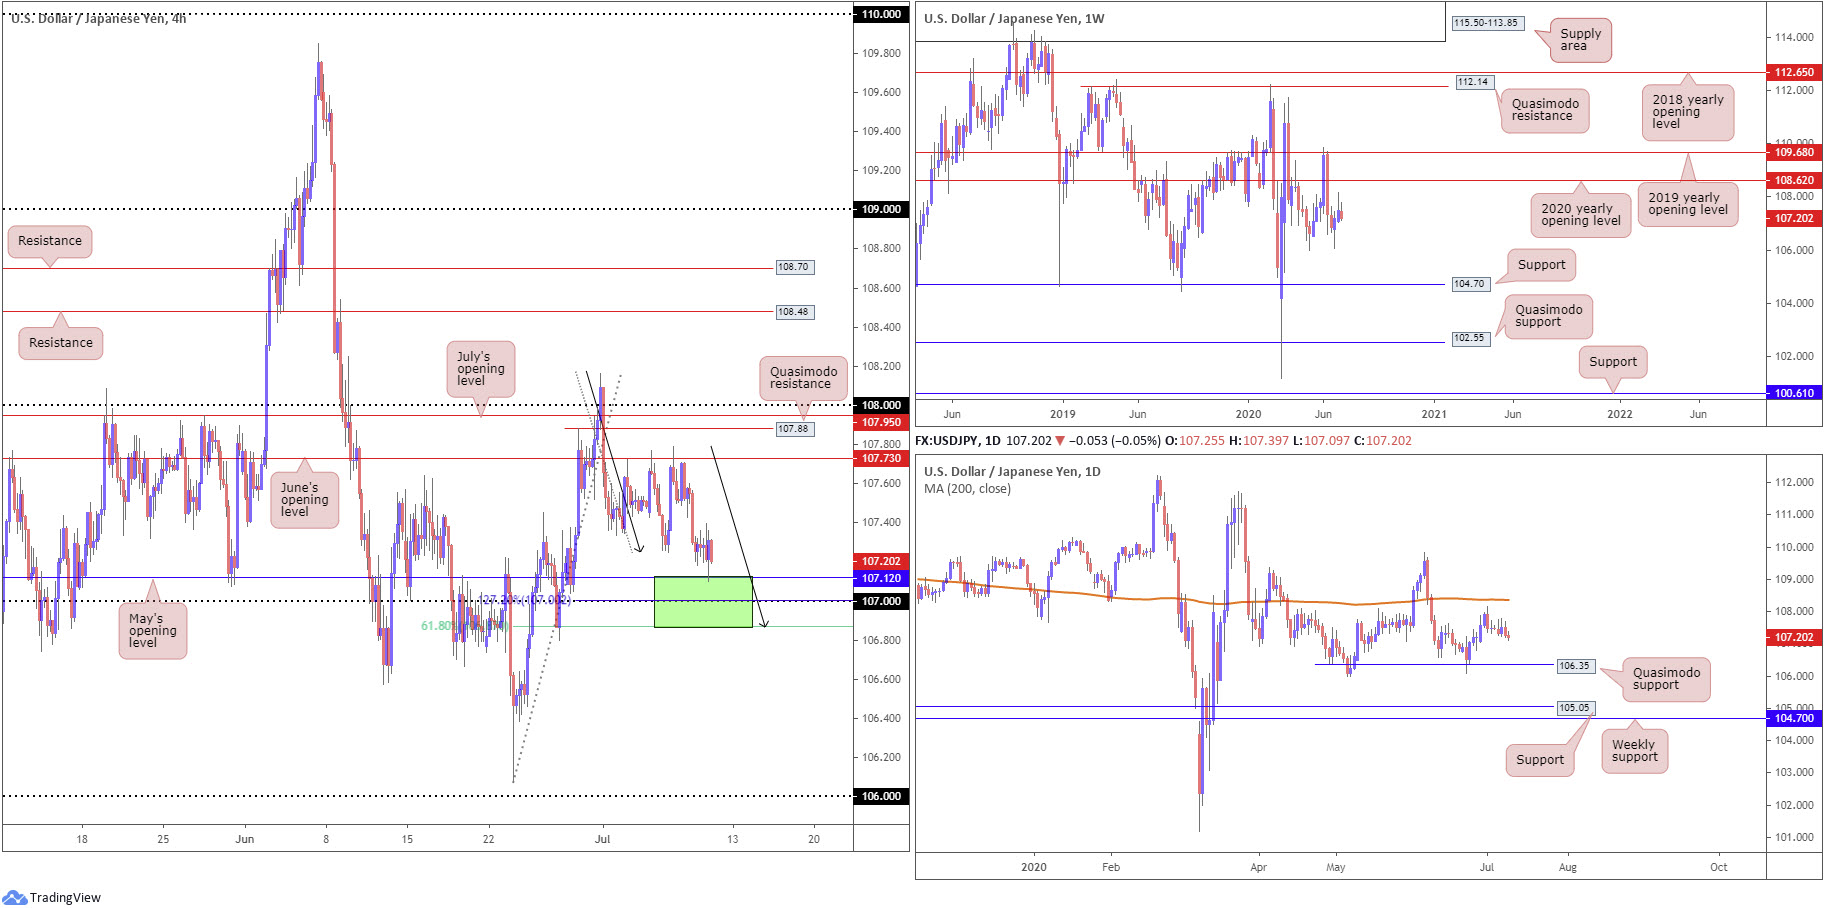
Technically, though, we did shake hands with the upper boundary of a H4 support area made up of May’s opening level at 107.12, the 107 handle, a 127.2% Fibonacci extension point at 107.00, a 61.8% Fibonacci retracement ratio at 106.87 (green) and an AB=CD bullish correction at 106.87 (black arrows).
Resistance rests reasonably close by on the weekly timeframe by way of the 2020 yearly opening level at 108.62, followed by the 2019 yearly opening level at 109.68. Support remains fixed around the 105.98 6th May low, with a break uncovering long-term support at 104.70.
Last week on the daily timeframe, price action pencilled in a top a few pips shy of the 200-day SMA (orange – 108.36), shaped by way of a bearish outside day. The recent top (and candle formation), given the indecisive movement witnessed since, draws attention back to Quasimodo support at 106.35, the origin of the recent leg higher.
Areas of consideration:
The 106.87/107.12 support area on the H4 timeframe has clearly aroused the interest of buyers. Whether this will be enough to attract further buying today is difficult to judge as the H4 base lacks higher-timeframe convergence.
Equally possible is a dive into the 107 region, or even the H4 AB=CD formation at 106.87, before additional buyers step in.
On account of the above, buyers will likely seek confirmation before engaging, such as a bullish candlestick signal, with an initial target set at June’s opening level from 107.73.
USD/CAD:
For traders who read Thursday’s technical piece you may recall the following notes (italics):
1.35, based on the H4, is an interesting level today. Not only does it come with a H4 Quasimodo support (red arrow), it also brings with it a 200-day SMA at 1.3499 and daily wedge support. This confluence may be enough to stir buyers and draw to higher levels today, targeting July’s opening level at 1.3574 as an initial port of call.
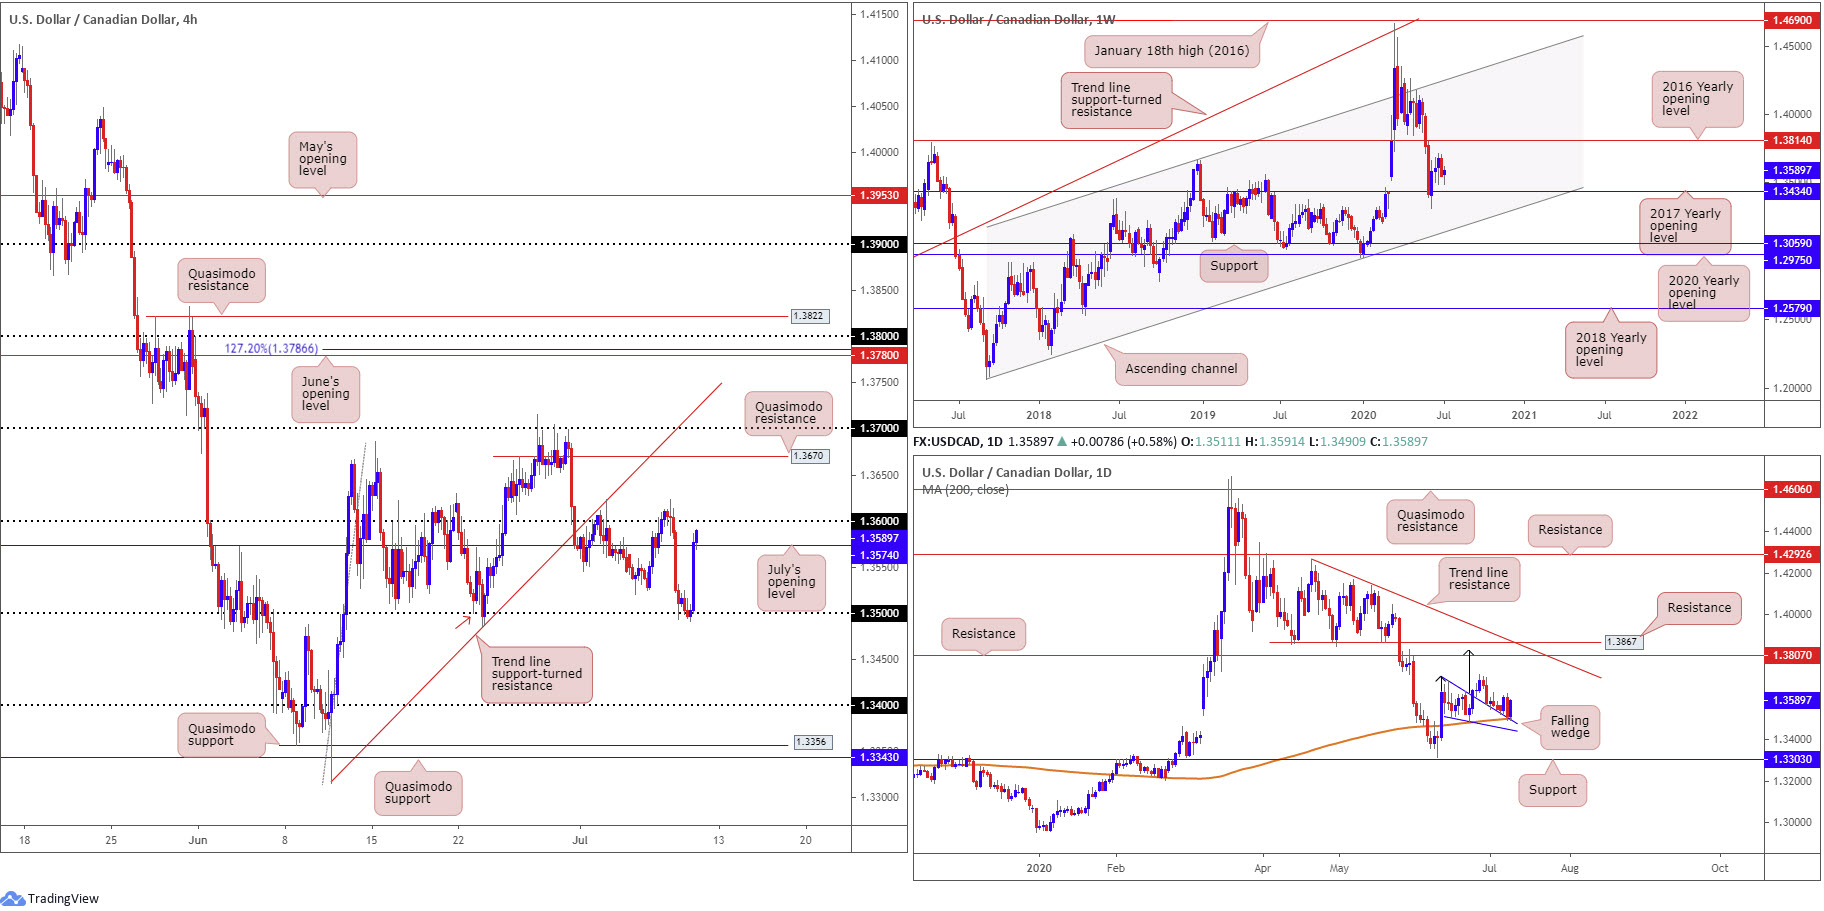
Thursday had the DXY outperform against major counterparts off lows at 96.24, together with WTI tumbling through $40.00/bbl, consequently lifting USD/CAD strongly off 1.35. H4 price recently overthrew July’s opening level at 1.3574 and is currently within striking distance of 1.36, as we write. Beyond the latter, H4 Quasimodo resistance at 1.3670 is seen as the next upside hurdle.
Technical action on the daily timeframe witnessed a recovery from the breached falling wedge pattern as a support (1.3686/1.3504), merging with the 200-day SMA (1.3501). Take-profit targets out of a falling wedge pattern can be measured by taking the base value and adding this figure to the breakout point (black arrows), which as you can see in this case, converges closely with the next daily resistance at 1.3807, followed closely by another layer of resistance at 1.3867.
On the weekly timeframe, action is hovering north of the 2017 yearly opening level at 1.3434. Beyond 1.3434, channel support, taken from the low 1.2061, can be seen as the next potential floor. A USD/CAD bid, on the other hand, throws the 2016 yearly opening level at 1.3814 in the pot as feasible resistance, with follow-through buying likely to try and tackle a dense block of supply between 1.4190/1.3912.
Areas of consideration:
Well done to any readers who managed to jump aboard the latest leg higher, as 1.35 was a noted base of support to watch.
Going forward, traders likely have 1.36 in the crosshairs today. A H4 close above the aforementioned level, in light of where we’re coming from on the daily timeframe, may see traders seek bullish scenarios towards H4 Quasimodo resistance mentioned above at 1.3670.
USD/CHF:
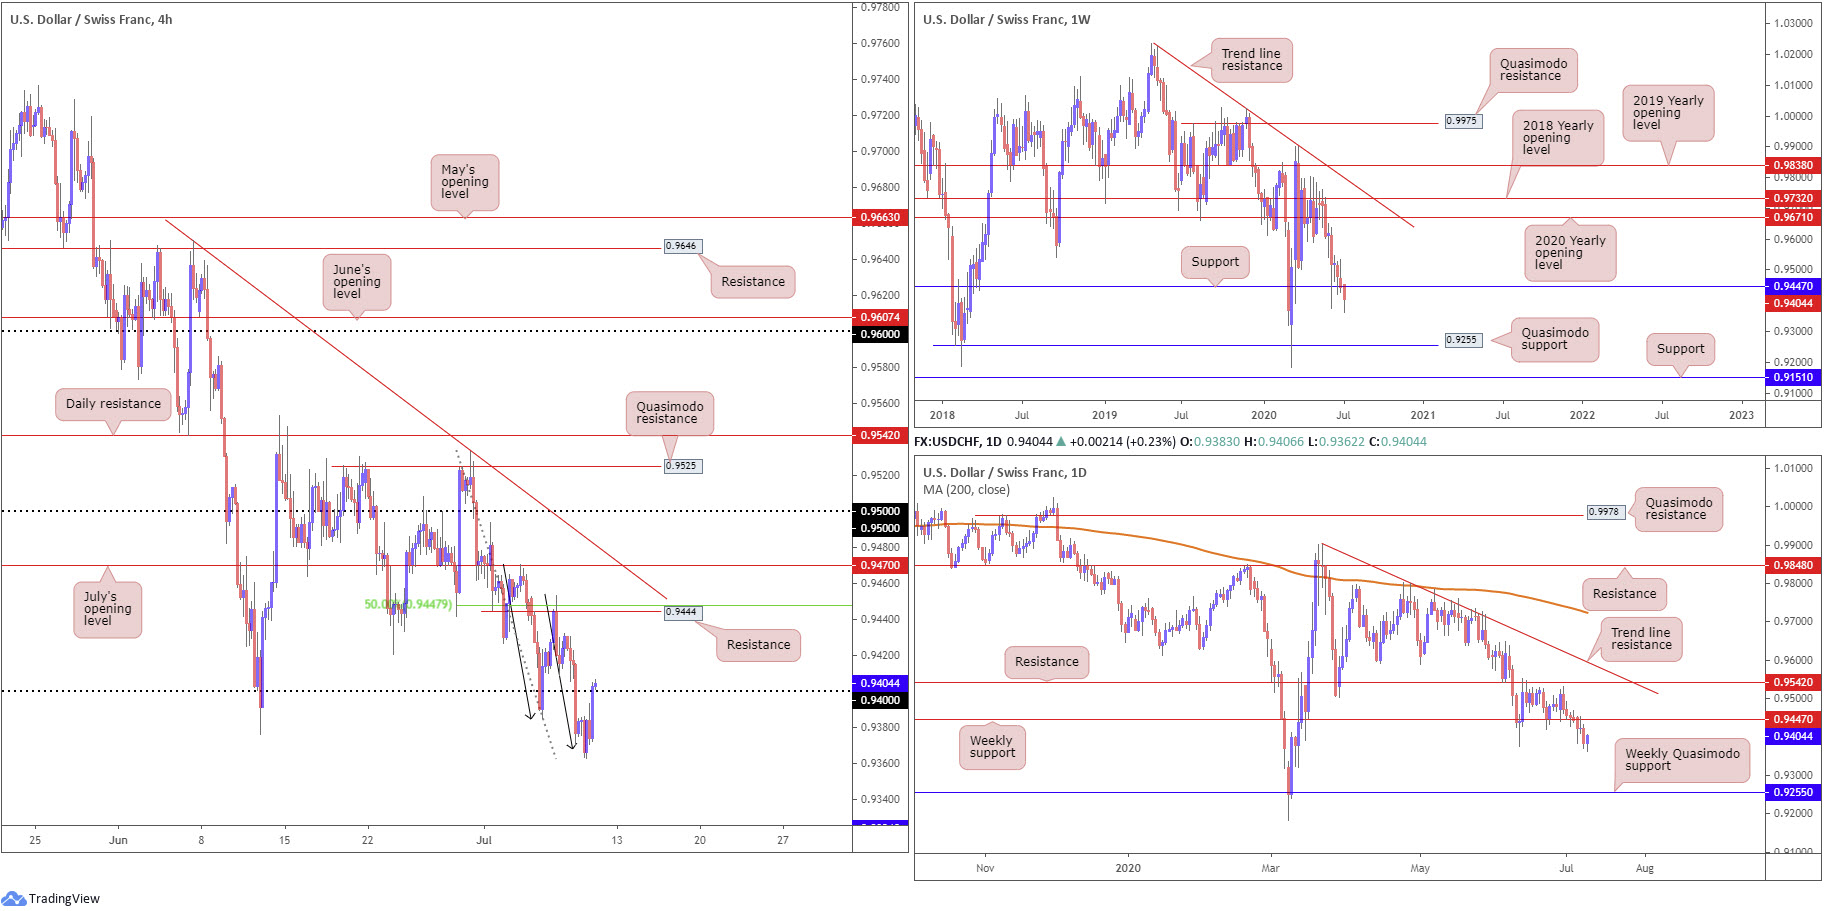
Amid broad dollar strength, USD/CHF made a comeback off 0.9362 Thursday, marginally easing above 0.94 in recent hours. It appears buyers made use of the recently completed H4 ABCD formation (black arrows) at 0.9367.
Assuming buyers uphold their position north of 0.94 today, familiar H4 resistance at 0.9444 may very well make an appearance, aligning closely with the 50.00% retracement ratio at 0.9447.
Meanwhile, on the higher timeframes, the week has so far observed support on the weekly chart break down at 0.9447. This, on both weekly and daily timeframes, has thrown a weekly Quasimodo formation in the pot as possible support at 0.9255.
Areas of consideration:
Having H4 attempting to establish a presence above 0.94 may seduce intraday buyers today. This is a precarious situation, as not only does the immediate trend point southbound, the higher timeframes exhibit scope to stretch as far south as 0.9255.
As a result, buyers above 0.94 may find thin air. This may see a H4 close back beneath 0.94, igniting seller intent, fuelled on buy-stop liquidity (stops taken from the break of 0.94).
Dow Jones Industrial Average:
US stocks finished mostly lower Thursday as virus fears clouded optimistic US data. The Dow Jones Industrial Average dropped 361.19 points, or 1.39%; the S&P 500 dipped 17.89 points, or 0.56%, while the tech-heavy Nasdaq 100 concluded higher by 97.94 points, or 0.92%.
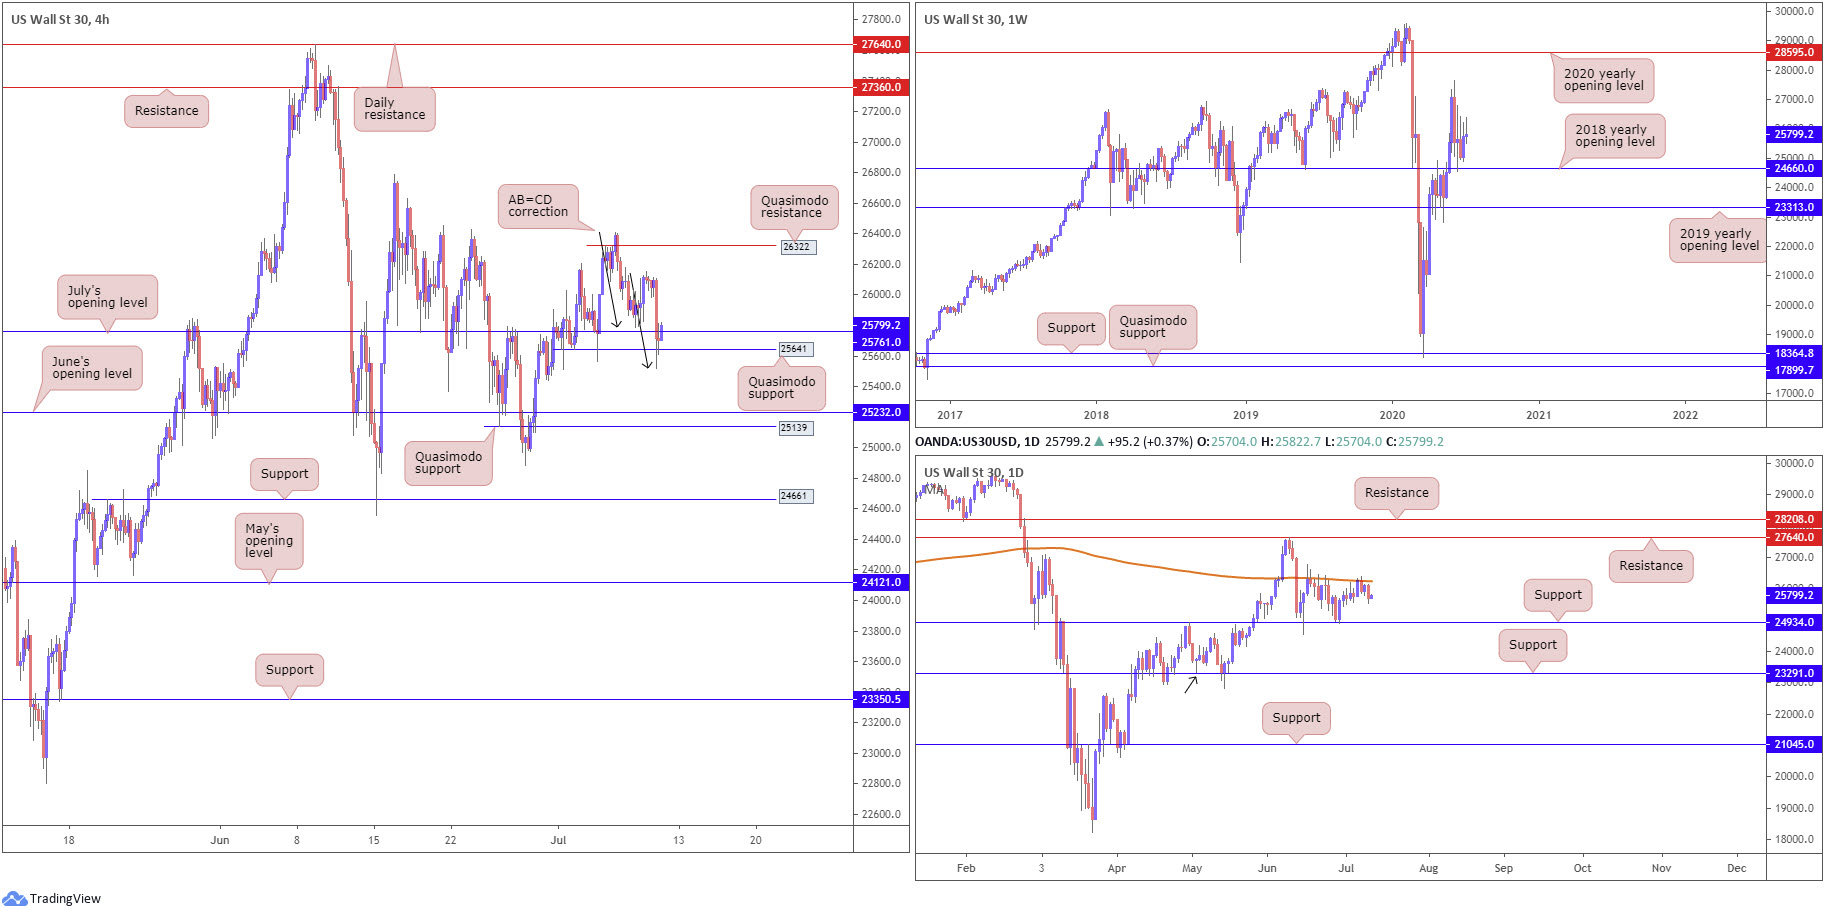
Although the DJIA tumbled yesterday, price action on the H4 timeframe appears to be finding a footing off AB=CD support (black arrows) at 25518 and Quasimodo support at 25641. As of writing, the current H4 candle is attempting to reclaim July’s opening level at 25761. A decisive close above the aforementioned level could stoke buyer interest, perhaps enough to see H4 action re-join peaks around 26107.
The 2018 yearly opening level at 24660 remains an important base of support on the weekly timeframe. In the event buyers manage to keep their head above water here, we might pull in the 27638 high, followed by the 2020 yearly opening level at 28595.
Since June 15, price action on the daily timeframe has been ranging between the 200-day SMA (orange – 26241) and support from 24934. As evident from the chart, the aforementioned SMA remains in the spotlight for the time being. A break of this barrier not only confirms upside strength on the weekly timeframe, it shines the spotlight on daily resistance from 27640.
Areas of consideration:
As emphasised above, a decisive H4 close above 25761 will likely stir buyers today, targeting 26107 as an initial take-profit zone, followed by the 200-day SMA at 26241 and then H4 Quasimodo resistance at 26322.
In addition, it’s worth remembering a daily close above the 200-day SMA also sends across a concrete bullish indication, with room to press as far north as daily resistance at 27640.
XAU/USD (GOLD):
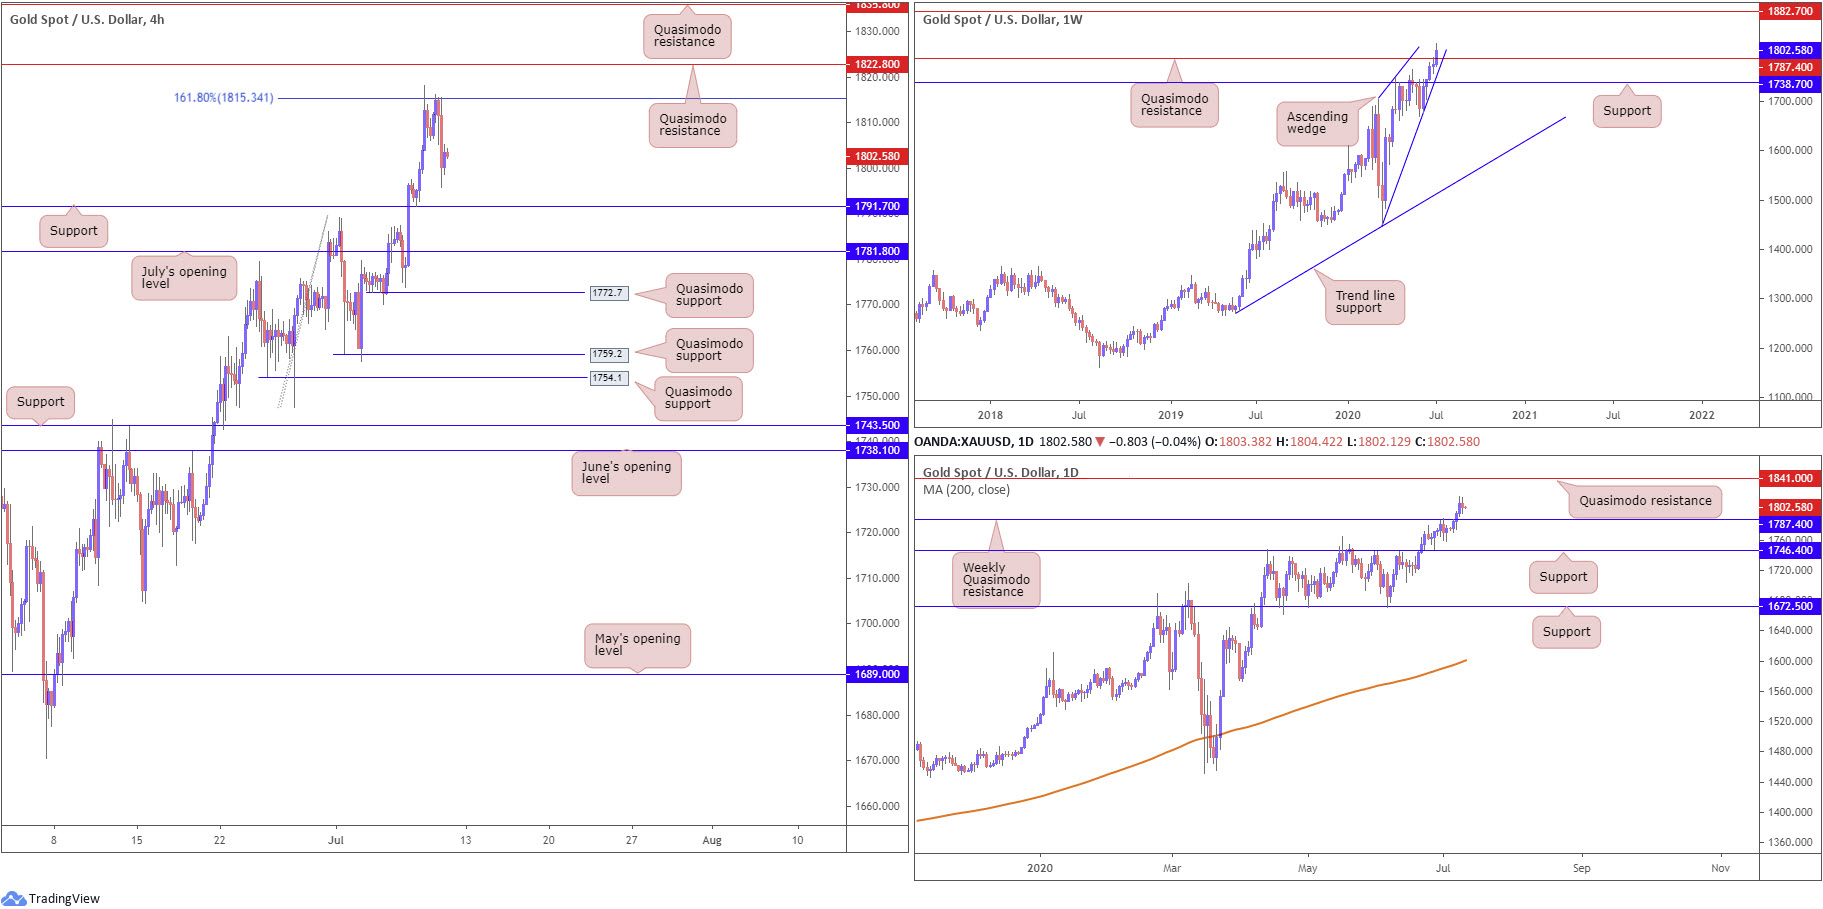
XAU/USD dipped Thursday, snapping a three-day bullish phase and gliding to lows at 1795.7 on the back of a DXY recovery amid fading risk sentiment.
The 161.8% Fibonacci extension point at 1815.3 on the H4 timeframe, as you can see, held back buyers in recent trade, placing support at 1791.7 in the spotlight. Absorbing 1815.3, however, throws Quasimodo resistance at 1822.8 in the pot, followed by another layer of Quasimodo resistance at 1835.8.
Despite the recent turn lower, the technical picture on the higher timeframes still suggest further upside could be on the cards.
From the weekly chart, we can see price action nudged above Quasimodo resistance at 1787.4. Breaking 1787.4, as the underlying trend suggested (trending higher since 2016), has laid the foundation for continuation buying to resistance stationed at 1882.7. Also of interest on the weekly timeframe is a potential ascending wedge pattern forming between 1451.4/1703.2.
Clearing weekly Quasimodo resistance at 1787.4 on the daily timeframe also swings the pendulum in favour of a run to daily Quasimodo resistance at 1841.0.
Areas of consideration:
Noting both weekly and daily timeframes display room to extend gains north of weekly Quasimodo resistance at 1787.4, few traders will have the courage to short this market right now.
H4 traders may explore bullish scenarios off H4 support at 1791.7, should the base enter the fight. Yet, conservative traders could pursue additional confirmation before taking action here, in order to help avoid a fakeout. Near-term targets from the aforementioned support are fixed at the 161.8% H4 Fibonacci extension point from 1815.3 and H4 Quasimodo resistance at 1822.8.
The accuracy, completeness and timeliness of the information contained on this site cannot be guaranteed. IC Markets does not warranty, guarantee or make any representations, or assume any liability regarding financial results based on the use of the information in the site.
News, views, opinions, recommendations and other information obtained from sources outside of www.icmarkets.com.au, used in this site are believed to be reliable, but we cannot guarantee their accuracy or completeness. All such information is subject to change at any time without notice. IC Markets assumes no responsibility for the content of any linked site.
The fact that such links may exist does not indicate approval or endorsement of any material contained on any linked site. IC Markets is not liable for any harm caused by the transmission, through accessing the services or information on this site, of a computer virus, or other computer code or programming device that might be used to access, delete, damage, disable, disrupt or otherwise impede in any manner, the operation of the site or of any user’s software, hardware, data or property.


