
EUR/USD:
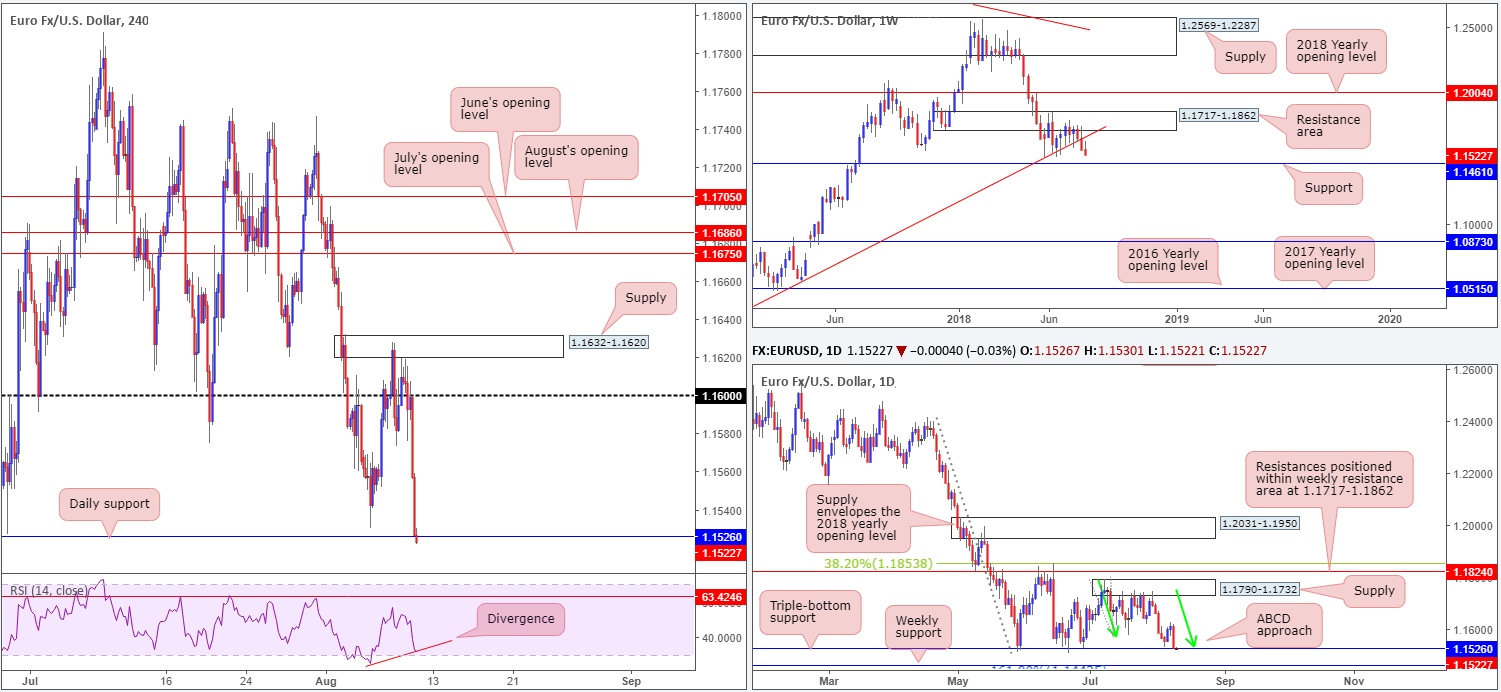
Comments from Fed’s Evans kept the USD on the winning side of the table amid trade on Thursday. Slightly more hawkish than his typically dovish stance, he argued the US economy is performing ‘very well’ and thinks one or two more rate hikes are reasonable by the end of the year.
Retesting the underside of the 1.16 handle on the H4 timeframe, the pair headed towards daily support at 1.1526 during US hours in the shape of two near-full-bodied H4 bearish candles. 1.1526, as you can probably see from the daily chart, also happens to converge with an ABCD completion point (see green arrows). Further adding weight to this daily barrier, we can see the H4 RSI indicator displaying divergence at the moment. The only drawback to buying from here, however, can be seen on the weekly timeframe. After breaking through trend line support (taken from the low 1.0340), the next area on the hit list is not seen until we reach support at 1.1461.
Areas of consideration:
Between daily support mentioned above at 1.1526 and the 1.15 handle on the H4 timeframe (not seen on the screen), a rotation to the upside may take shape today. As this entails buying into potential weekly flow, traders are urged to consider waiting for additional H4 candle confirmation prior to pulling the trigger: a full or near-full-bodied bull candle (stops best placed beneath the candle’s rejection tail).
Today’s data points: US CPI m/m (Inflation).
GBP/USD:
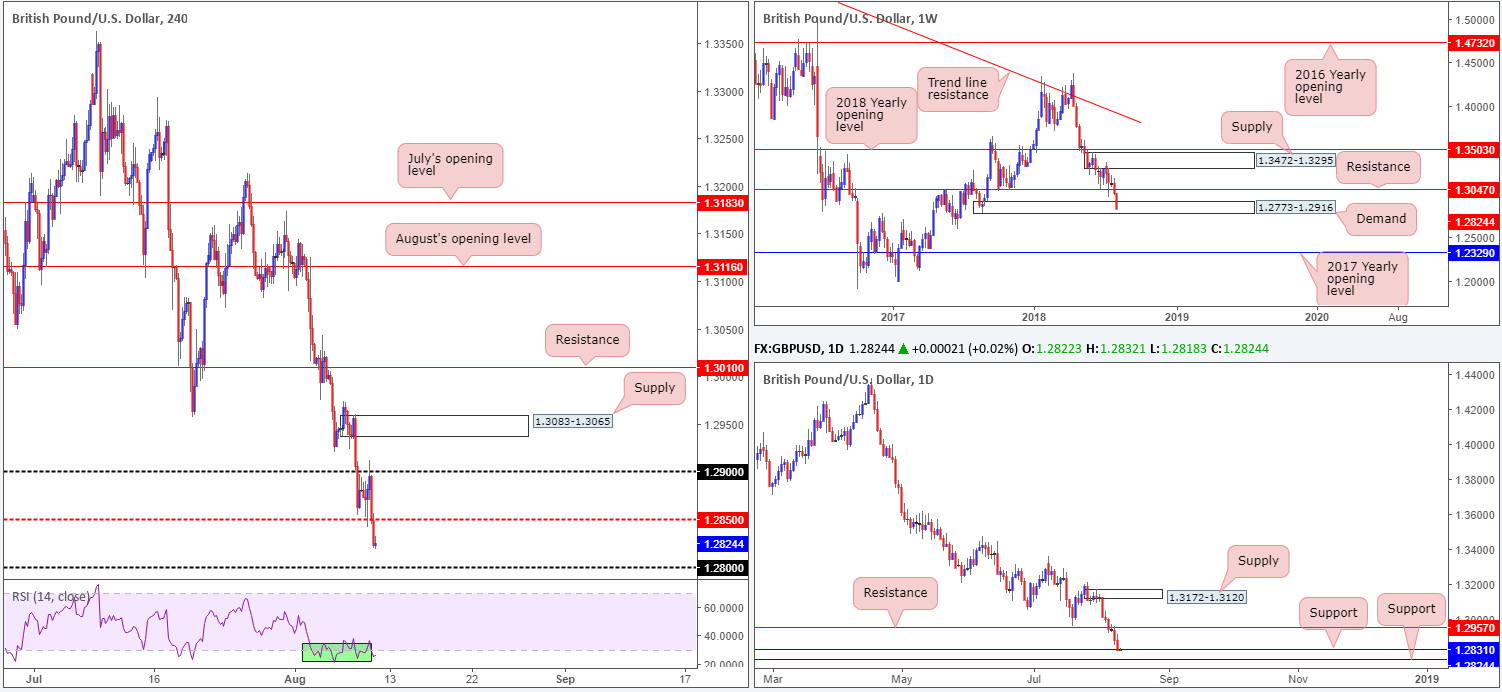
Unable to sustain gains beyond the 1.29 handle on the H4 timeframe, the British pound aggressively turned lower against its US counterpart after comments from Fed’s Evans going into Thursday’s US session. H4 mid-level support at 1.2850, as you can see, put up little fight, consequently exposing the 1.28 level.
Registering its sixth consecutive daily loss, daily movement chewed through support at 1.2813 yesterday, possibly opening the window for a test of support seen at 1.2774. Interestingly, 1.2774 denotes the lower edge of a weekly demand area seen in play at 1.2773-1.2916. Note this weekly area boasts strong momentum to the upside, indicating strength.
Areas of consideration:
Between the 1.28 handle and daily support mentioned above at 1.2774, a correction could be on the cards. Technically speaking, this zone is the last barrier of defense for the current weekly demand area, given it is positioned within the lower limits of the zone. Therefore longs from 1.2774/1.28 allows one to place stop-loss orders beneath a weekly demand (1.2771ish).
On the data front, traders might want to note a reasonably heavy morning is likely ahead for the pound today, with growth data, manufacturing production figures and trade balance all released during early London hours.
Today’s data points: UK GDP m/m; UK manufacturing production m/m; UK trade balance; UK prelim business investment q/q; US CPI m/m (Inflation).
AUD/USD:
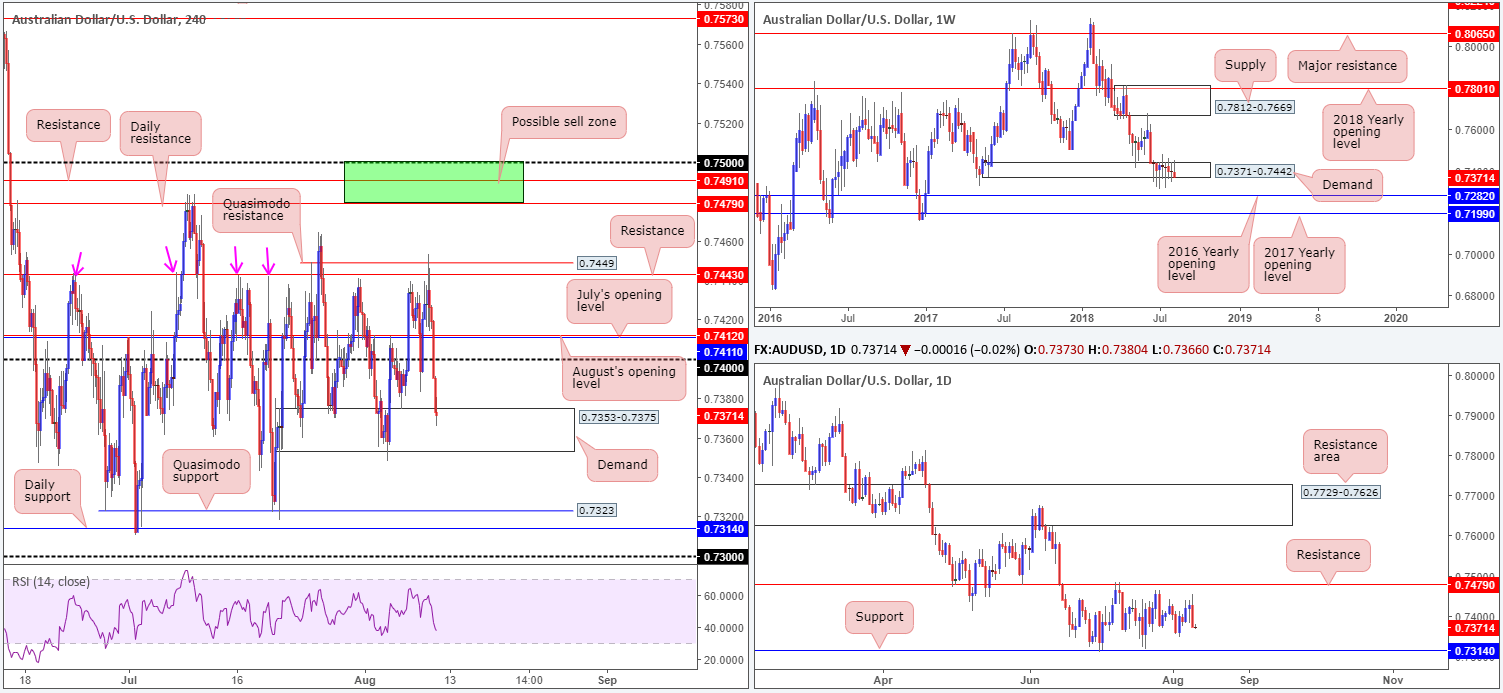
Greenback strength exerted downward pressure on the commodity currency amid Thursday’s sessions, following a near-to-the-pip test of H4 Quasimodo resistance at 0.7449. The move seems to have been exacerbated following statements from Fed’s Evans, who dropped in with a hawkish tone. A number of H4 tech supports were engulfed, leading the H4 candles into the jaws of a demand base coming in at 0.7353-0.7375. Technically speaking, this area suffered a breach at the beginning of the month, and therefore could be weak. The next H4 support target to have on the radar beneath here falls in at Quasimodo support drawn from 0.7323.
In terms of weekly price action, little has changed over the past month and a half. Demand at 0.7371-0.7442 remains in a fragile state, opening the window to a possible test of the 2016 yearly opening level at 0.7282 sometime down the road. In the event the bulls regain consciousness, however, a retest of supply at 0.7812-0.7669 may eventually be on the cards. The reason behind the lack of movement on the weekly timeframe, technically that is, likely has something to do with the fact daily flow continues to respect its current range. Since early July, the Aussie has fluctuated between support drawn from 0.7314 and resistance chalked up at 0.7479.
Areas of consideration:
The only area that jumps out at us this morning on the H4 timeframe is seen between the H4 Quasimodo support mentioned above at 0.7323 and daily support at 0.7314. Given the threat of a fakeout beneath this small zone to 0.73, though, traders may want to consider waiting and seeing if H4 price can chalk up a full or near-full-bodied bull candle prior to pulling the trigger. The first upside target from 0.7314/0.7323 can be seen around the underside of current H4 demand (will be a resistance area at that time) at 0.7353.
Today’s data points: RBA monetary policy statement; US CPI m/m (Inflation).
USD/JPY:
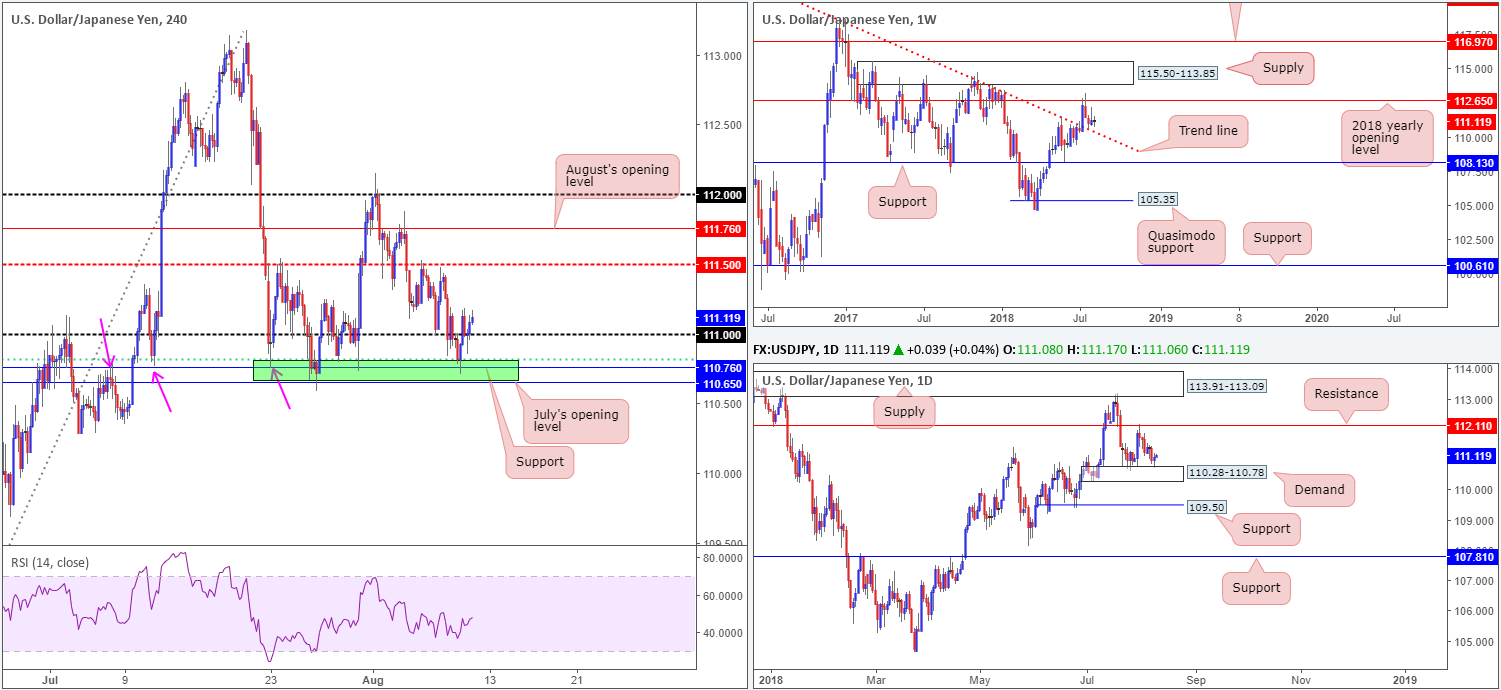
For those who read Thursday’s briefing you may recall the team highlighted a possible H4 buy zone marked in green at 110.65/110.81. We liked this area for longs due its construction:
- July’s opening level at 110.65.
- H4 support at 110.76.
- 61.8% H4 Fib support at 110.81 (green line).
- Stop-loss orders below 111 will likely provide bigger players the liquidity needed to buy.
Also bear in mind the top edge of daily demand at 110.28-110.78 converged with 110.65/110.81, along with the current weekly trend line resistance-turned support (taken from the high 123.57) seen intersecting with the lower edge of the daily zone.
Well done to any of our readers who managed to jump aboard this move. H4 price easily crossed above the 111 handle, which, if you remember from Thursday’s analysis, was a cue to reduce risk to breakeven. In the event, H4 price remains defensive above 111, the H4 mid-level resistance at 111.50 is likely the next base on the hit list. In terms of higher-timeframe targets, however, daily action shows a possible move as far north as 112.11.
Areas of consideration:
Those who missed the long from 110.65/110.81 may be offered a second chance to buy this market today on a retest off 111. A bounce from this number in the shape of either a H4 bullish pin-bar formation or a H4 full or near-full-bodied bull candle would likely be enough evidence to consider longs, targeting 111.50, followed then by daily resistance plotted at 112.11.
Today’s data points: US CPI m/m (Inflation).
USD/CAD:
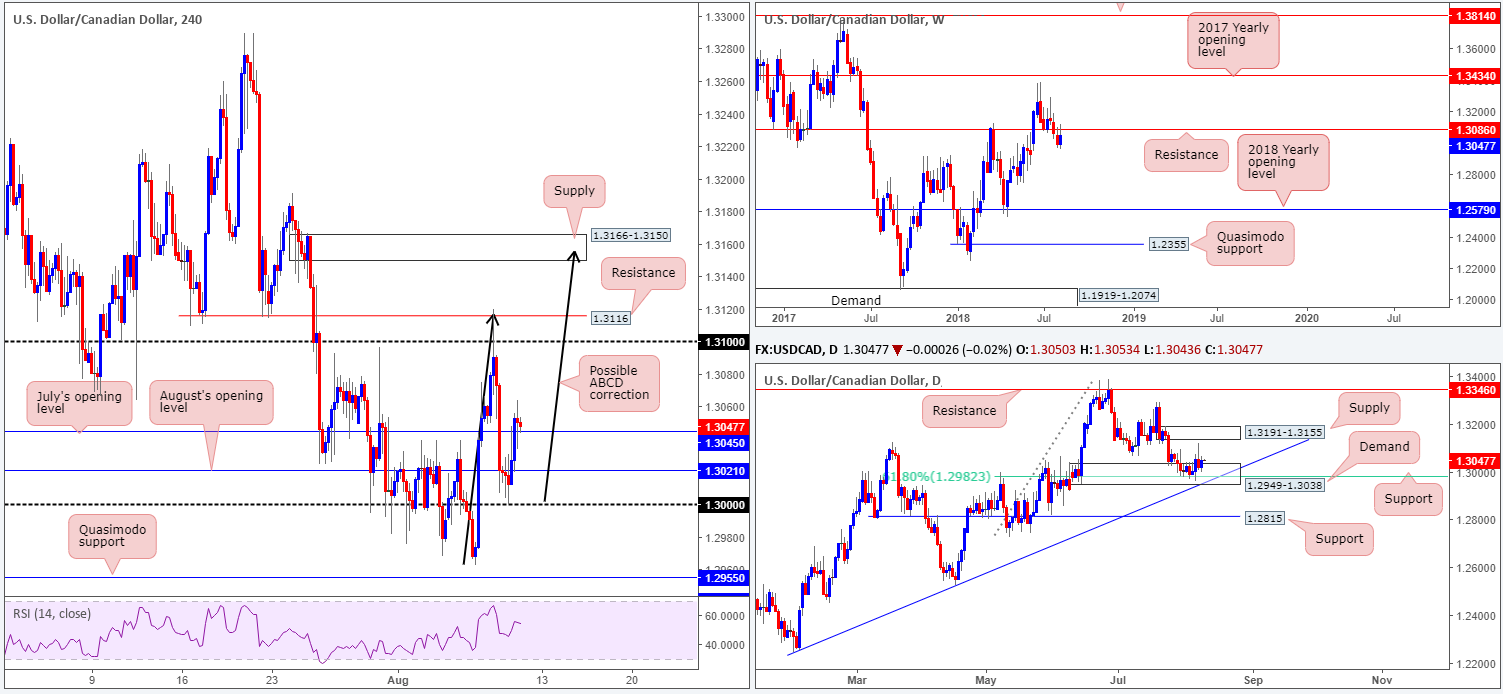
USD/CAD buyers entered an offensive phase on Thursday after shaking hands with the key figure 1.30 in early European trade. The pair gained traction after Chicago Fed President Charles Evans’ hawkish comments boosted the greenback, eventually carrying the H4 candles beyond July’s opening level at 1.3045, which is currently being retested as support.
A continuation to the upside from 1.3045 has the 1.31 handle to target, shadowed closely by H4 resistance painted at 1.3116. Beyond here, nonetheless, eyes will be drawn to H4 supply at 1.3166-1.3150, which happens to converge with a H4 ABCD completion point (black arrows).
On the daily timeframe, demand at 1.2949-1.3038 remains in the fold. It’s also worth noting within the current daily demand a 61.8% Fib support value at 1.2982 is seen, along with the daily zone’s lower edge intersecting with nearby trend line support (etched from the low 1.2247). What’s likely restraining buyers from here is weekly resistance seen at 1.3086.
Areas of consideration:
Our outlook for this market remain bullish, despite a weekly resistance seen in the fold. The ultimate target for longs, as far as we can see, is the H4 supply zone mentioned above at 1.3166-1.3150, which is glued to the underside of daily supply fixed at 1.3191-1.3155: the next upside target on the daily scale.
Should H4 price print either a H4 bullish pin-bar formation or a H4 full or near-full-bodied bull candle off July’s opening level at 1.3045 today, this will likely be enough confluence to encourage further buying to at least the 1.31 threshold.
Today’s data points: US CPI m/m (Inflation); Canadian job’s figures.
USD/CHF:
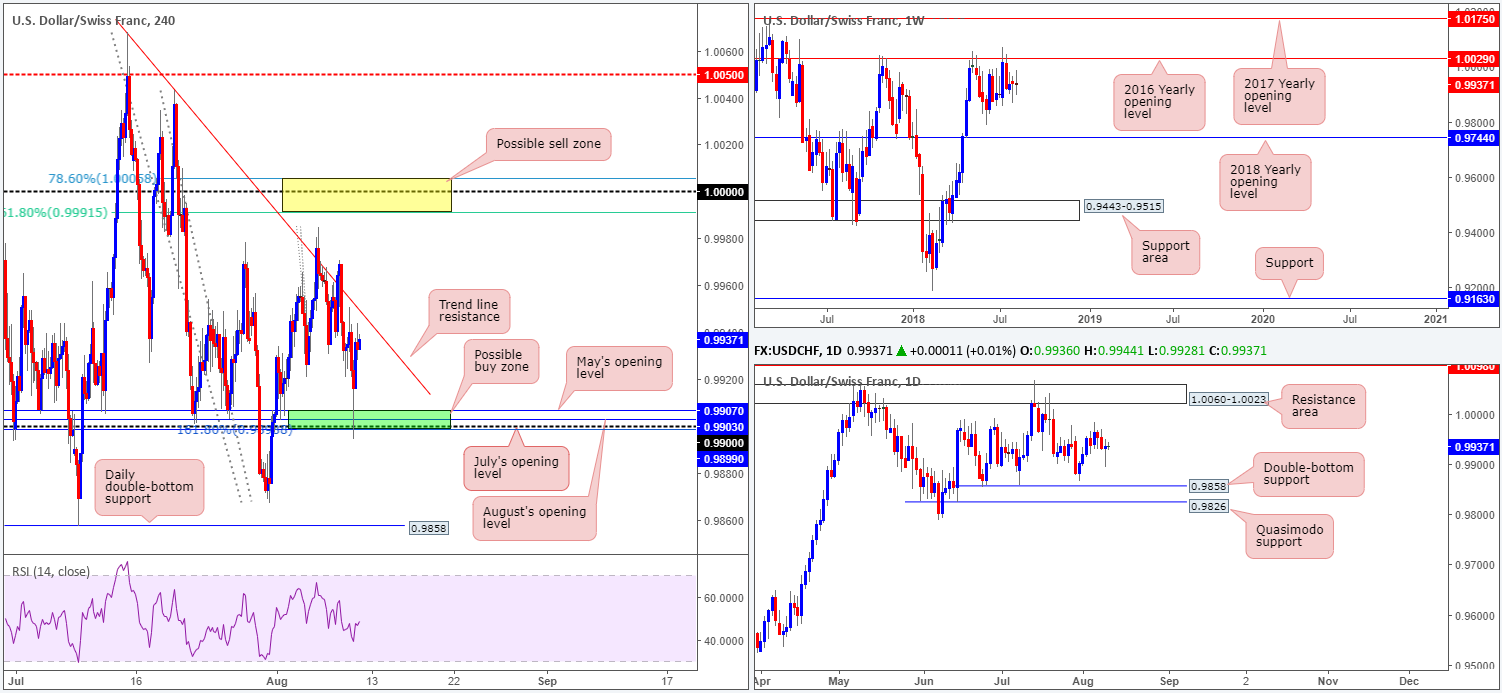
In Thursday’s report you may recall the team underlined a possible buy zone marked in green on the H4 timeframe at 0.9899/0.9907 (comprised of July’s opening level at 0.9899, a 161.8% Fib ext. point at 0.9899 [taken from the high 0.9984], the 0.99 handle, August’s opening level at 0.9903 and May’s opening level at 0.9907). As you can see, price struck the zone, albeit surpassing it by a couple of pips, and rotated to the upside. Well done to any of our readers who managed to jump aboard this move.
The next area of interest to have noted on the H4 scale can be seen at a trend line resistance (etched from the high 1.0068). A break of this barrier could lead to additional bullish sentiment in the direction of parity (1.0000). Note surrounding this widely watched number are two Fibonacci resistances: 78.6% at 1.0005 and 61.8% at 0.9991 (yellow zone).
Meanwhile, weekly price continues to trade beneath key resistance at 1.0029: the 2016 yearly opening level. Holding price lower on two occasions in 2017, and twice already in 2018, this level commands attention! The story on the daily scale shows price action consolidating between 1.0060-1.0023 (a resistance area that encapsulates the 2016 yearly opening level mentioned above on the weekly timeframe at 1.0029), and a double-bottom support at 0.9858.
Areas of consideration:
Should the market observe a rejection off the current H4 trend line resistance today, a retest of 0.9899/0.9907 is likely in store, providing traders another chance to buy the zone.
A break of the current H4 trend line, however, not only places 1.0000 in line for a potential short, but also possible longs on any retest of this descending level as support, targeting 1.0000.
Traders are urged to wait for additional H4 candle confirmation at both the above said areas prior to pulling the trigger, preferably in the shape of a full or near-full-bodied candle. The reason being is round numbers (1.0000 and 0.99) tend to attract ‘stop runs’ (fakeouts).
Today’s data points: US CPI m/m (Inflation).
Dow Jones Industrial Average:
Although the DJIA penciled in its second consecutive daily loss on Thursday out of H4 supply at 25685-25535, buyers are seen making an appearance at a H4 AB=CD 127.2% Fib ext. point drawn from 25448. A break beyond this barrier may call for a test of H4 support at 25256.
In terms of weekly action, price recently retested trend line resistance-turned support (etched from the high 25807) in the shape of a reasonably nice-looking bullish pin-bar formation. From this point, a run up to supply coming in at 26670-26042 remains a possible scenario. Meanwhile, on the daily timeframe, supply at 25571-25383 remains in the fight, despite Tuesday’s break higher.
Areas of consideration:
Should your trading methodology agree with longs from the current H4 AB=CD completion at 25448, placing stops beneath the 161.8% Fib ext. point at 25396 is an option. Conservative traders will likely look to reduce risk to breakeven once, or indeed if, H4 price makes it back into the noted H4 supply area. From thereon, trailing the position using lower-timeframe supports is recommended since a break of the H4 supply may be on the cards, given the room seen to move higher on the weekly timeframe.
Today’s data points: US CPI m/m (Inflation).

XAU/USD (Gold)
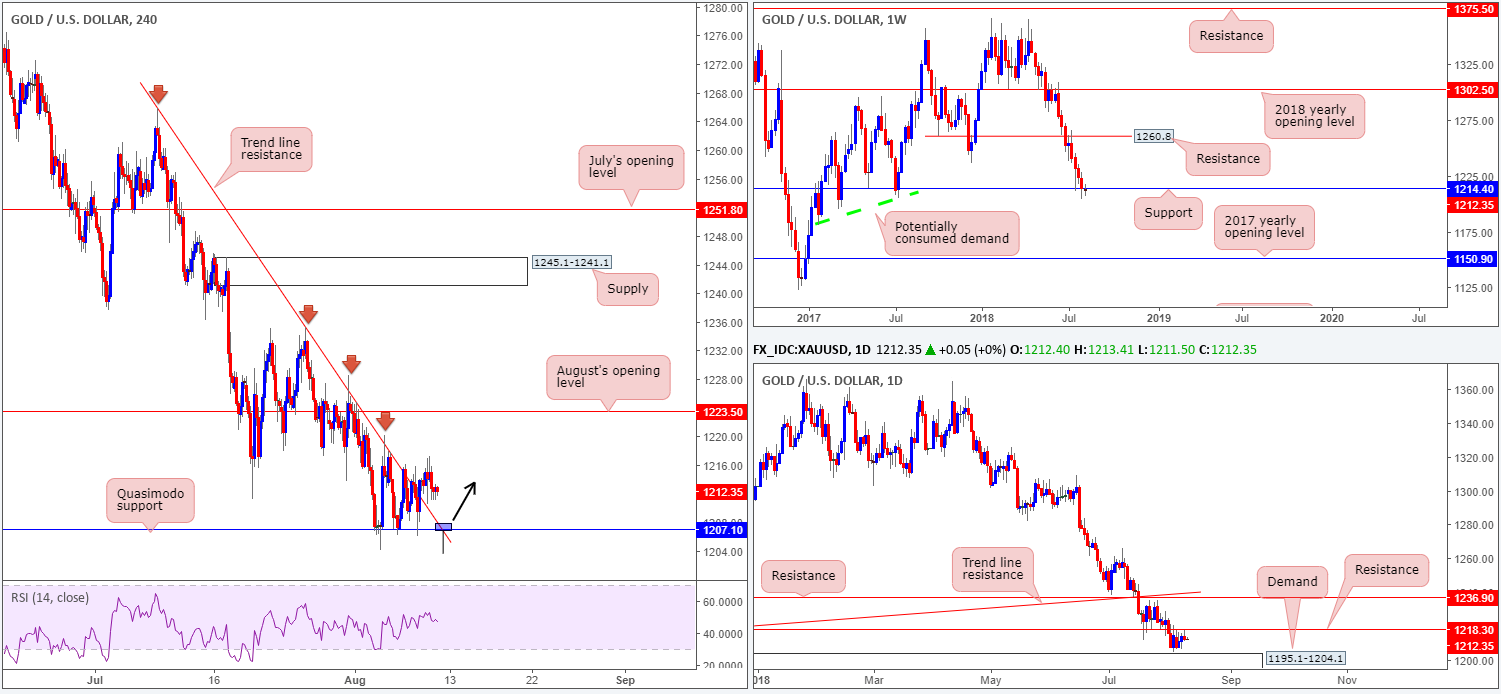
Despite a reasonably decisive H4 trend line (resistance) break (taken from the high 1265.9), the yellow metal quickly came within touching distance of nearby daily resistance at 1218.3 and turned lower on Thursday. Continued selling from this point could lead to another test seen of H4 Quasimodo support at 1207.1. On the daily scale, though, we could possibly see a drive through the noted H4 Quasimodo, towards nearby daily demand at 1195.1-1204.1.
Bullion’s weekly support at 1214.4 remains in the fight, despite a number of attempts to push lower. A decisive close beneath here would, in our technical opinion, open up the possibility for further downside as far south as the 2017 yearly opening level at 1150.9. Note there’s limited active demand to the left of current price between these two levels.
Areas of consideration:
In light of recent movement, the team have noted to keep eyeballs on the current H4 Quasimodo support and H4 trend line resistance-turned support for possible long opportunities today. With that being said, though, a H4 pin-bar bullish formation that pierces through the Quasimodo line and tags the top edge of daily demand at 1204.1 would, technically speaking, be required before a buy grows into a high-probability setup (see the chart for a visual representation).
The use of the site is agreement that the site is for informational and educational purposes only and does not constitute advice in any form in the furtherance of any trade or trading decisions.
The accuracy, completeness and timeliness of the information contained on this site cannot be guaranteed. IC Markets does not warranty, guarantee or make any representations, or assume any liability with regard to financial results based on the use of the information in the site.
News, views, opinions, recommendations and other information obtained from sources outside of www.icmarkets.com.au, used in this site are believed to be reliable, but we cannot guarantee their accuracy or completeness. All such information is subject to change at any time without notice. IC Markets assumes no responsibility for the content of any linked site. The fact that such links may exist does not indicate approval or endorsement of any material contained on any linked site.
IC Markets is not liable for any harm caused by the transmission, through accessing the services or information on this site, of a computer virus, or other computer code or programming device that might be used to access, delete, damage, disable, disrupt or otherwise impede in any manner, the operation of the site or of any user’s software, hardware, data or property.


