
In the 1930s, Ralph Nelson Elliot discovered price movements adhere to certain patterns, composed of what Elliot titled: waves, consequently firing the opening shot in a decades-long debate.
Fascinating as it is, the theory is a broad and complex topic within the field of technical analysis, invariably taking practitioners years to master. Despite its complexity, though, the foundations of Elliott wave theory are easy to understand and apply, and therefore could be incorporated almost immediately.
Basic Elliot wave principle
The basic wave principle (or pattern) involves a five-wave count and forms as market prices travel up or down.
The overall pattern forms an uninterrupted configuration in that the end of one wave marks the beginning of another wave (figure 1.1).
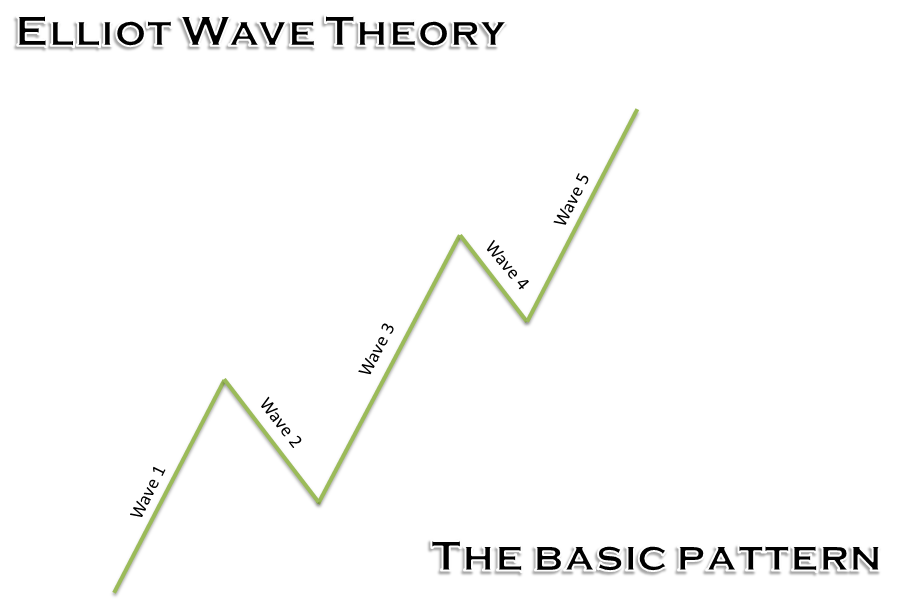
(Figure 1.1)
The five-wave sequence, labelled 1-5, is a complete motive wave – it propels the market in the direction of the primary trend. Sub waves 1, 3 and 5 are also labelled motive waves, while sub waves 2 and 4 are corrective waves as they interrupt the main trend.
Two Elliot wave rules govern motive waves:
- Wave 2 never retraces beyond wave 1
- Wave 3 is never the shortest motive wave.
After a five wave sequence completes, the corrective wave begins. The corrective wave partially retraces the movement developed by the motive wave. It follows a three-wave arrangement, or a combination of three-wave structures (combinations are best suited for another article), and is labelled using letters (figure 1.2).
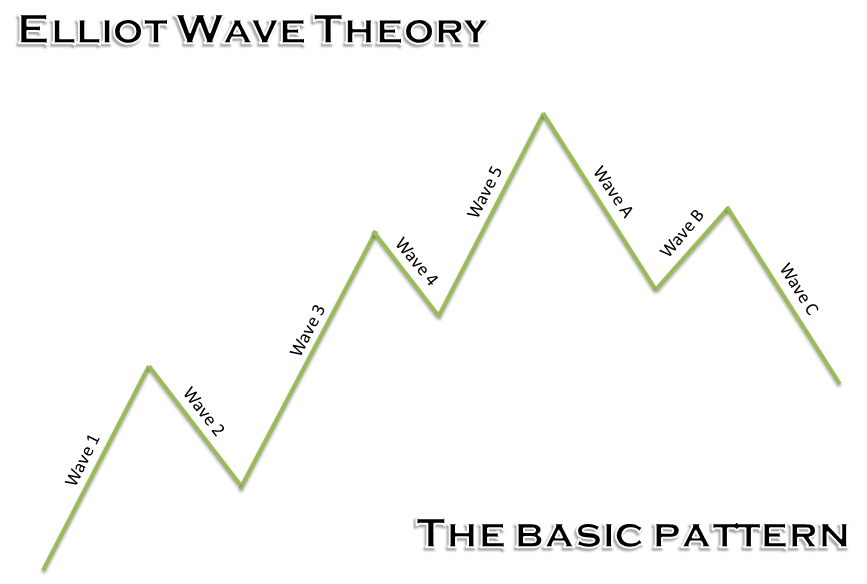
(Figure 1.2)
Another consideration is fractals (timeframes): the ability for trends and patterns to act similarly over different periods. Essentially all waves are part of other waves at a greater degree and are also divisible into waves at a lesser degree.
To illustrate, figure 1.3 shows wave 1 incorporates a lesser scale five-wave sequence, and wave 2 incorporates a three-wave corrective arrangement:
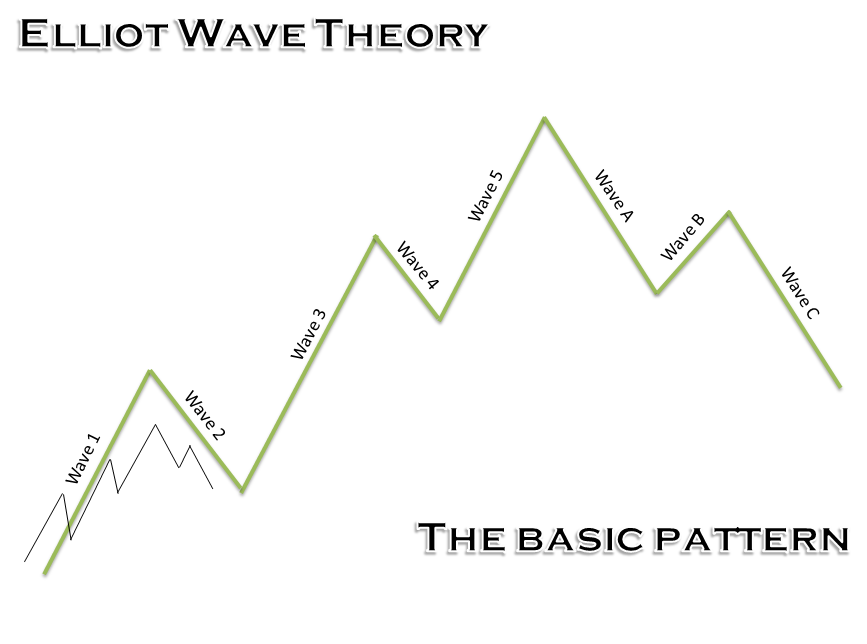
(Figure 1.3)
Motive waves
There are two types of motive waves: impulse and diagonal.
The impulse wave is the strongest form of motive wave (figure 1.4), following three rules:
- Wave 2 should always retrace less than 100% of wave 1.
- Wave 3 is never the shortest, though it does not have to be the longest.
- Wave 4 never enters the price territory of wave 1 (green line)
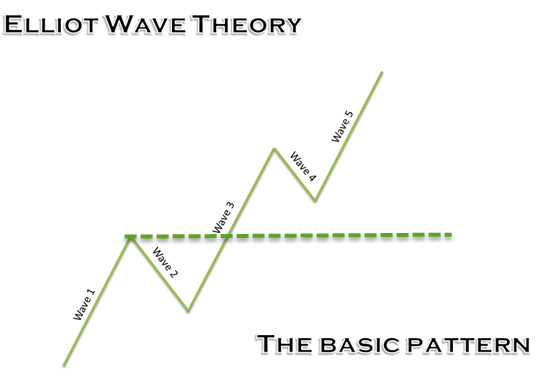
(Figure 1.4)
Waves 1 and 5 are always motive waves (either an impulse or [leading] diagonal/[ending] diagonal wave), while wave 3 is, at all times, an impulse wave. Waves 2 and 4 are always corrective waves (the piece covers both diagonal and corrective formations shortly). As such, the structure count is 5-3-5-3-5.
The diagonal wave, although still a motive wave, differs from impulse waves.
The first two rules of an impulse wave applies to a diagonal wave sequence, but rule 3 (wave 4 can never enter the price territory of wave 1) is not followed. Wave 4 frequently penetrates wave 1.
Two types of diagonal patterns exist, representing a contracting configuration: ending and leading.
Both ending and leading diagonals have wave 3 shorter than wave 1, wave 5 shorter than wave 3 and wave 4 shorter than wave 2, thus forming a contraction. The formation has its borders limited by two converging trend lines, denoting a ‘wedge’ shape.
An ending diagonal occurs in wave 5 of an impulse wave, or the last wave of a corrective pattern: wave C of zigzag or flat patterns. The ending diagonal often develops when the preceding trend has run out of steam.
The wave-structure of an ending diagonal is different from the impulse wave. Sub waves 1,2,3,4 and 5 take on a corrective wave formation: a three-wave arrangement. The impulse wave, as highlighted above, has a structure count of 5-3-5-3-5, whereas the ending diagonal has a structure count of 3-3-3-3-3.
Figure 1.5 shows an ending diagonal in a bull market that typically concludes with a move to the downside. An ending diagonal flipped on its head contains the same parameters and generally ends with a move forming to the upside (an ending diagonal in a bear market).
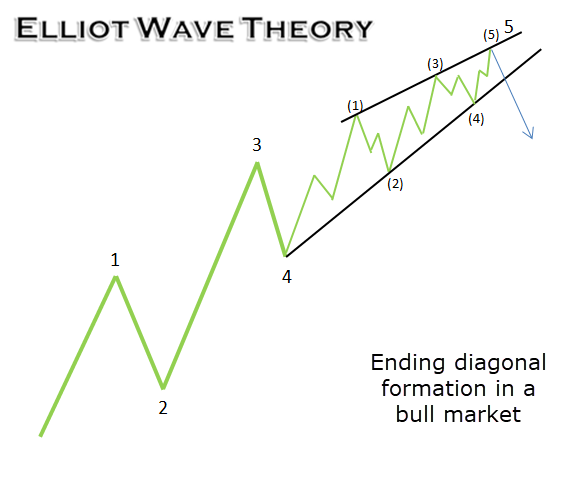
(Figure 1.5)
In a leading diagonal formation (figure 1.6), waves 1, 3 and 5 are either all impulse waves or all correction waves in the form of zigzags. Waves 2 and 4 are always zigzag patterns. A leading diagonal can form wave 1 of an impulse wave and the first wave of a zigzag, labelled wave A in a corrective pattern.
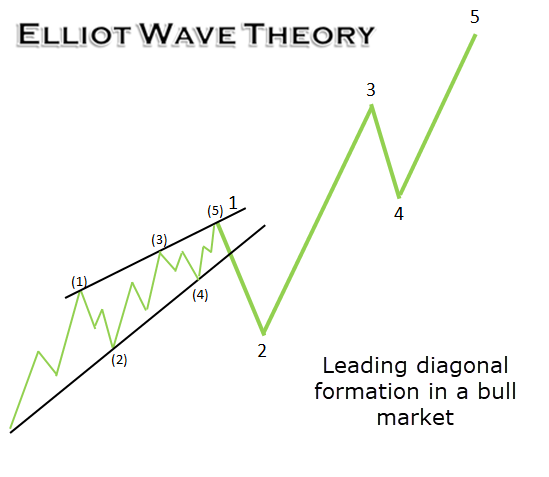
(Figure 1.6)
Extension is also an important aspect to be aware of. In an impulse wave, usually one of the motive waves, often waves 3 or 5, is extended or elongated.
Third wave extensions are often observed in the stock market, while fifth wave extensions are predominant in the commodities market.
- If wave 1 extends, traders can expect waves 3 and 5 to be about equal in length.
- If wave 3 extends, expect waves 1 and 5 to be about equal in length.
- If waves 1 and 3 are about equal length, expect wave 5 to experience some form of extension.
Rarely do two motive waves extend, though it does happen.
Corrective waves
Trending markets invariably come across interruptions or pullbacks, termed corrective waves in Elliot wave theory.
Elliot wave theory helps define corrections and identify potential ‘completion’ using zigzag, flat and triangle arrangements. This is helpful for traders looking to buy/sell corrections within a trend.
Zigzag is a three-wave corrective pattern labelled A-B-C. Zigzags split as a 5-3-5 structure: the A leg contains 5 sub waves, the B leg holds 3 sub waves and the C leg houses 5 sub waves. Wave A should always represent either an impulse or leading diagonal formation. Wave B is always a corrective wave: a zigzag, flag, triangle or combination, and wave C is always an impulse or ending diagonal.
Zigzags appear in the construction of many of the Elliott wave patterns. Figure 1.7 displays a zigzag corrective wave.
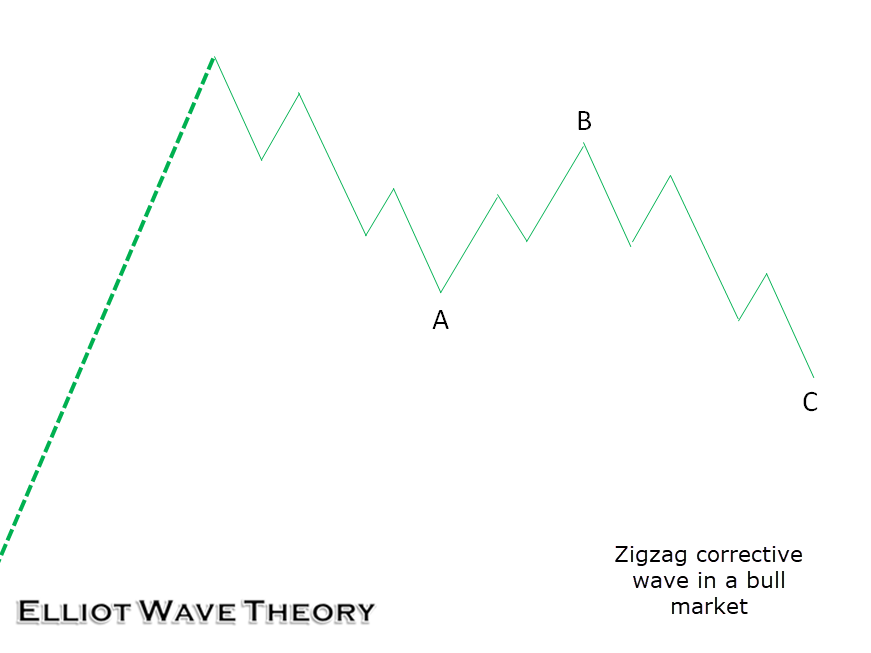
(Figure 1.7)
Wave B can never retrace beyond the beginning of wave A, and wave C should always travel beyond wave A’s end. Should wave C fail to push past wave A, a truncated wave emerges. A truncation occurs if wave 5 (in an impulse wave) fails to terminate beyond the end of wave 3.
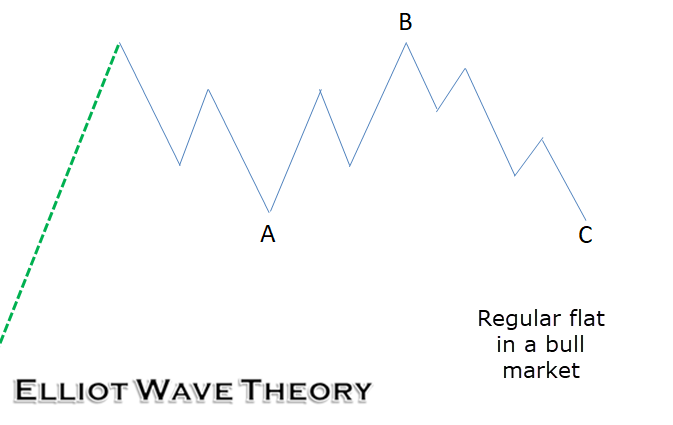
Flat, labelled A-B-C, is also a three-wave corrective pattern present in the markets. Wave C is always a motive wave (impulse or an ending diagonal) and waves A and B are always corrective waves. Therefore, the flat is a 3-3-5 structure.
There are three types of flats: regular, expanded and running:
- Regular flats typically have wave B terminating at the same level as the beginning of wave A, and wave C ends slightly past the end of wave A (figure 1.8).
- A running flat has wave B breaching the beginning of wave A, with wave C failing to reach the end of wave A (figure 1.9).
- The expanded flat reminds of a whipsaw formation. Wave B concludes beyond the start of wave A and wave C terminates noticeably beyond the end of wave A (figure 1.10).
(Figure 1.8)
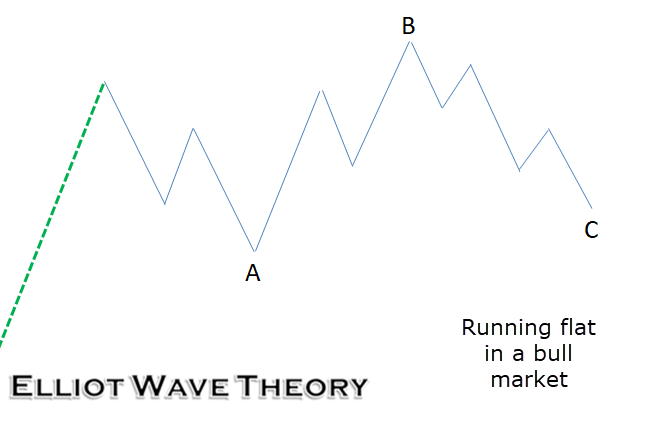
(Figure 1.9)
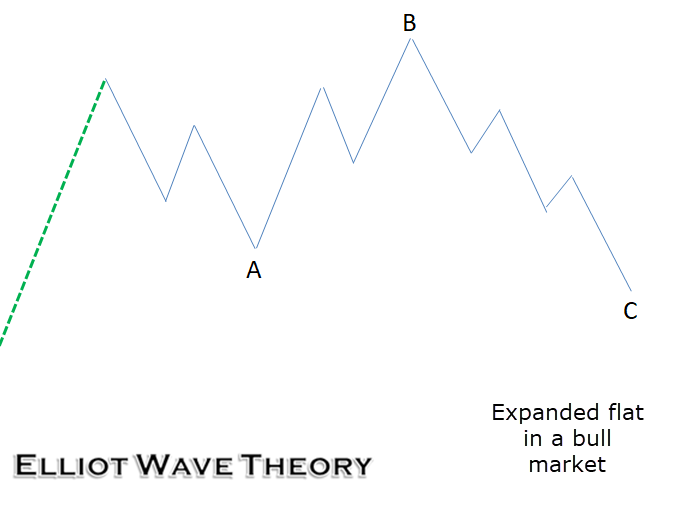
(Figure 1.10)
Triangle is a corrective wave that houses sub waves A-B-C-D-E. In the majority of cases, all sub waves within a triangle structure are zigzag patterns. Triangles are, therefore, labelled as 3-3-3-3-3 structures. You may sometimes find one of the sub waves forms another triangle, typically found at waves C, D or E (only one of these sub waves should exhibit complexity, though).
Figure 1.11 shows the three types of triangles: contracting, barrier and expanding:
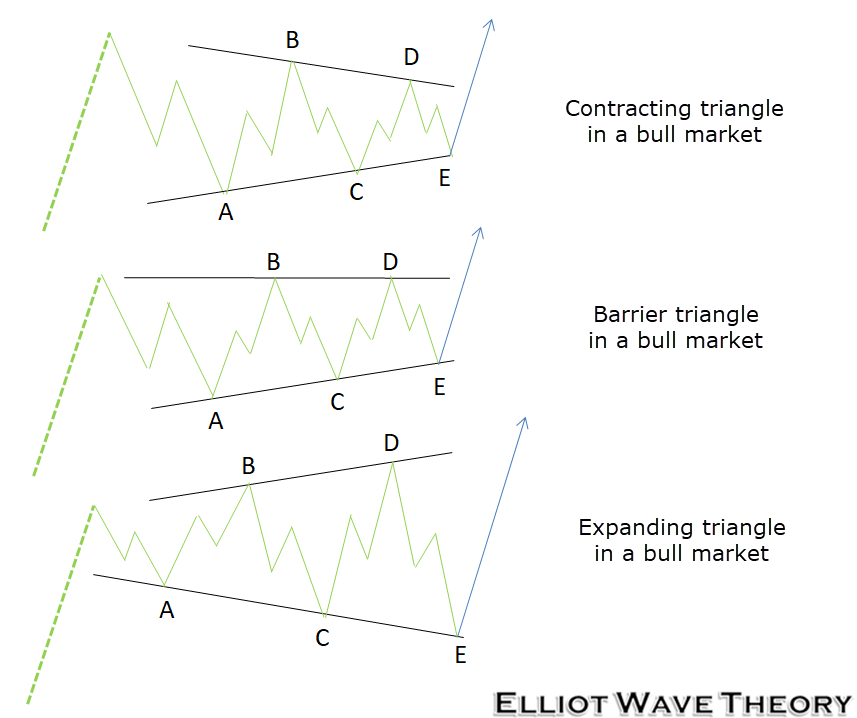
(Figure 1.11)
Contracting and barrier triangles house converging trend lines, while an expanding triangle has diverging trend lines.
In a contracting formation, wave C never penetrates beyond wave A; wave D never extends beyond wave B and wave E also never extends past wave C. Barrier and contracting triangles are of similar structure with one exception: the former has waves B and D terminate at about the same level.
Regarding an expanding triangle, following the completion of wave A, each subsequent wave extends beyond the beginning point of the preceding wave.
Fibonacci
Elliot wave analysis also adopts key Fibonacci relationships. This can become somewhat complicated, particularly for newer traders. For that reason, the following will demonstrate only a foundational view for the purpose of this article.
Fibonacci retracements
For impulse waves, the second wave typically corrects into deep territory of its preceding wave, near the 61.8% Fibonacci retracement value (figure 1.12). Fourth waves (another corrective wave), on the other hand, tend to be shorter, generally correcting towards the 38.2% Fibonacci retracement value of wave 3 (figure 1.13).
This, alongside other corrective formations (above), helps formulate a ‘termination point’ in which price action should halt.
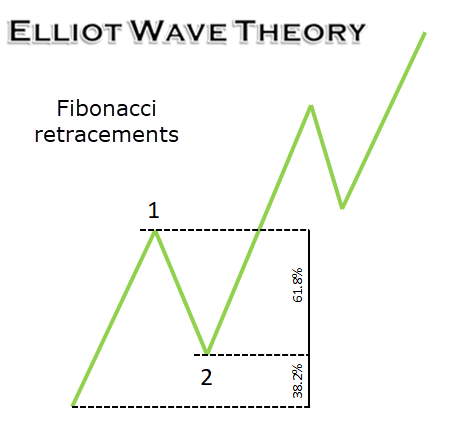
(Figure 1.12)
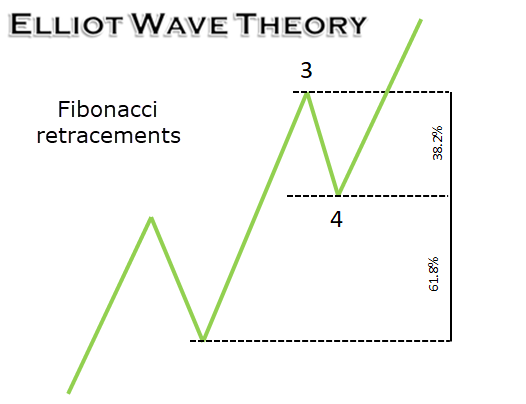
(Figure 1.13)
Fibonacci multiples
In an impulse wave, wave 5 will often equal 61.8% or 38.2% times the net distance travelled of waves 1 through 3 (figure 1.14/15).
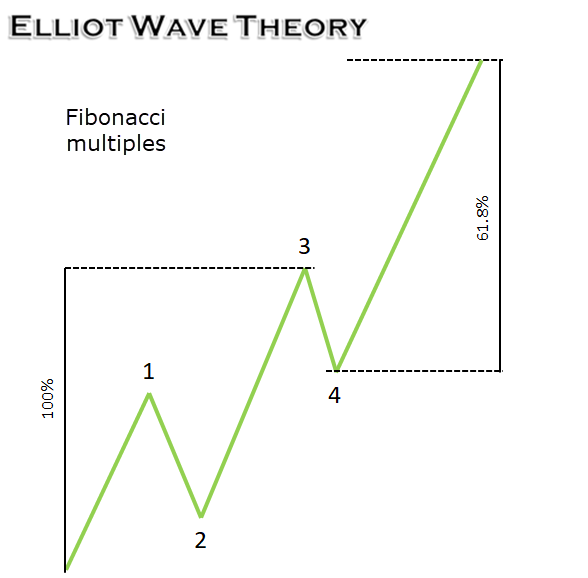
(Figure 1.14)
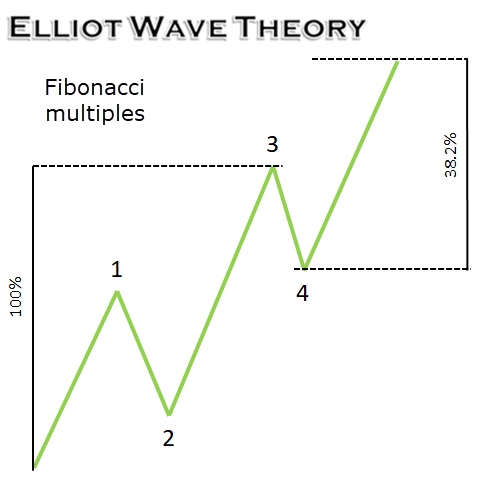
(Figure 1.15)
If wave 3 is elongated, traders can expect waves 1 and 5 to be of equal length. A wave 5 extension, however, can travel 1.618 times the net distance travelled of waves 1 through to 3 (figure 1.16).
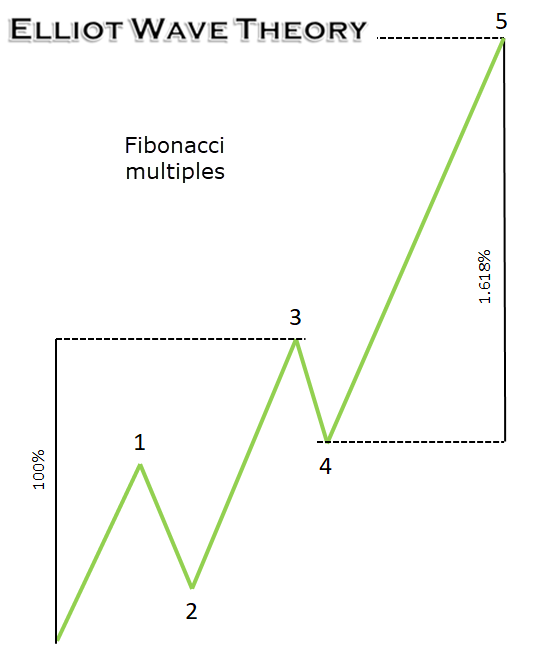
(Figure 1.16)
In the event wave 1 extends, traders should look for the distance of waves 3 through to 5 to equal 61.8% of the length of wave 1.
An established way to trade
Although the article barely scratches the surface in terms of Elliot wave analysis, it does provide a foundation to build upon.
Successful traders around the world adopt Elliot wave analysis and many indicate consistency using this trading strategy. It will, nonetheless, take time to pin down the theory’s subtle nuances and understand how to best apply it to the market that fits with your personality and trading style, though it is time well spent.
