Considered by many as the father of technical analysis, Charles Henry Dow was the first to create an index measuring the overall price movement of US stocks. Founded in 1896, the Dow Jones Industrial Average took its name from Dow and statistician Edward Jones. The index was a way for Dow and Jones to report the overall health of the stock market to investors.
A brief history
Charles H. Dow was the founder of the Dow-Jones financial news service and founder and first editor of the Wall Street Journal.
Unbeknownst to many, Dow never explicitly framed Dow Theory. Dow composed editorials, though never organised these pieces into a coherent model.
The term Dow Theory was actually coined by a gentleman going by the name of A. C. Nelson, who wrote: The A B C of Stock Speculation (1902), based on Dow’s Wall Street journal editorials.
Following Dow’s passing, William Peter Hamilton succeeded him as editor of the Wall Street Journal, employing the tenets of Dow Theory until his death in 1929. Hamilton also described the basic elements of the theory in his book: The Stock Market Barometer, in 1922.
After Hamilton’s death, Robert Rhea further distinguished Dow Theory. In 1932, Rhea wrote the book: The Dow Theory: An Explanation of its Development and Attempt to Define Its Usefulness as an Aid in Speculation, where Rhea described Dow Theory in detail, using Hamilton’s work as a base and formalising the tenets into a series.
Six tenets of Dow Theory:
Trend:
Dow Theory suggests markets display three trends, all of which may be in progress at one and the same time:
- The first trend, the main movement, or primary movement, is the major trend: wide-ranging rising and descending actions referred to as bull and bear markets which can last for several years. This is relatively visible on a minimised chart. Rhea stated the correct determination of the primary trend is the most important factor in successful speculation.
- The second trend, or secondary trend, which may last from a few weeks to sometimes months at a time, typically retraces 33%-66% of the primary trend. According to Rhea, a secondary reaction is an important decline in a bull market or advance in a bear market.
- The third trend is usually unimportant, composed of daily fluctuations. The day-to-day movement should be recorded and studied, though, because a series of charted daily movements eventually matures into a pattern easily recognised as having forecasting value (Rhea).
Trend phases:
Major market trends incorporate three phases, according to Dow Theory.
- The first phase, the accumulation phase, is the point astute investors enter the market. In a long-term downward moving market this is a revival of confidence. For a long-term bullish market, on the other hand, the initial phase can be described as an abandonment of hopes upon which stocks were bought.
- The second phase comes down to increased/decreased earnings, consequently encouraging bids/offers into the market and extending the present trend. This is often considered the public participation phase, whereby trend followers typically jump aboard as previous trend line structures are likely penetrated, and long-term moving averages switch direction.
- The final stage is the distribution Here, traders who initially accumulated the position during the primary phase look to distribute (liquidate) their positions. At this point, the trend is underway and visible to all, therefore, drawing the attention of most market participants. Essentially, speculation becomes dominant and, in the case of an uptrend, attempts to advance on hopes and expectations. In a bearish market, distress selling emerges by those who believe the worst is yet to come.
The averages discount everything:
Dow Theory states markets swiftly integrate information that affects supply and demand as it becomes available. The theory applies to market averages, as well as to individual markets. On this basis, this principle agrees with the most commonly used definition of the efficient market hypothesis (EMH): the semi-strong definition which is prices accurately summarise all publicly known information.
Confirmation:
Confirmation is the means of recognising which direction the primary trend is facing. Dow ignored movement in one market average that wasn’t confirmed by the other, which in Dow’s time was the industrial and railroad averages. Confirmation of the Dow Theory came about when both the industrial and railroad averages clocked fresh highs or lows together on a daily closing basis.
Today, investors generally watch the S&P 500 and the Russell 2000. The rationale behind this is the S&P 500 represents the most highly capitalised companies in the US: large-cap stocks, and the Russell 2000 focuses on 2000 small-cap companies with higher growth and usually a technological base. This combination is not set in stone, nonetheless. Investors must find which average combination suits their approach.
Volume:
Volume is an important secondary phase of confirmation of a trend. On the whole, volume should increase alongside the primary trend.
- When prices are rising, an increase in volume is impressive while a decrease in volume is questionable.
- When prices are declining, an increase in volume is impressive while a decrease in volume is questionable.
Trends exist until definitive signals prove that they have ended:
Despite intraday movement, trending markets continue until definitive reversals develop. This tenet forms much of the foundation of modern trend-following approaches.
Dow believed markets may temporarily reverse, though would soon recover and continue punching in the direction of the primary trend. Determining whether a reversal is the start of a new trend or a temporary movement in the current trend is not an easy task. In fact, it is incredibly difficult. A number of technical tools are available to traders to assist in the difficult task of spotting reversal signals, including the study of support and resistance levels, price patterns and technical indicators.
Dow Theory applied to other financial markets
While Dow Theory focuses on equity markets, the application can also aid investment in other financial markets.
The key component is the bigger picture, the longer-term primary trend.
Currency traders have access to a number of market indexes providing a wealth of information. The US dollar index, calculated by factoring in the exchange rates of six major world currencies, allows investors to know where the dollar is in the broad market.
As an example, the EUR/USD and US dollar index together can yield successful results. Figure 1.1 displays both charts from a weekly perspective.
On July 24, 2017, price action on the EUR/USD closed above a major high at 1.1714; though the US dollar index had yet to close beneath a similar low (The US dollar index and EUR/USD are inversely correlated markets). A close lower was not visible until September 4, 2017. The close lower was confirmation the euro was likely to continue heading higher, and it eventually did, topping in the early stages of 2018.
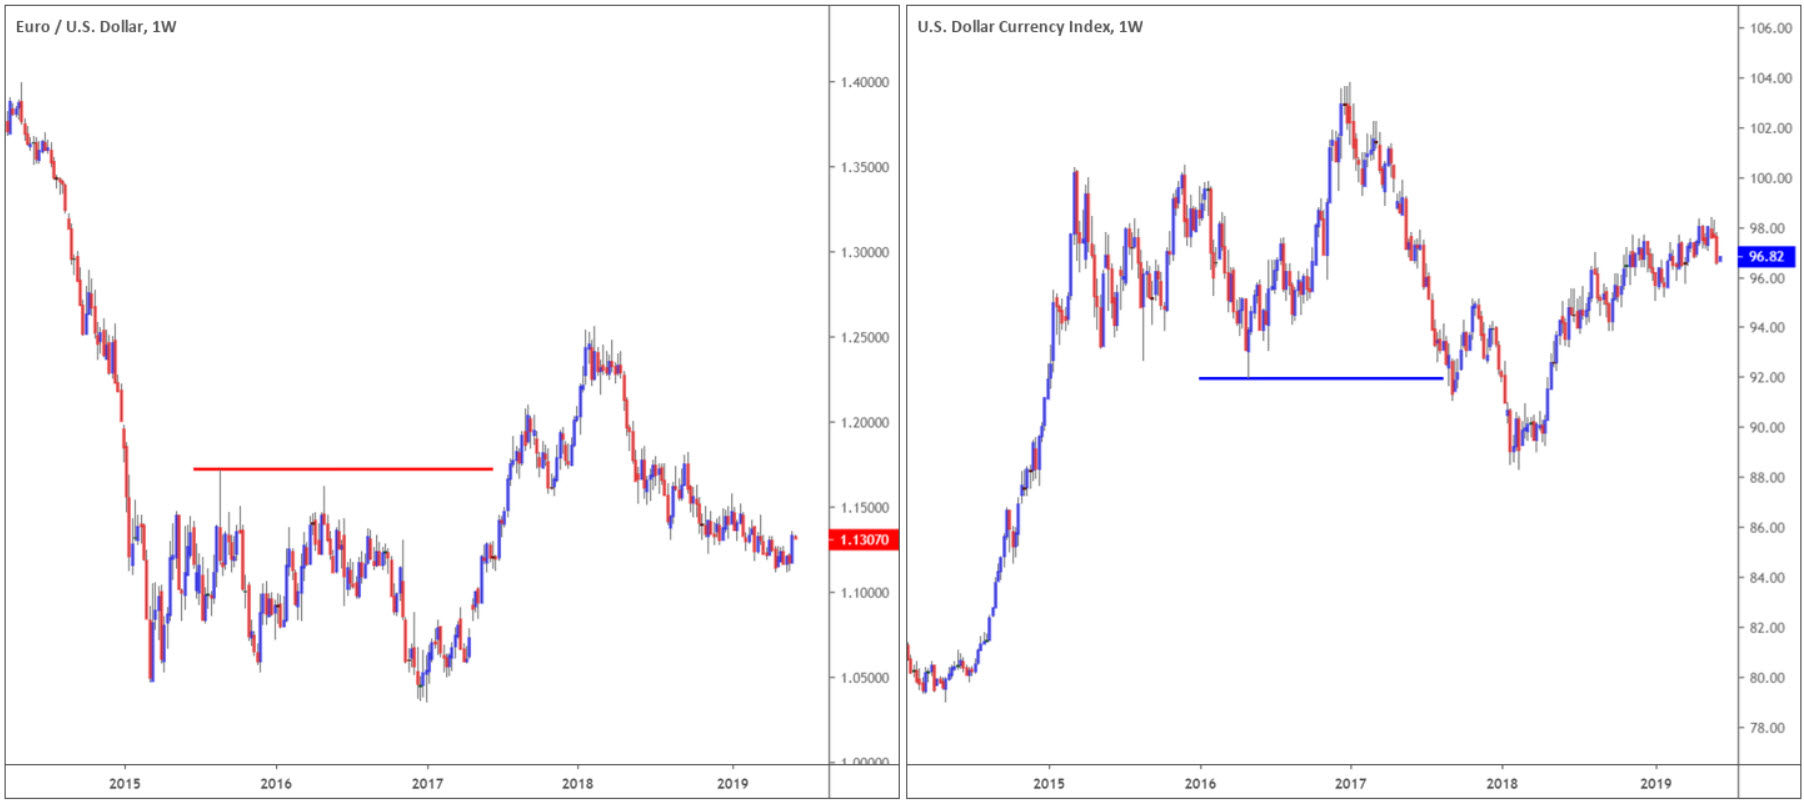
(Figure 1.1)
In addition to the above, investors can employ a number of techniques to confirm a market’s trend. For instance, a long opportunity seen on the GBP/USD could be confirmed by viewing other GBP-related markets (currency pairs). Are those markets gathering strength, forming new highs or lows? Is the GBP’s overall position above or below major support or resistance? These questions help answer how much strength a currency has over its counterpart in the broad market.
The Bottom Line
The biggest takeaway from the Dow Theory in this piece is to always include the overall picture in your investment decisions, and recognise which direction the primary trend is facing. This positions investors in a prime location to take trades alongside the overall flow.