
You’d be hard pressed to find a formation as ubiquitous as the double bottom or double top, often labelled ‘M’ tops and ‘W’ bottoms for visual reasons. Spend a couple of minutes looking at just about any candlestick/bar chart and numerous W and M patterns are immediately obvious.
As a matter of fact, the pattern appears so often it may serve as evidence to prove price action is not as arbitrary as many academics claim.
Trading ‘naked’
Nowadays, the majority of people entering the trading domain focus their energy on the plethora of indicators freely available on most trading platforms. Trading ‘naked’ charts is still considered a form of technical analysis, though it offers a ‘cleaner’ alternative using raw price action as a guide.
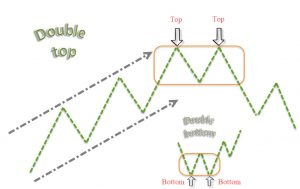
Breaking down the double top/bottom formations is quite straightforward. Using the pre-drawn image below as a reference, a double-top pattern is viewed as a bearish signal, whereas the double bottom is a bullish signal. Both are considered reversal patterns in trending environments.
Separated by a trough (the V in between), the double-top formation houses two consecutive peaks at approximately the same price point. The double-bottom pattern is exactly the same, only turned upside down. Note it is always best to have space between the two peaks/bottoms; some traders call this ‘white space’.
Preferably, the second top should also be the same height or a touch lower than the first top, and the second bottom should be slightly higher than the first bottom or level. Also worth noting is the second price point, either the top/bottom, should represent a sharp reversal, thus displaying clear intent. Fewer candles are always best.
Of course, real-life trading seldom replicates the image offered here. The probability of two tops levelling out at the same price level is rare. You’ll often find the two extreme points of the pattern terminating within close proximity of each other, though. What is important to observe is the close of the candles (the body). Ultimately, traders should be looking for the candle close to remain below/above its previous peak/trough.
Psychology behind the candles
Using the double-top formation as an example (a double bottom will be the same, only inverse), the process which leads to this pattern forming begins with an initial uptrend – essentially a series of higher highs and higher lows, as depicted on the image above. This is a trend trader’s heaven: buy the dips, with the hope of riding the trend until it shows signs of turning south.
Nothing lasts forever, though! As buyer enthusiasm begins to diminish, visually seen by the fact price action is unable to form a higher high following its most recent dip, the trend could be in trouble. Once the market tests its most recent low (technicians label this the neckline – we touch on this later) and prints a close beneath this level, a truckload of buyers’ stop-loss orders will have tripped. Naturally this exacerbates downside pressure as stop-loss orders taken from buyers are sell orders. Not only this, traders have to consider the fact there will also be breakout sellers entering the market as well! This is a warning sign – a double top has completed and the sellers are starting to flex their financial muscle. Those who entered long on the previous dip (hoping for the trend to continue) have limited options here, other than liquidating their positions. Those riding the trend from lower down on the curve, however, will likely be looking to reduce risk based on the pattern formation, and maybe even taking some profits off the table.
From a psychological standpoint, double tops represent a lack of interest from buyers to take things higher. This does not mean the trend will reverse entirely; it could just be the beginnings of a deeper-than-usual pullback. Regardless, it should be considered a warning that sellers have the upper hand in the fight at that time.
Profiting from the double-top/bottom formation
With this way of trading, a double-top pattern is not complete until price breaks the low of the pullback between the tops. The double-bottom pattern is also not confirmed until price breaks the high of the pullback between the bottoms.
As an example, the NZD/USD M60 posted below displays two nice-looking double-top formations. As is evident from the chart, the peaks associated with the two patterns ‘topped’ within close proximity of one another, and a close higher is not seen.
A close beneath the neckline marked in blue is key here (the red circles). This typically signals the sellers are gaining traction.
Some traders prefer entering on the close of the breakout candle beyond the neckline, while others prefer to see price retest the underside of the neckline play out before pulling the trigger. Common stop-loss placement is normally positioned beyond the highest high of the two peaks for double tops and below the lowest low of the two lows on double bottoms.
The minimum profit target is approximately equal to 2x the distance measured from the highest high to the neckline for a double top and from the lowest low to the neckline for a double bottom. An example of such is depicted on the chart below using purple arrows.
If the pullback between the tops or bottoms is significant, as is the case on the second example on the chart below, you can either pass on the setup or reduce the lot size to accommodate the distance.

In summary
Although a trade beyond the neckline is considered a higher-probability setup, more aggressive routes have traders executing buy/sell positions off of the second top/bottom using candlestick patterns as a way of confirming direction. This essentially overlooks the neckline theory, though increases risk/reward exponentially should the double-top/bottom play out.
Further adding to this, limiting yourself to picking tops and bottoms in major trends is a disservice to this high-probability formation. While the double-top/bottom will always be a reversal pattern, traders also use the method as a price confirmation technique at areas of interest, such as, supply and demand zones, trend lines and support and resistance. This is beyond the scope of this article, though it is certainly worth bearing in mind as you explore this area of technical analysis.