There are several types of horizontal inflection points that can be employed in forex technical analysis. Among these, the most common ones are the psychological round numbers, which tend to hold well as support or resistance for major currency pairs and yen pairs.
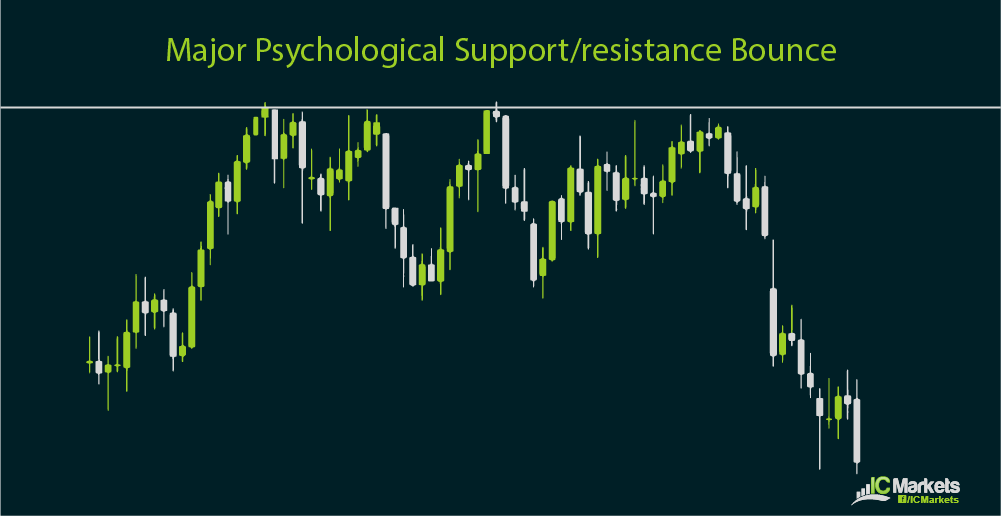
Major psychological levels refer to price levels ending in 00, such as 1.3400 for EUR/USD or 95.00 for USD/JPY. Generally speaking, the more zeroes at the end of the price level tends to result in a stronger inflection point. For instance, 100.00 holds as a strong support or resistance level for USD/JPY while parity or 1.0000 tends to elicit a bounce from AUD/USD or USD/CAD.

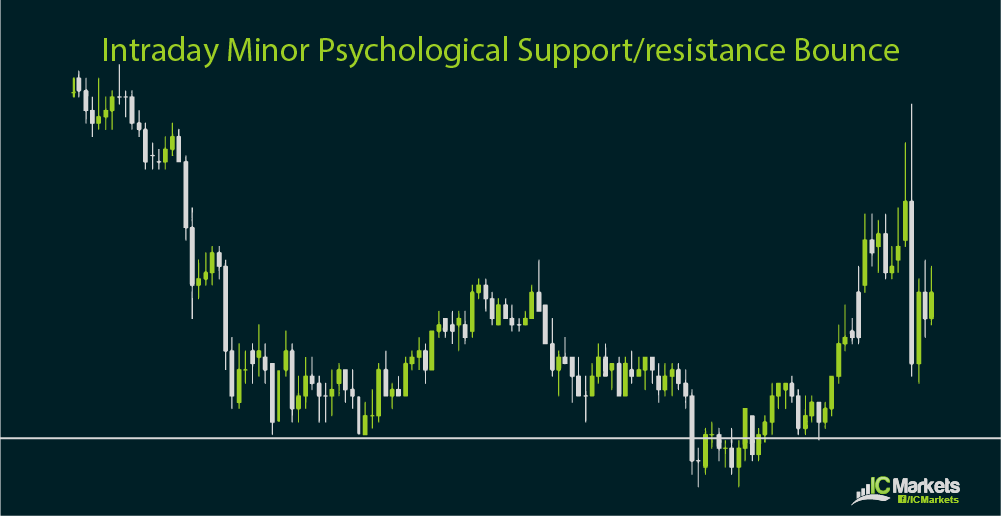
Minor psychological levels are those that end in 50, such as 1.6550 for GBP/USD or 171.50 for GBP/JPY. These tend to hold as intraday support or resistance, particularly when they line up with other kinds of inflection points and create what traders typically call a confluence.
Other kinds of intraday inflection points include the previous day high, low, open and close. The previous day high is usually treated as a resistance level for potential rallies, with an upside break acting as a signal that further gains are in the cards. The previous day low is usually considered a support level for potential price declines, with a downside break acting as a signal that further losses might take place.
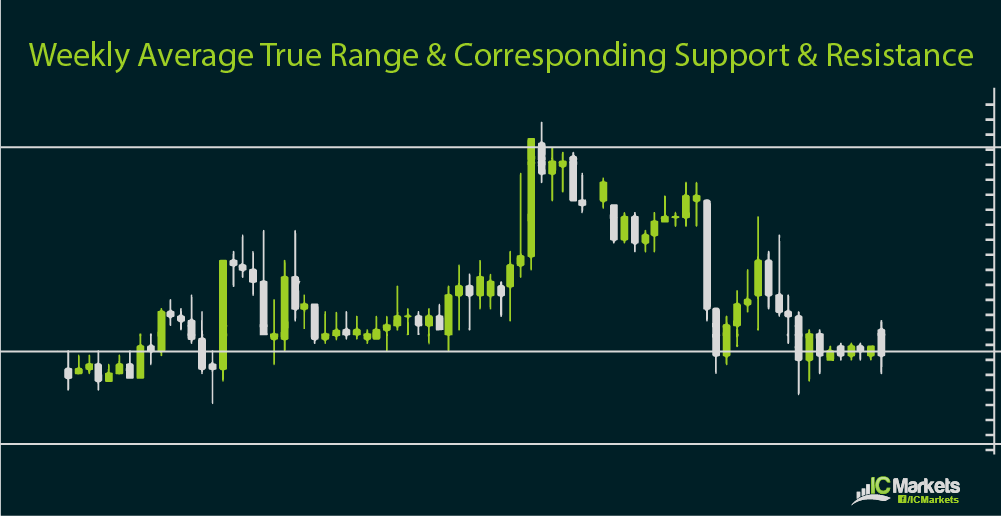
Average true ranges are also used in determining intraday inflection points, particularly among day traders or scalpers. The top and bottom daily average true range or ATR is calculated based on the average price movement per day for a specified number of days to be set by the trader. These usually act as support and resistance for the day, where price is expected to turn. A break above or below these levels could be indicative of stronger rallies or selloffs.
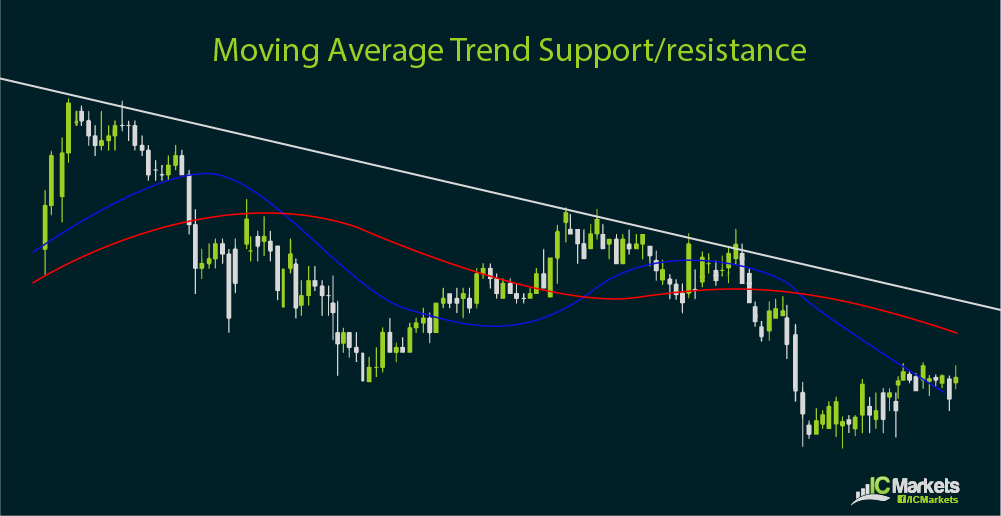
As mentioned in the previous section, technical indicators such as moving averages can also be treated as support and resistance. In particular, the 200 SMA or simple moving average on the daily time frame is usually considered support or resistance, depending on how the trend is going. During an uptrend, price is expected to bounce off the 200 SMA while a market downtrend could see the price bounce below the 200 SMA.
Bollinger bands can also serve as dynamic inflection points, with the upper band serving as resistance and the lower band acting as support. Just as with other types of inflection points, a break above the resistance could be a signal for more gains while a break below the support could indicate further losses.
Trend lines, uptrend and downtrend channels, as well as pivot points can also serve as support and resistance. These inflection points are determined mostly based on past price action, with trend lines and channels created by connecting the recent highs and/or lows of price action and pivot points calculated using formulas incorporating the open, high, low, and close for the previous period. Details for these kinds of inflection points are covered in the next sections.


