
Defined in the October 1980 issue of Commodities magazine (now known as Futures magazine) by mathematician Donald Lambert, the Commodity Channel Index, or CCI, is a momentum oscillator – momentum measures the rate of change of a financial instrument.
Since its inception, the indicator increased in popularity and is now a common tool for traders in financial markets. The original goal of Lambert’s CCI was to alleviate timing challenges in entering cyclical or seasonal commodity markets, though has since been adapted for use in other markets.
The indicator’s primary use within the field of technical analysis is identifying overbought and oversold phases. The CCI takes the change in price and compares that to its average change in price, consequently creating positive and negative values that oscillate above and below a zero Line. Generally, a value of +100 echoes an overbought reading, whereas -100 suggests oversold conditions. In spite of this, it’s important to note overbought and oversold thresholds vary depending on the financial instrument’s volatility.
Figure 1.1 shows the EUR/JPY M30 chart with the CCI indicator applied:
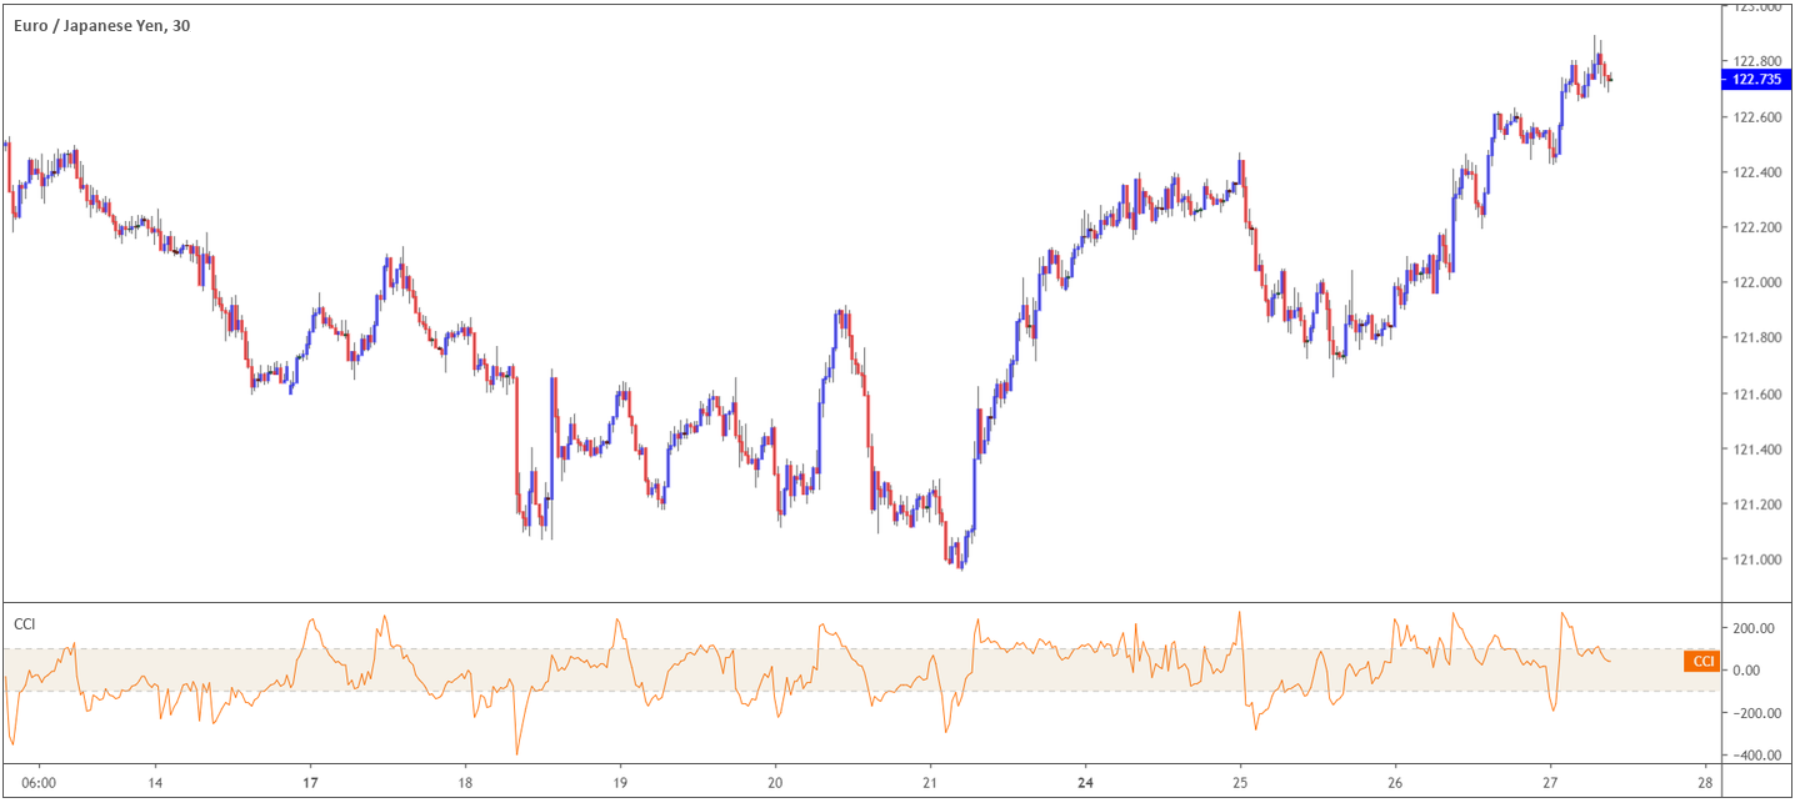
(Figure 1.1)
CCI calculation
Technological developments have made CCI calculation automatic on the majority of trading platforms, far removed from the days of having to perform the calculation manually.
While most will rely on the platform’s calculating capabilities, it’s always beneficial to have some idea of the data that goes into the calculation.
In general, the CCI measures the current price level relative to an average price level over a given period of time. The indicator registers a high value upon price action trading beyond its average, and a low value in response to the unit trading below the average.
The calculation:
CCI = (Typical Price – (20-period SMA of Typical Price) / (.015 * MD).
Where:
- Typical Price = (high + low + close) /3.
- SMA = Simple Moving Average.
- .015 = Lambert’s standard divisor (using this the majority of CCI values will fall within the +100 to -100 range.
- MD = Mean Deviation of N periods of recent typical prices.
Using the CCI in your trading
Overbought and oversold:
As highlighted above, the CCI’s primary use is to identify overbought and oversold conditions. Traders can scan overbought levels beyond +100 and oversold levels below -100. These values, nonetheless, can be adjusted depending on the volatility of the market traded – using +200 and -200 is certainly an option. It is also worth noting the CCI is an unbounded oscillator, meaning no cap on upside or downside movement.
Consider the following basics concerning overbought and oversold parameters:
- When price crosses beyond the pre-determined overbought/oversold threshold, a price correction may eventually take shape.
- As with many oscillators during a trending phase, price action crossing above/below overbought/oversold levels in line with the trend can suggest strength. In the case of an uptrend and the CCI crossing above its overbought value, attempting to sell into the trend – a countertrend trade – is a chancy move.
Figure 1.1 displays the CCI with +100 and -100 values applied, whereas figure 1.2 illustrates the CCI with a wider +200/-200 range.
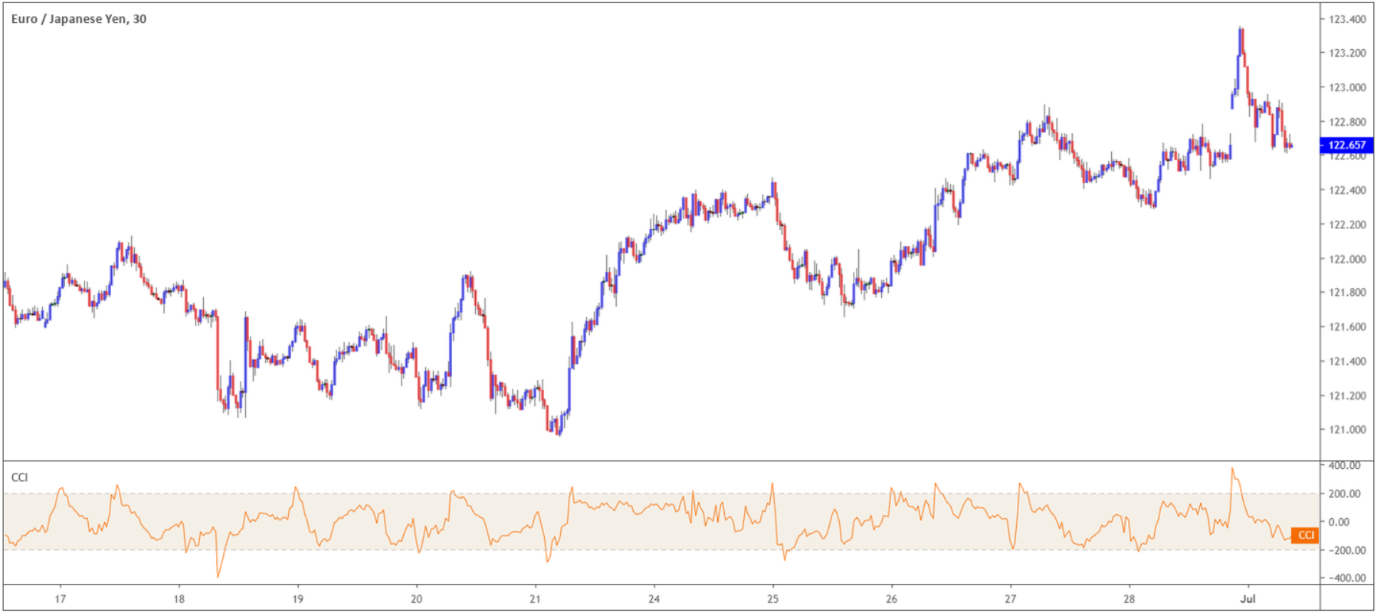
(Figure 1.2)
Divergence:
Momentum – force of buying/selling pressure – can precede price action. In other words, expect a fresh price high to form following a new momentum high reading on momentum indicators.
As with the majority of momentum-based technical indicators, such as the MACD (Moving Average Convergence Divergence) and the RSI (Relative Strength Index), divergence is a critical element and should not be overlooked as it can forecast potential changes in the underlying trend.
Figure 1.3 represents positive divergence. This happens when the CCI posts a fresh higher low that is not confirmed in price action. This is a bullish signal and could be a sign of an impending price reversal to the upside.
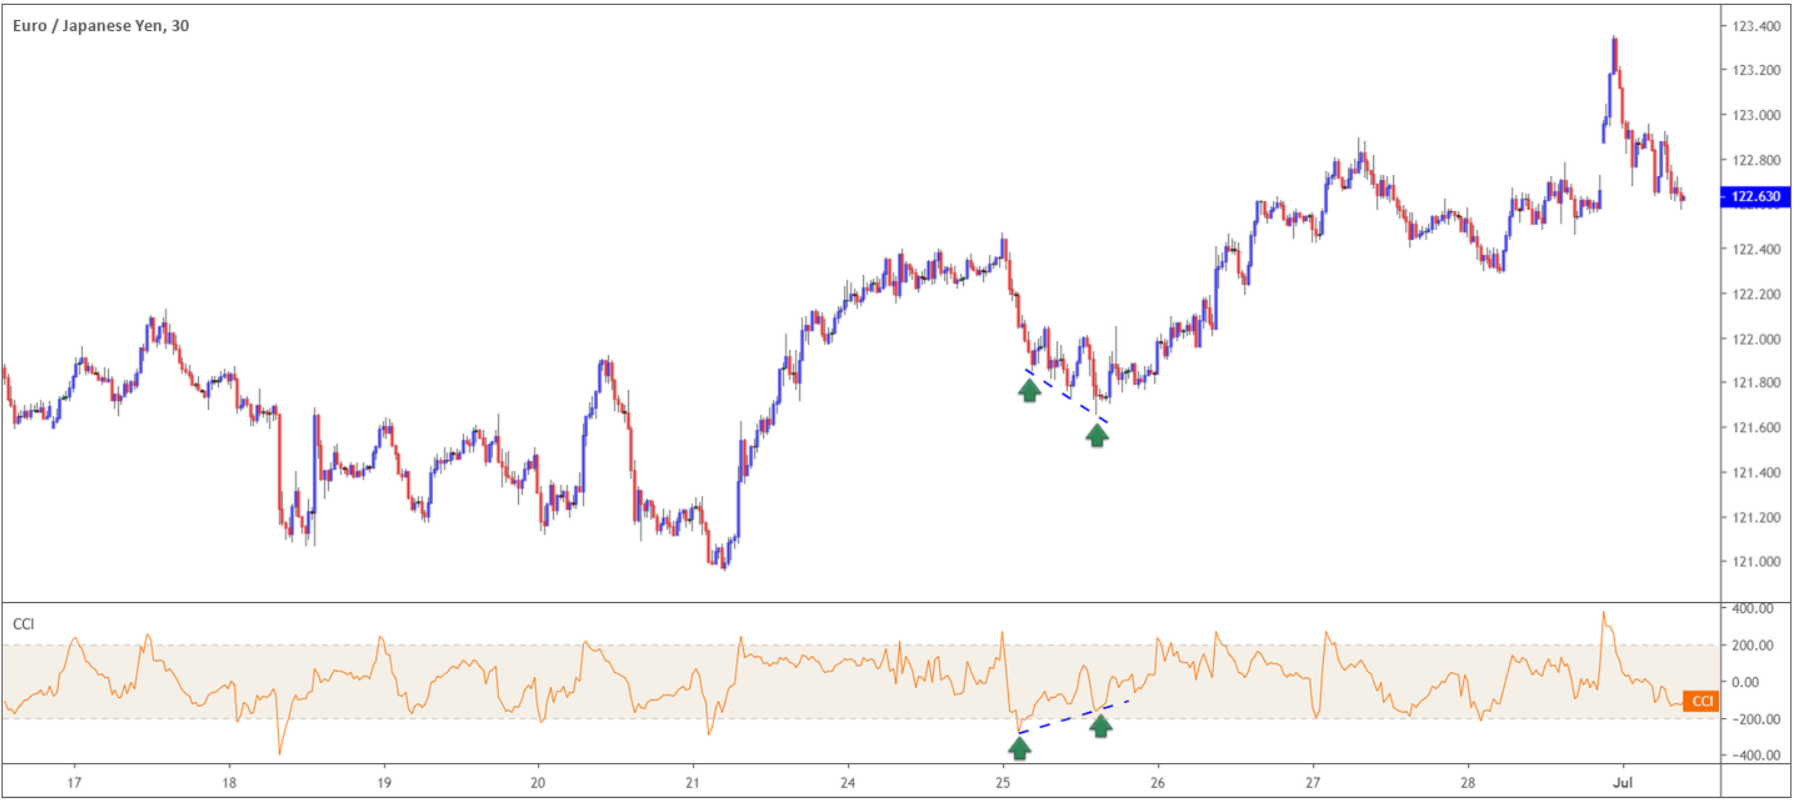
(Figure 1.3)
Figure 1.4 reveals a market producing negative divergence (red line). Note although price action printed a fresh high, the CCI failed to follow suit, signifying a possible correction to the downside.
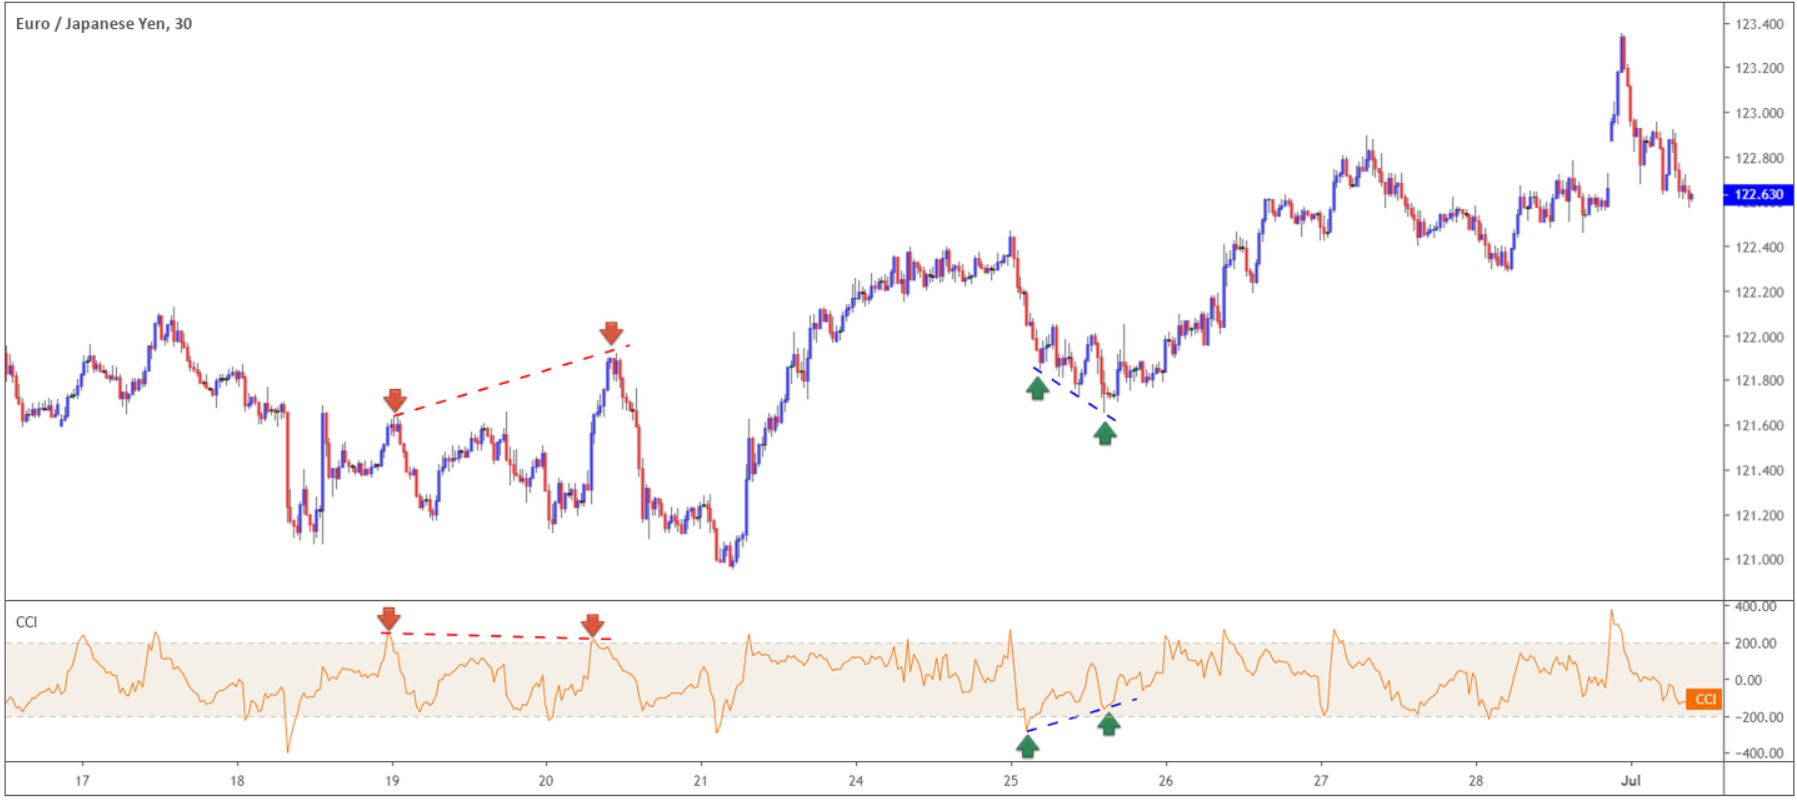
(Figure 1.4)
Limitations of the Commodity Channel Index
- It’s a lagging indicator – it follows price action and therefore turns after price has made its move. A rally to 100, signalling to a potentially fresh trend may occur too late, as price produced its run and could be starting to correct already.
- Overbought and oversold limits on the CCI is subjective as the indicator has an unbounded display. Remember, it is worth adjusting the values between +100/+200 – -100/-200 in volatile markets.
Notes:
- Charts provided by Tradingview.com.