
Key risk events today:
US and Canada Jobs Data.
(Previous analysis as well as outside sources – italics).
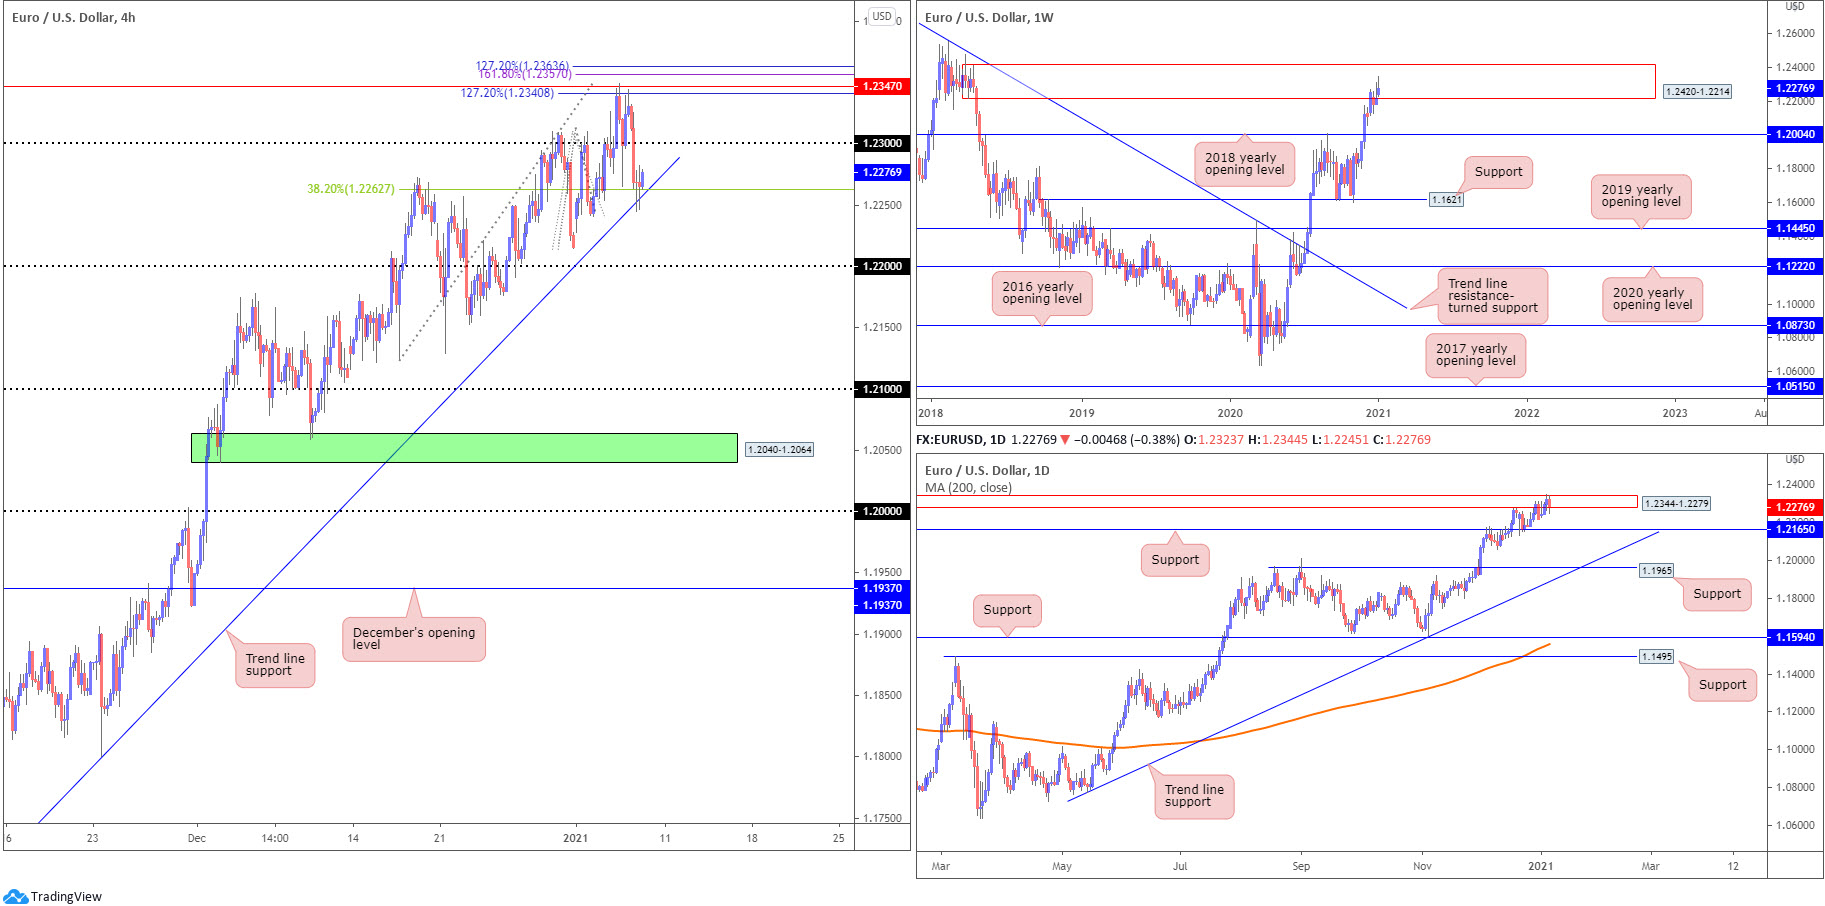
EUR/USD:
In terms of macroeconomic data, US unemployment claims rose 787k, while the US ISM services PMI came in strongly above expectations at 57.2. It should also be pointed out the US dollar index outperformed, weighing on any EUR/USD upside.
Technical action reveals H4, yet again, reacting from resistance at 1.2347, a level supported by a number of key Fibonacci levels (1.2363/1.2340). This sent H4 candles through 1.23 to shake hands with trend line support, extended from the low 1.1602, and merging 38.2% Fibonacci retracement ratio at 1.2262.
The weekly timeframe remains within the walls of supply at 1.2420-1.2214, though current action trades significantly off best levels right now. Should sellers take the reins, the 2018 yearly opening value at 1.2004 is likely a level downside movement may target. In terms of trend, however, upside remains favoured (the pair has been trending higher since late March) – more so if price overthrows the 1.2555 February 12 high (2018).
From the daily timeframe, supply at 1.2344-1.2279 (nestled within the walls of weekly supply mentioned above at 1.2420-1.2214) remains a point of interest. Breaking above daily supply advertises higher moves within current weekly supply. Daily support at 1.2165 is also in sight in the event the pendulum swings south.
Areas of consideration:
- Trend line support, extended from the low 1.1602, and merging 38.2% Fibonacci retracement ratio at 1.2262. Although entering long from here faces weekly and daily supply areas, the uptrend in this market is remarkably robust at the moment.
- A H4 close through the aforementioned H4 trend line support may be interpreted as a bearish signal, targeting 1.22.
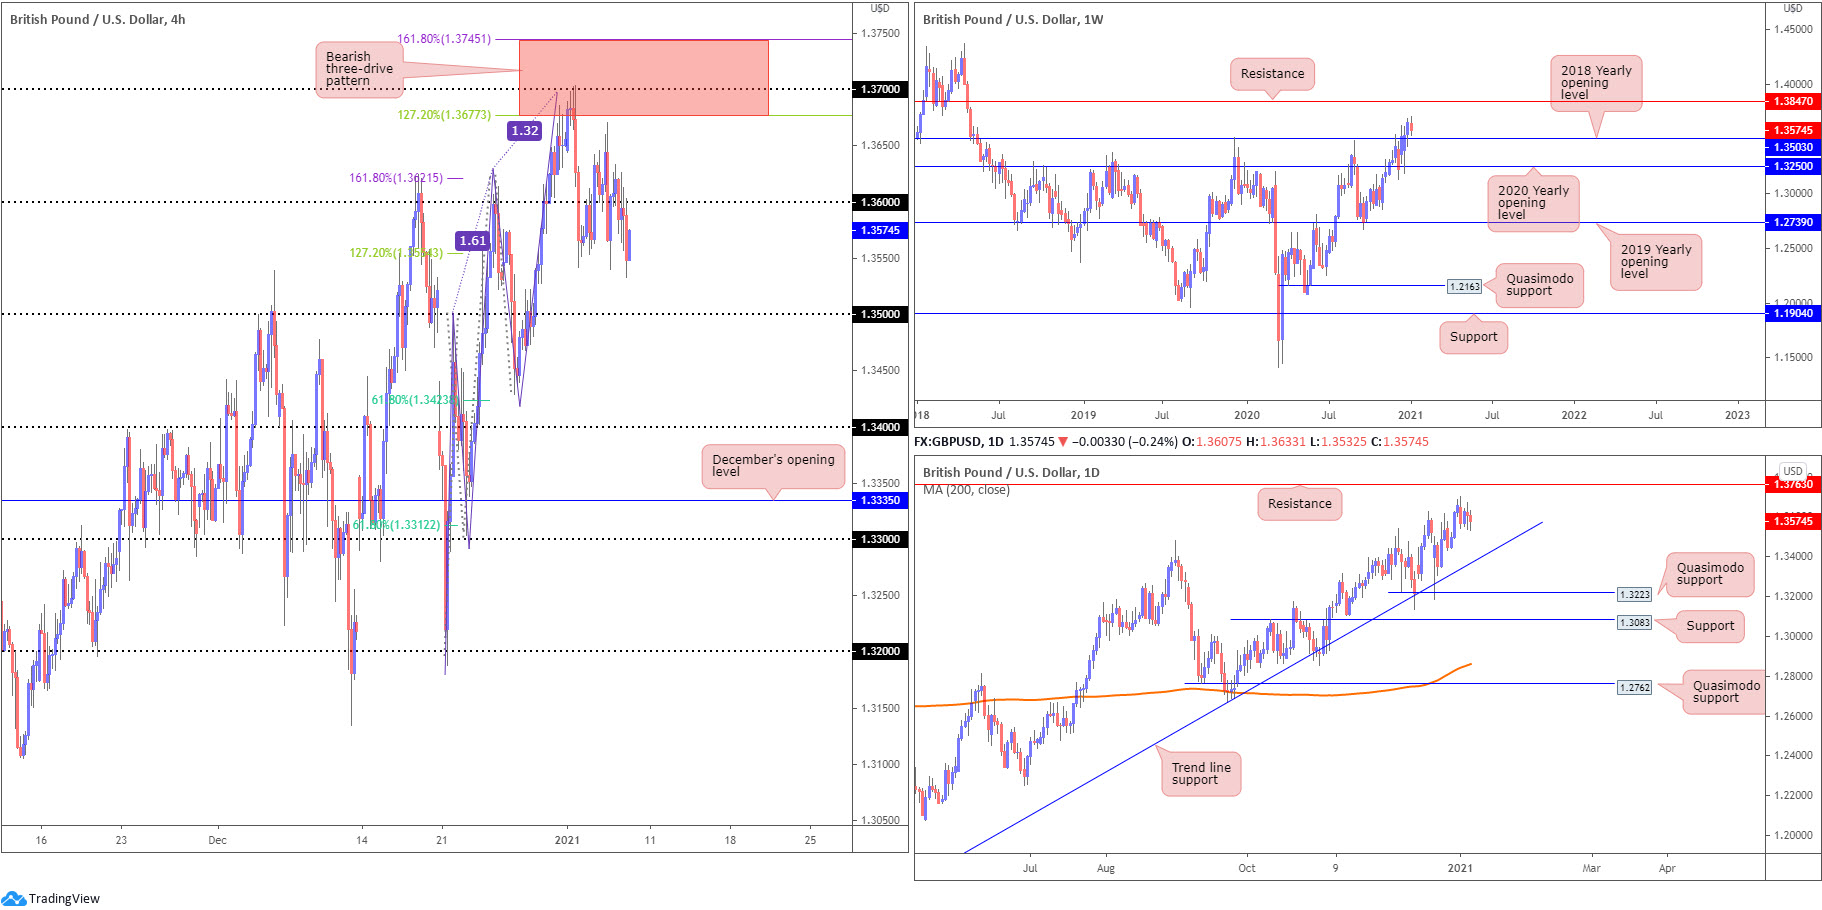
GBP/USD:
Recent hours observed sterling chalk up fresh weekly troughs as the US dollar index printed modest recovery gains a touch above multi-year lows. Particularly for sellers short Monday’s test of 1.37 (surrounded by a three-drive bearish formation, with a termination zone between the 161.8%/127.2% Fibonacci projection points at 1.3745 and 1.3677, respectively), Thursday’s downside momentum is likely a welcomed sight.
H4 support next on tap is likely to form around the 1.35 area, though price appears poised to retest the recently broken 1.36 base.
Further out on the weekly timeframe, price currently fades 2021 yearly peaks at 1.3703, on track to possibly cross swords with support at 1.3503, the 2018 yearly opening value. To the upside, resistance at 1.3847 is on the radar. Also of technical interest is a recent engulf of 1.3514 (December 9 [2019] high), helping to confirm the current uptrend. From the daily timeframe, price is seen hovering between 1.3763 resistance (previous Quasimodo support level) and trend line support, etched from the low 1.1409.
Areas of consideration:
- The 1.36 area is a zone to be watchful of as possible resistance.
- 35 stands as potentially strong support, merging with weekly support at 1.3503.
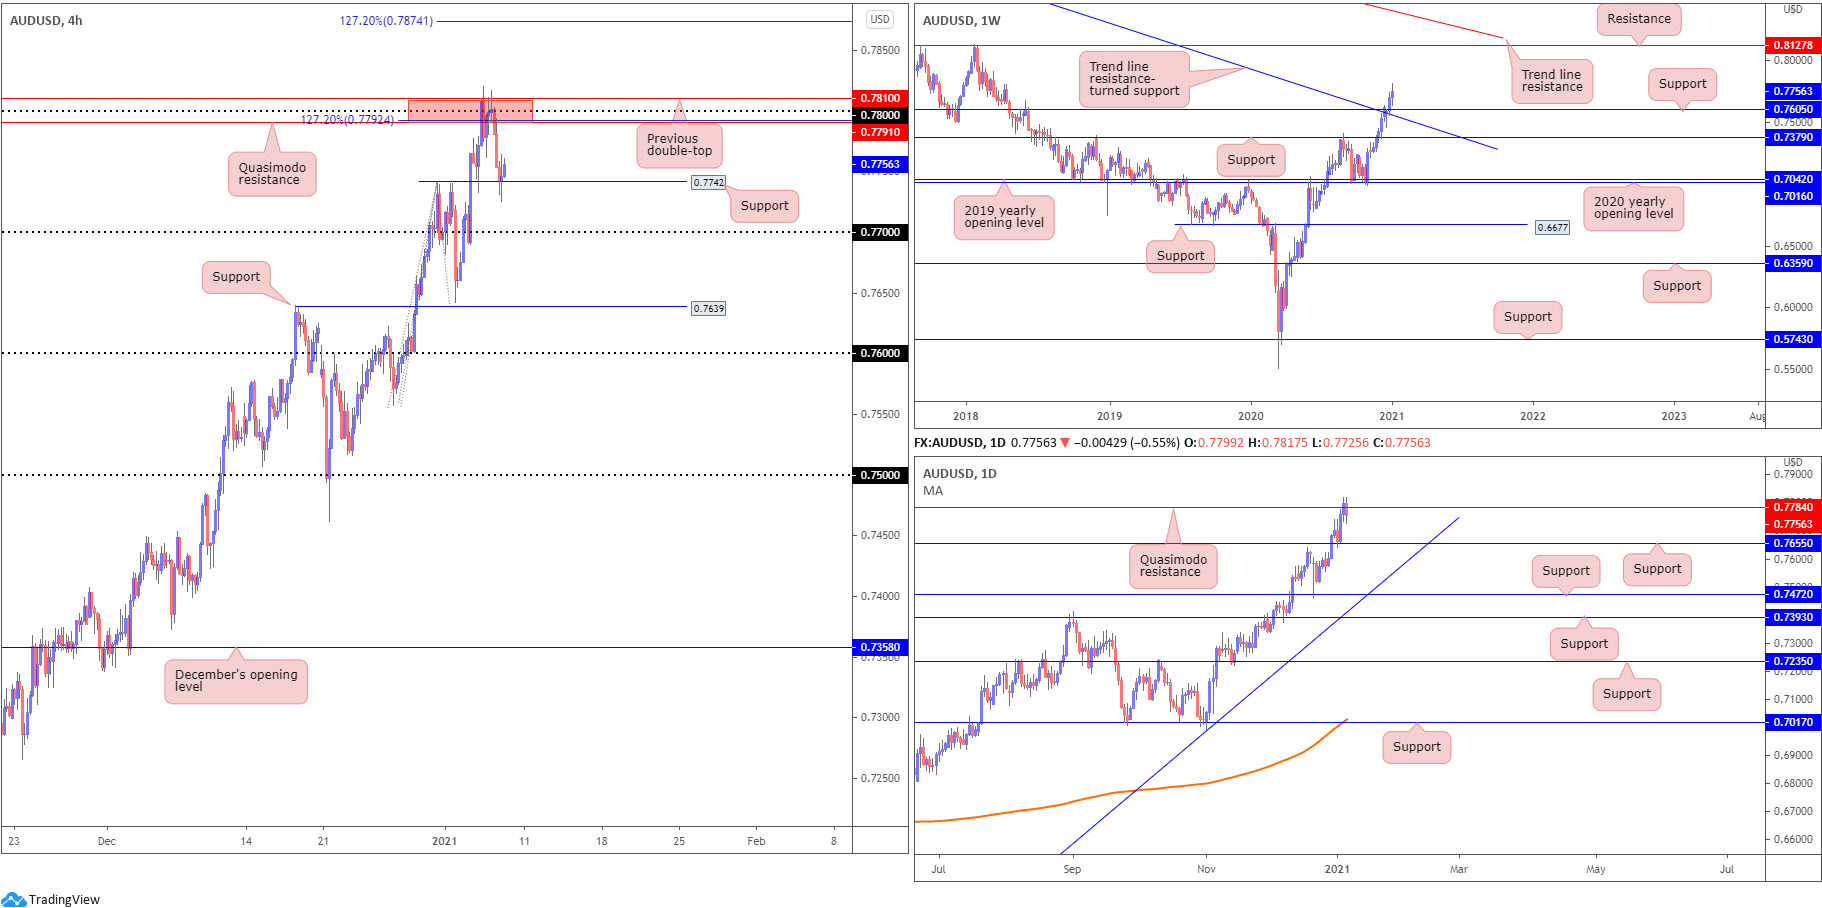
AUD/USD:
AUD/USD absorbed nearby bids Thursday amidst DXY recovery momentum. This guided H4 price movement back to support at 0.7742 (previous swing high). Overthrowing the aforementioned support shines the spotlight on the 0.77 figure. Overhead, resistance between 0.7810/0.7791 (a previous double-top and a Quasimodo resistance), which happens to house the 0.78 figure and a 127.2% Fibonacci projection point at 0.7792, remains a key talking point in this market.
The weekly timeframe’s technical landscape remains optimistic, albeit modestly off weekly highs. In recent analysis, research underlined that price glided through Quasimodo resistance at 0.7605 (now serving support) and trend line resistance, taken from the high 1.1065, to end 2020. This places buyers in a strong position into 2021 with room to possibly reach as far north as resistance coming in at 0.8127.
From the daily timeframe, Quasimodo resistance at 0.7784 took on buyers Wednesday and reacted Thursday, trimming the recent two-day bullish phase. Holding this level throws support back in the mix at 0.7655, while rupturing the aforesaid resistance helps confirm the upside bias witnessed on the weekly timeframe.
Areas of consideration:
- Overall, the AUD/USD’s technical trend is pointing north.
- Buyers appear somewhat hesitant off H4 support at 0.7742, possibly due to the recent reaction from daily Quasimodo resistance at 0.7784 and 0.78 figure resistance on the H4. 0.77 support is next in line should 0.7742 cave.
- 78 remains a resistance to be watchful of, converging with additional H4 resistances and the aforementioned daily Quasimodo resistance.
- Conquering 0.78 is likely to welcome additional buying, in line with the weekly timeframe’s bullish trajectory.
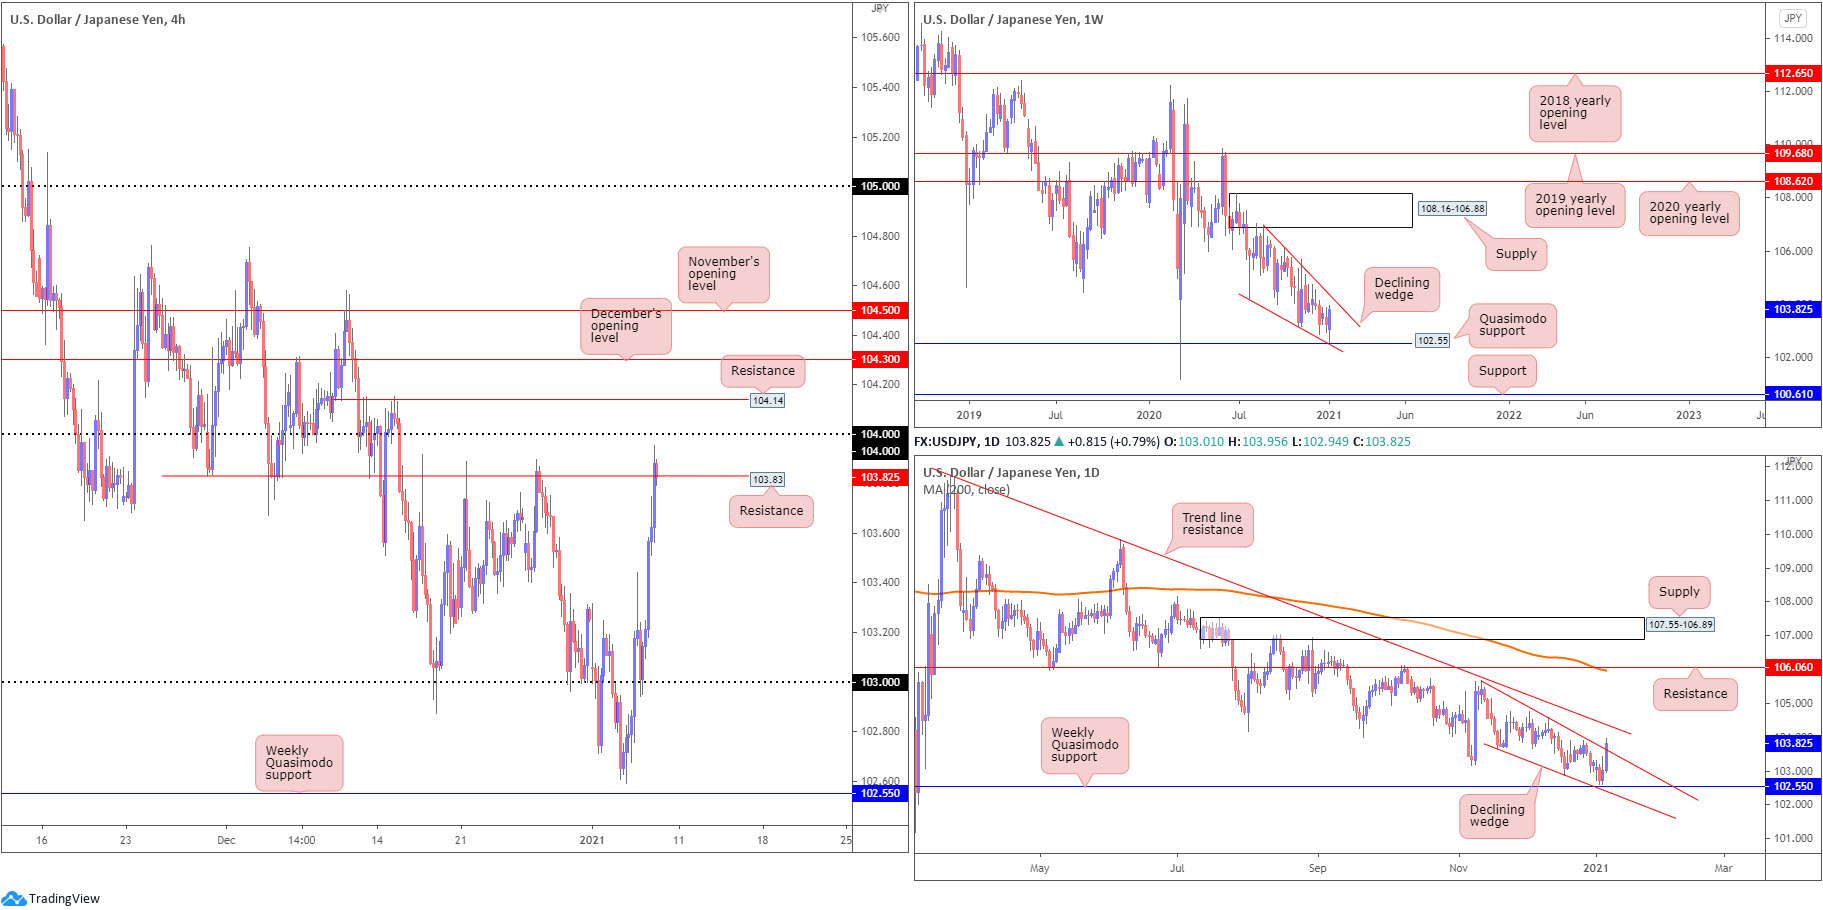
USD/JPY:
Global equities rallied Thursday, promoting a broad risk-on scenario – one of the factors behind USD/JPY rallying Thursday as traders unloaded safe-haven Japanese yen and Swiss franc. Another factor, of course, was the US dollar index pencilling in a recovery ahead of multi-year troughs.
USD/JPY was essentially a one-sided market yesterday, recently climbing to resistance at 103.83 on the H4 scale, a level planted just south of the 104 figure. Traders will also acknowledge additional resistance at 104.14 and December’s opening value from 104.30.
Out of the weekly chart, price remains encased within a declining wedge, extended from 106.94/104.18. The unit also rebounded a few pips north of Quasimodo support at 102.55. A closer reading of price action on the daily timeframe has the pair pursuing space above the upper edge of a declining wedge formation, taken from 105.67, threatening moves to trend line resistance, from 111.71.
Areas of consideration:
- The break of the daily declining wedge could spark follow-through buying to daily trend line resistance, a descending level aligning closely with the upper edge of the weekly declining wedge pattern.
- A bullish theme is present in the short term it appears; resistance is likely to develop between December’s opening value at 104.30 and the 104 figure on the H4.
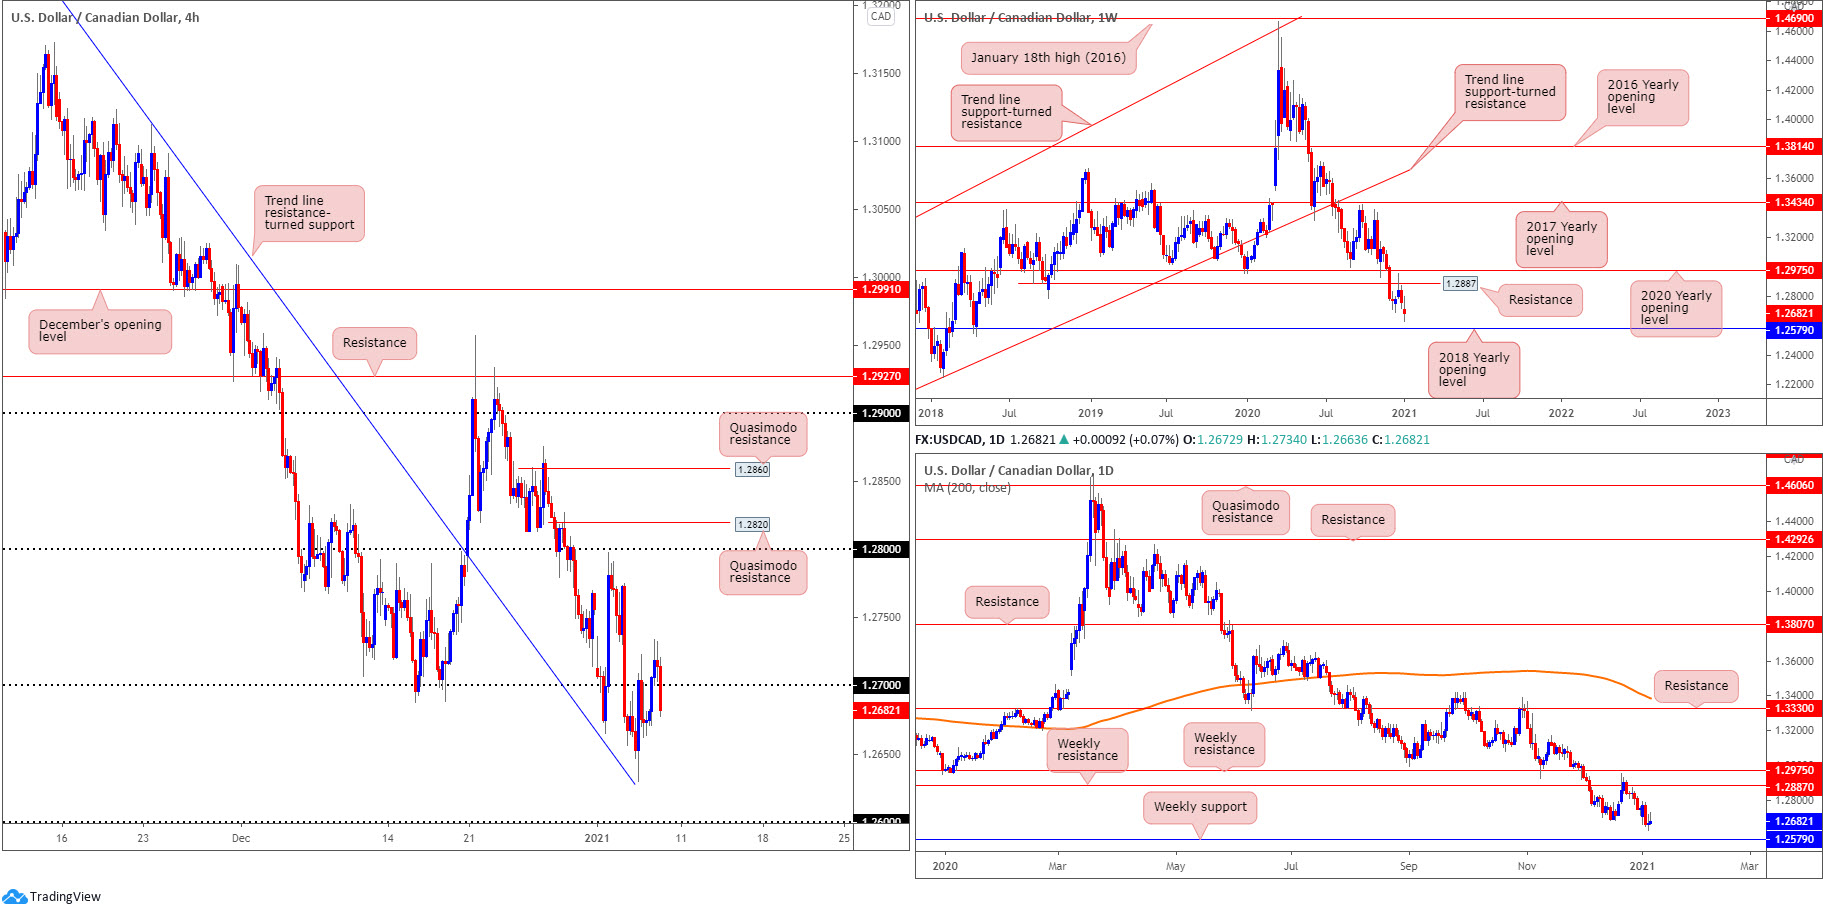
USD/CAD:
Out of the weekly timeframe this morning, we can see price action striving to reach support at 1.2579, the 2018 yearly opening value. This follows December’s retest at resistance from 1.2887 (previous Quasimodo support level). It is also evidently clear from this timeframe the pair has been under pressure since topping at 1.4667 in March 2020. There’s not much to add from the daily scale as the weekly levels also remain active on this timeframe.
Modest WTI gains (testing highs at $51.26 a barrel) weighed on USD/CAD in recent hours, elbowing the pair back under 1.27 in strong fashion. Holding south of this level throws multi-year lows back on the scene at 1.2630 and the 1.26 figure (H4), sited just north of the weekly support level mentioned above at 1.2579.
Areas of consideration:
- All three timeframes, according to the technical studies presented above, exhibit bearish posture.
- The break of 1.27 on the H4 likely brought with it breakout selling. A retest at the underside of 1.27, therefore, could offer an additional bearish scenario, targeting 1.2630 and 1.26. Ultimately though, traders are likely eyeing weekly support around 1.2579.
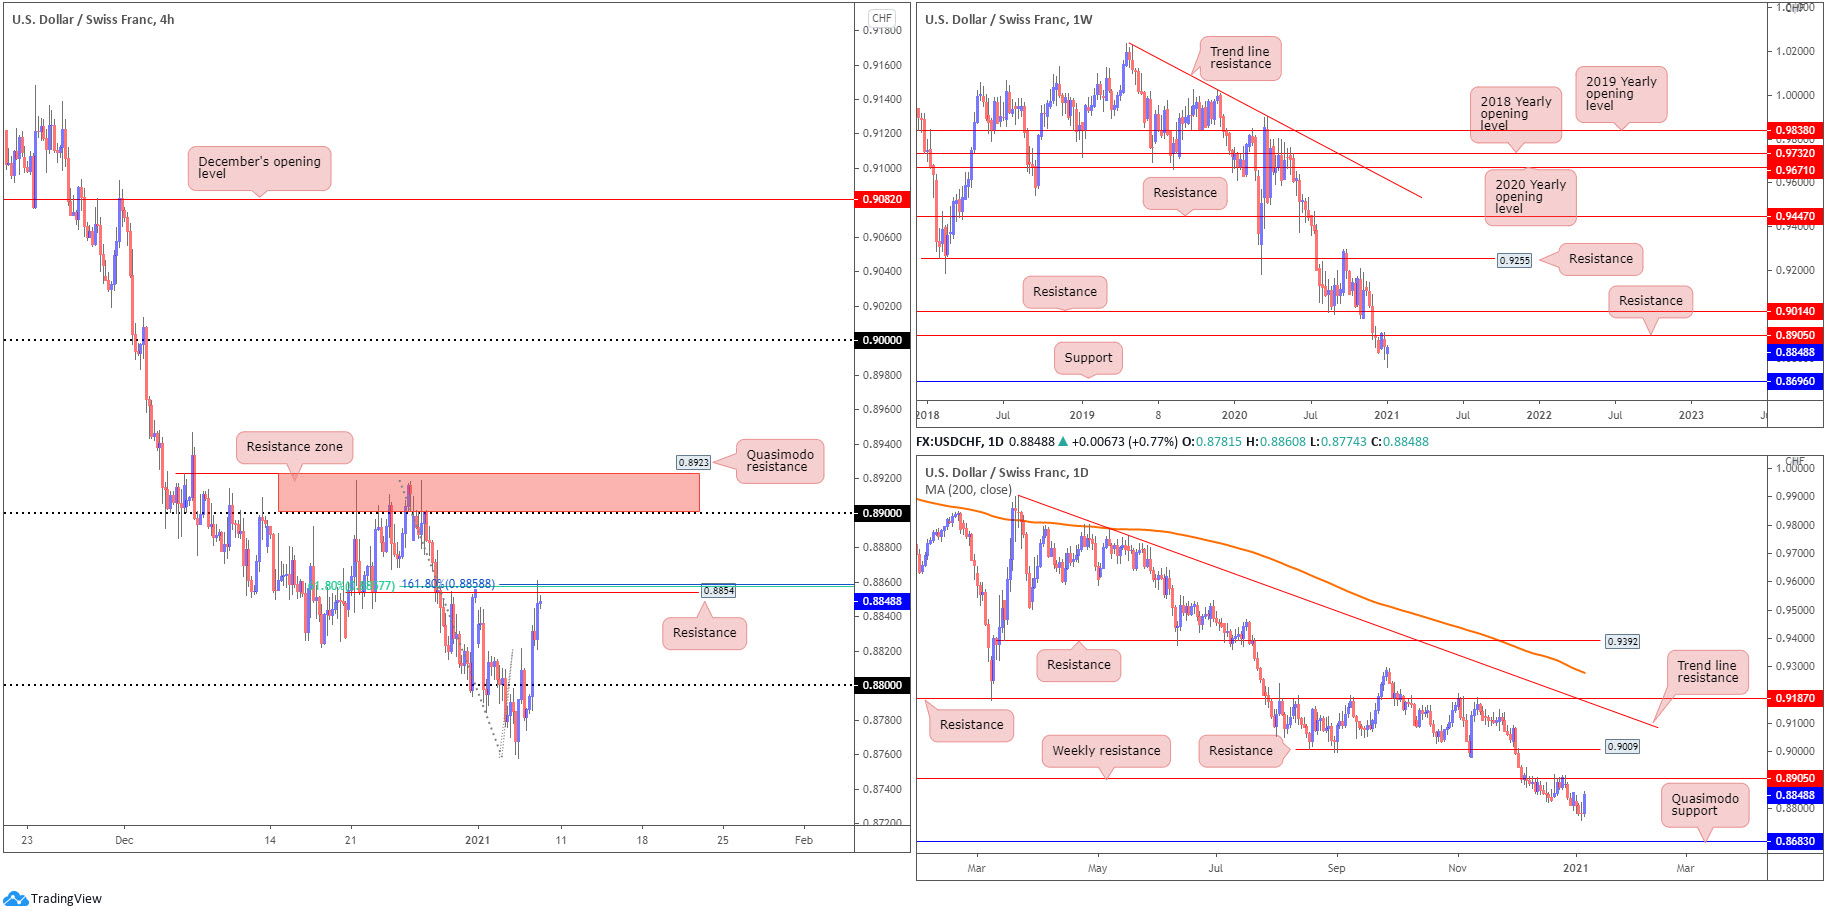
USD/CHF:
The broadly risk-on environment watched USD/CHF reclaim 0.88+ status Thursday and ultimately shake hands with H4 resistance coming in at 0.8854, a level converging with a 61.8% Fibonacci retracement ratio at 0.8857 as well as a 161.8% Fibonacci extension point at 0.8858. Conquering the aforementioned resistance could see buyers strengthen their grip and lock horns with the 0.89 figure and 0.8923 Quasimodo resistance level.
The weekly timeframe, assuming additional bullish flow materialises, could butt heads with resistance at 0.8905 (merges with the H4 resistance zone highlighted above between 0.8923/0.89). A similar picture is visible on the daily scale – the only notable difference being is Quasimodo support at 0.8683 serves as the next downside target, situated a touch beneath the weekly support at 0.8696.
Areas of consideration:
- H4 resistance at 0.8854, dovetailing closely with two key Fibonacci levels (commonly referred to as the Golden Ratio).
- H4 resistance zone at 0.8923/0.89 is an area to be conscious of, having noted weekly resistance converging with the base at 0.8905.
- An intraday bullish scenario may occur should a H4 close form north of 0.8854, targeting 0.89.
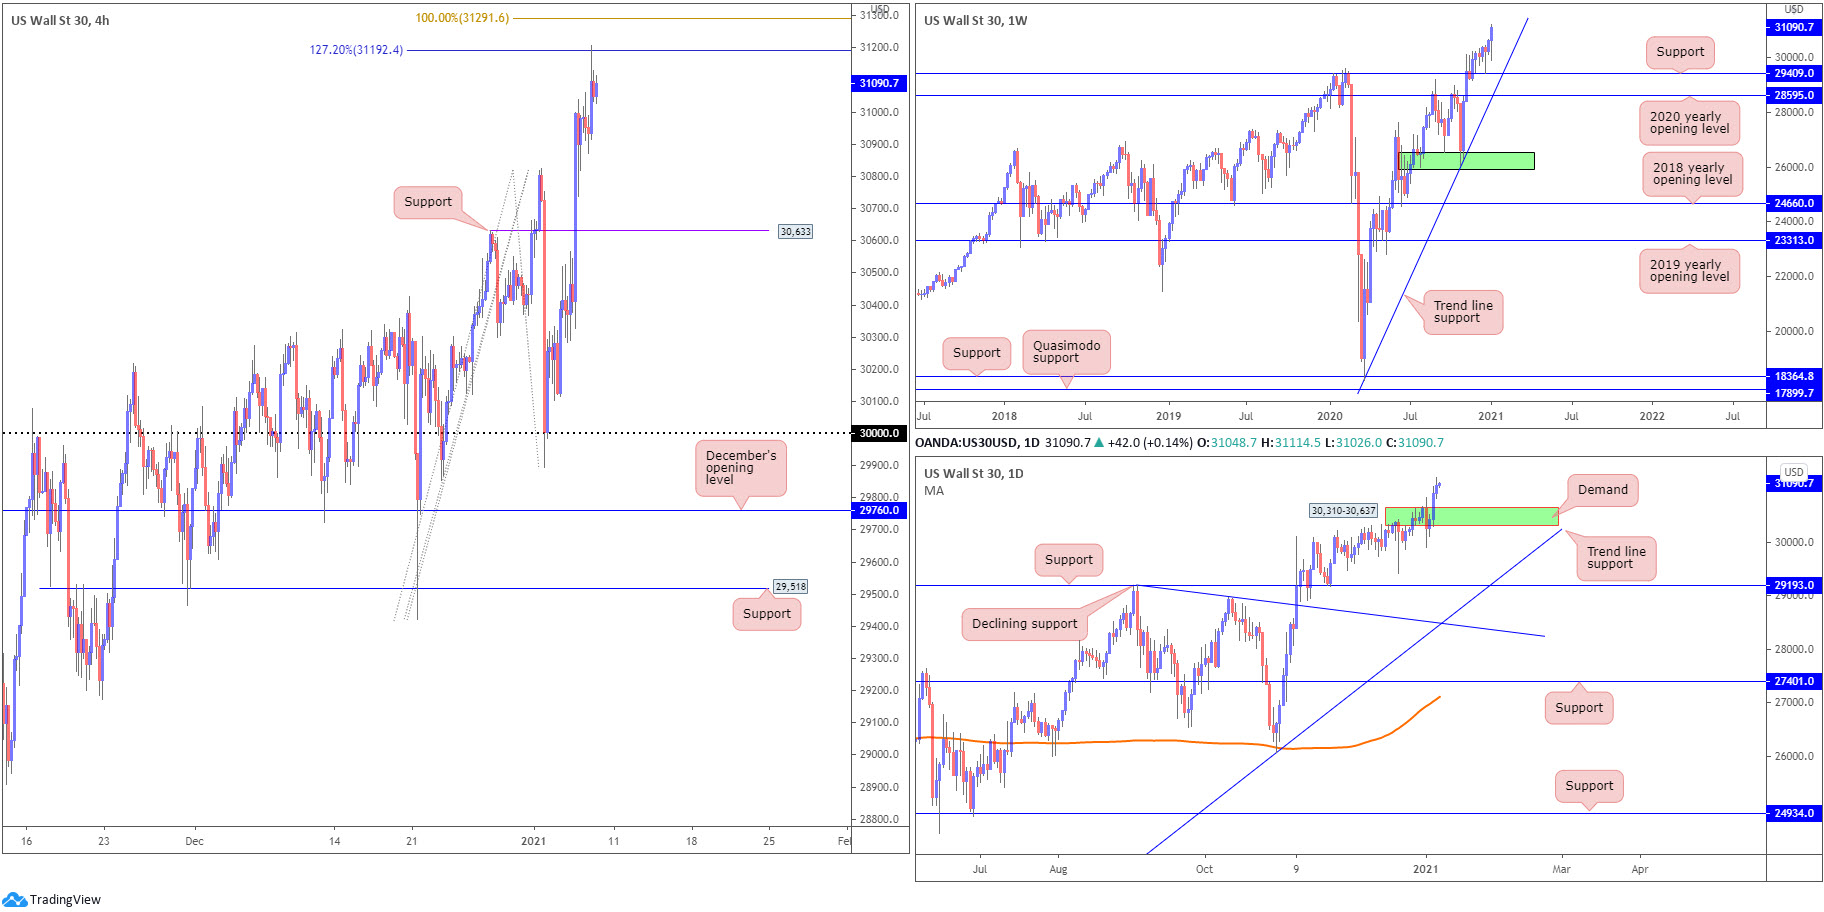
Dow Jones Industrial Average:
The Dow Jones Industrial Average added 211.73 points, or 0.69%; the S&P 500 advanced 55.65 points, or 1.48% and the Nasdaq advanced 326.69 points, or 2.56%.
Reaching fresh all-time highs, the DJIA ran into a 127.2% Fibonacci projection point at 31,192, sited just south of a 100% Fibonacci extension level at 31,291. To the downside, H4 support resides at 30,633, a previous Quasimodo resistance level.
From the weekly timeframe, support at 29,409 (previous Quasimodo resistance) remains in view, as does trend line support, extended from the low 18,213. A closer reading of price action on the daily timeframe reveals demand is centred nearby at 30,310-30,637.
Areas of consideration:
- A correction could retreat as far south as H4 support at 30,633, a level plotted within the upper range of daily demand at 30,310-30,637. Therefore, this is likely an area dip-buyers may find interest in.
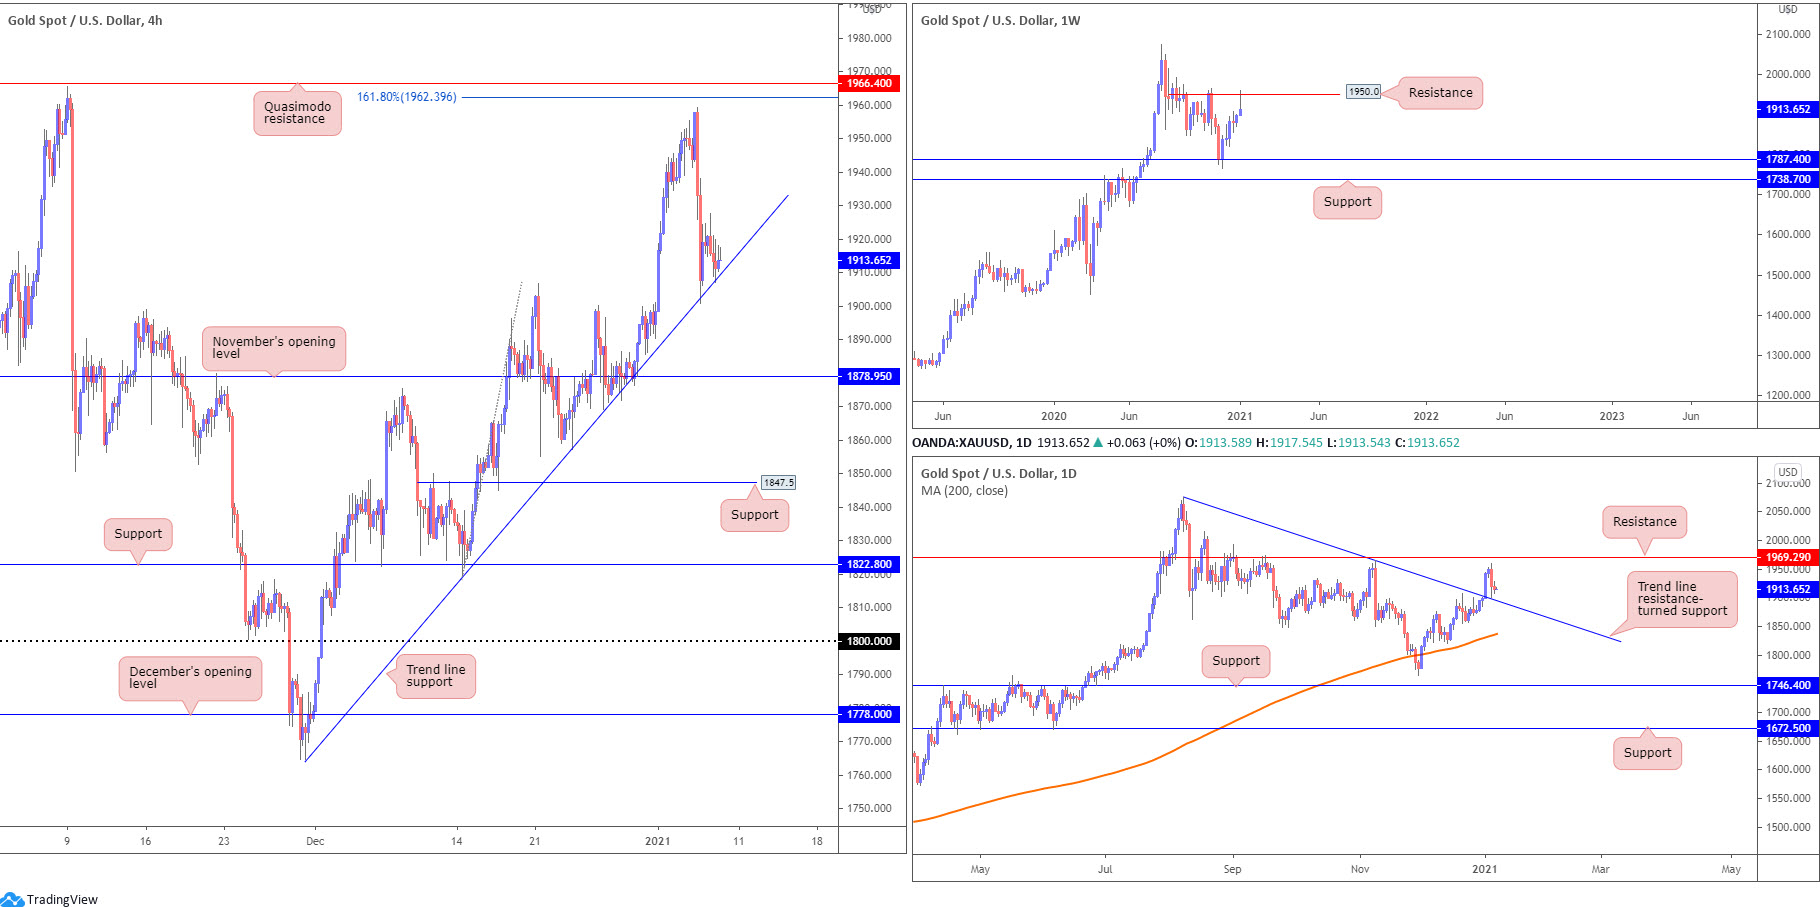
XAU/USD (GOLD):
Spot gold was relatively subdued on Thursday, despite healthy USD upside, as measured by the US dollar index.
H4 trend line support, extended from the low $1,764, remains active. Upside attempts from this area could throw Quasimodo resistance at $1,966 and the 161.8% Fibonacci projection point at $1,962 back in the limelight. South of the noted trend line support places November’s opening value at $1,878 in view as the next downside target.
Weekly price recently cross swords with resistance at $1,950 and is on track to form a shooting star candle. A break here perhaps unlocks access to all-time peaks at $2,075. In terms of trend, the weekly timeframe shows we’ve been higher since early 2016.
A closer examination of price action on the daily chart reveals the metal retested trend line resistance-turned support, taken from the high $2,075, leaving resistance at $1,969 unchallenged.
Areas of consideration:
- Weekly resistance at $1,950 suggests sellers want to keep things lower, yet H4 and daily price retesting trend line supports suggest otherwise. Given the current uptrend, weekly selling is unlikely to deliver much to get excited about, therefore buyers potentially have the upper hand here.
The accuracy, completeness and timeliness of the information contained on this site cannot be guaranteed. IC Markets does not warranty, guarantee or make any representations, or assume any liability regarding financial results based on the use of the information in the site.
News, views, opinions, recommendations and other information obtained from sources outside of www.icmarkets.com.au, used in this site are believed to be reliable, but we cannot guarantee their accuracy or completeness. All such information is subject to change at any time without notice. IC Markets assumes no responsibility for the content of any linked site.
The fact that such links may exist does not indicate approval or endorsement of any material contained on any linked site. IC Markets is not liable for any harm caused by the transmission, through accessing the services or information on this site, of a computer virus, or other computer code or programming device that might be used to access, delete, damage, disable, disrupt or otherwise impede in any manner, the operation of the site or of any user’s software, hardware, data or property.


