
Key risk events today:
RBA Monetary Policy Statement; RBA Assist Gov Ellis Speaks; China Trade Balance; Canada Employment Change and Unemployment Rate; US Average Hourly Earnings m/m; US Non-Farm Employment Change; US Unemployment Rate.
(Previous analysis as well as outside sources – italics).
EUR/USD:
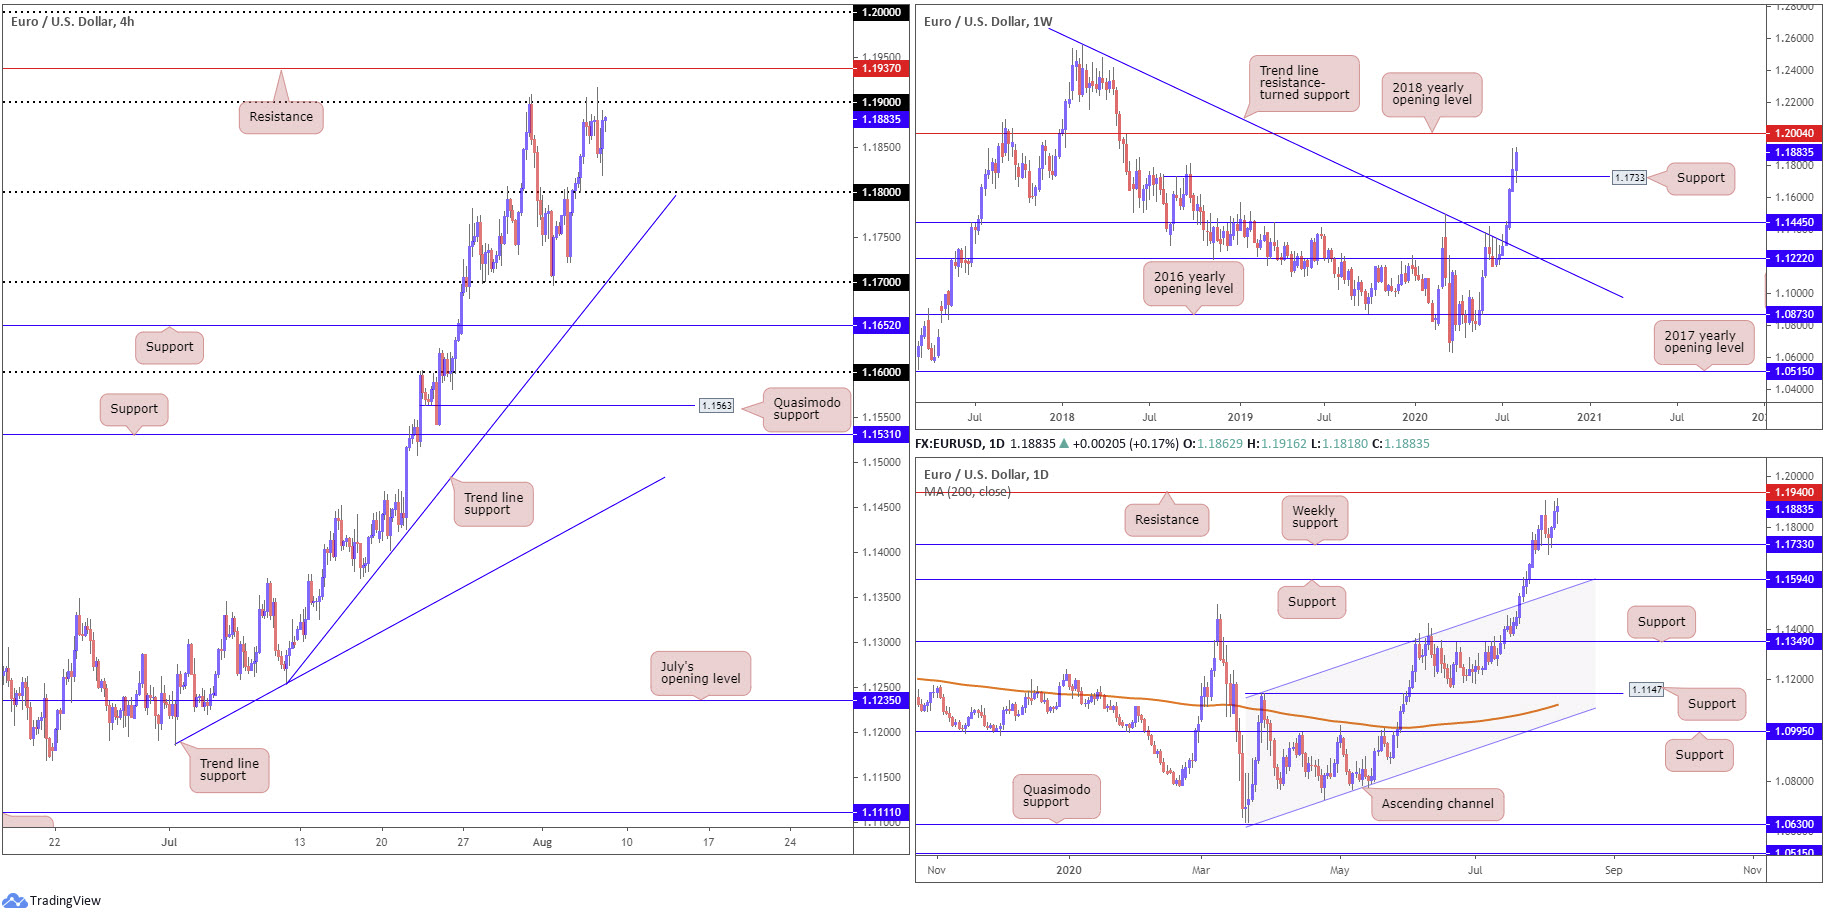
EUR/USD traded pretty much unchanged into US hours Thursday, marginally fading two-year highs as we look towards today’s non-farm payrolls data.
Following a knee-jerk break of the 1.19 area in wake of stronger-than-anticipated German industrial orders, H4 went forward and pulled in a session low at 1.1818, before returning to neutral price levels ahead of 1.19. In other news, US unemployment claims came in better than expected at 1,186,000, a decrease of 249,000 from the previous week’s revised level.
Weekly technical flow continues to find acceptance at higher levels, following the retest at 1.1733 support (prior Quasimodo resistance), perhaps targeting the 2018 yearly opening level at 1.2004. The story on the daily timeframe, also coming off weekly support at 1.1733, however, has price toying with levels just south of resistance parked at 1.1940.
Areas of consideration:
In light of Thursday’s lacklustre close, the technical outlook remains unchanged heading into Friday.
The break of weekly trend line resistance (July 13), taken from the high 1.2555, and violation of the 1.1495 March 9 high, reflects a long-term (potential) technical trend change.
Weekly structure points to additional bullish sentiment after retesting 1.1733 support, possibly providing fuel to take things to the key figure 1.20 on the H4 (weekly resistance resides at 1.2004). Before reaching this far north, though, buyers must contend with daily resistance at 1.1940 (and H4 resistance at 1.1937 sited just above 1.19).
The recent reaction from 1.19, although clipping lows at 1.1818, failed to turn the dial much by the close. A fakeout above 1.19 to daily resistance at 1.1940 is a possible route today, which could, given a H4 close back beneath 1.19, chalk up an intraday countertrend signal.
Breaking 1.1940, however, will help confirm upside to the 1.20 level and possibly promote bullish scenarios.
GBP/USD:
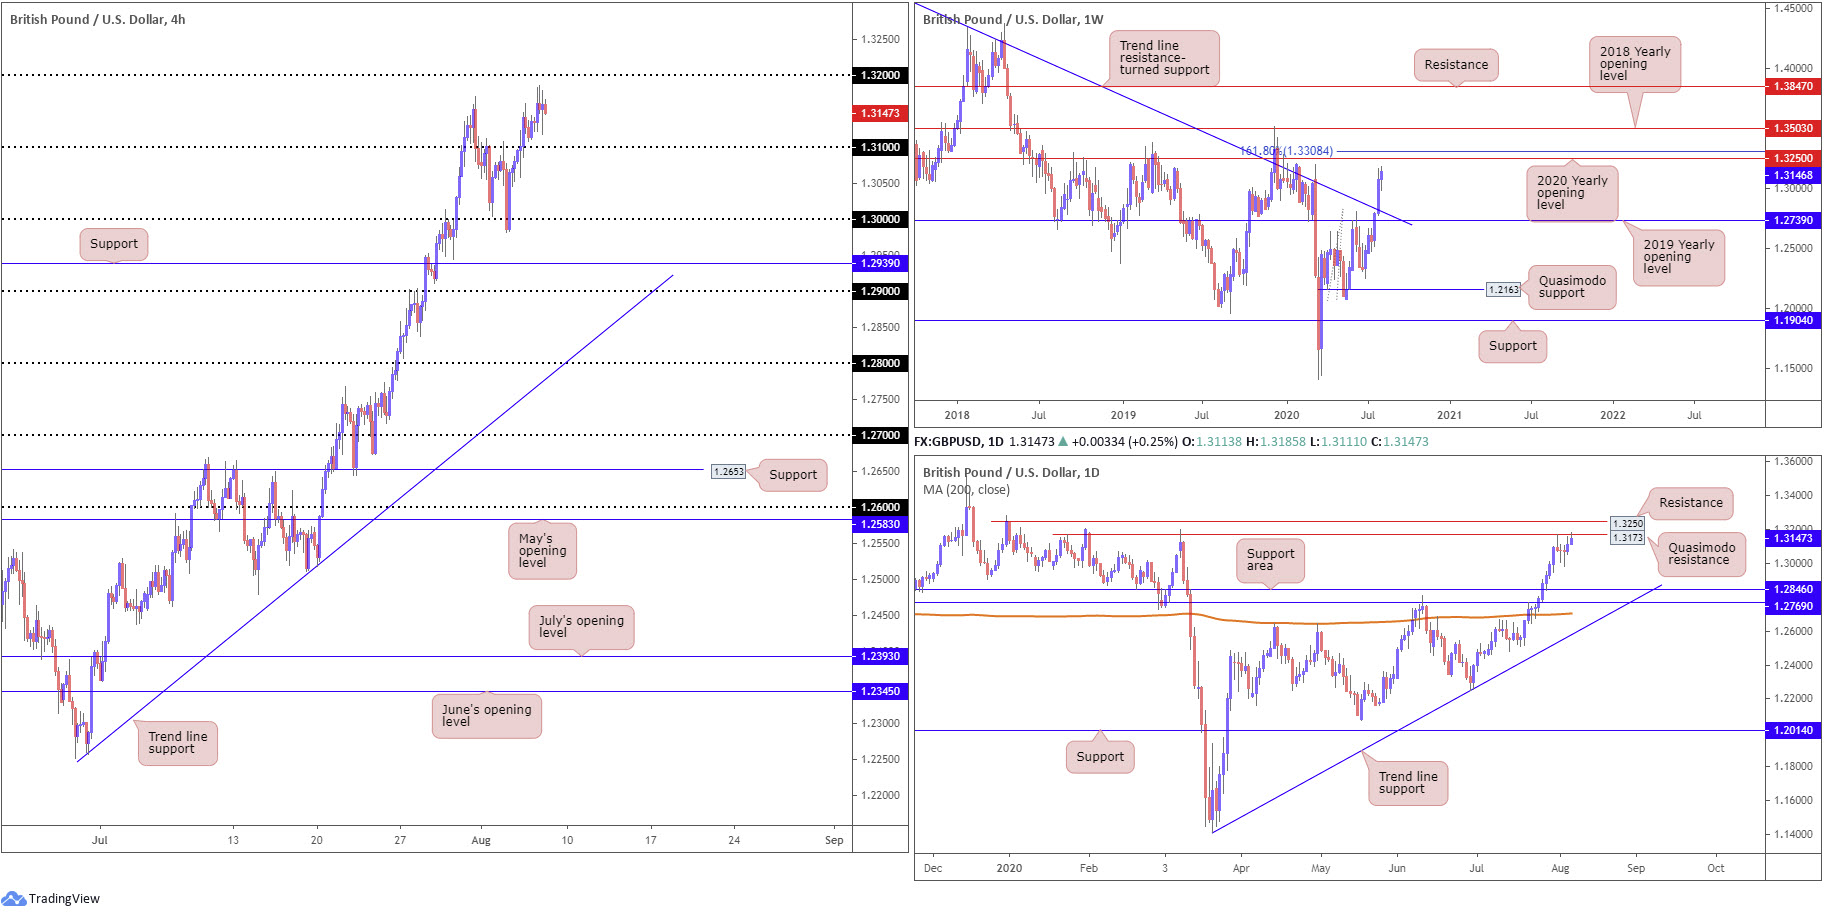
The British pound extended recovery gains against the buck Thursday, on track to record fresh yearly pinnacles.
H4, as you can see, held north of the 1.31 handle, reinforced by a surprisingly upbeat BoE along with a soft buck. Price movement is currently seen toying with five-month highs as buyers and sellers battle for position around daily Quasimodo resistance plotted at 1.3173. The next resistance on tap, based on the H4 timeframe, however, can be seen around the 1.32 vicinity.
Technical action on the higher timeframes has, as briefly highlighted above, price tackling daily Quasimodo resistance at 1.3173, with a break here likely to pull in 1.3250 resistance. Interestingly, the latter also represents resistance on the weekly timeframe by way of the 2020 yearly opening level, followed by a 161.8% Fibonacci extension point at 1.3308.
Areas of consideration:
The recent trend line resistance break on the weekly timeframe (1.5930), despite the 1.3514 December 9 high (2019) still intact (a break of here also signals trend change to the upside), may have long-term traders consider bullish positions.
Daily sellers off Quasimodo resistance at 1.3173 is potentially a concern for breakout buyers above 1.31, though they may find comfort in knowing weekly price shows room to press as far north as 1.3250. Therefore, should a 1.3173 rejection force a 1.31 retest today on the H4, current breakout buyers may attempt to pyramid positions (the move may also entice fresh dip-buying as well).
AUD/USD:
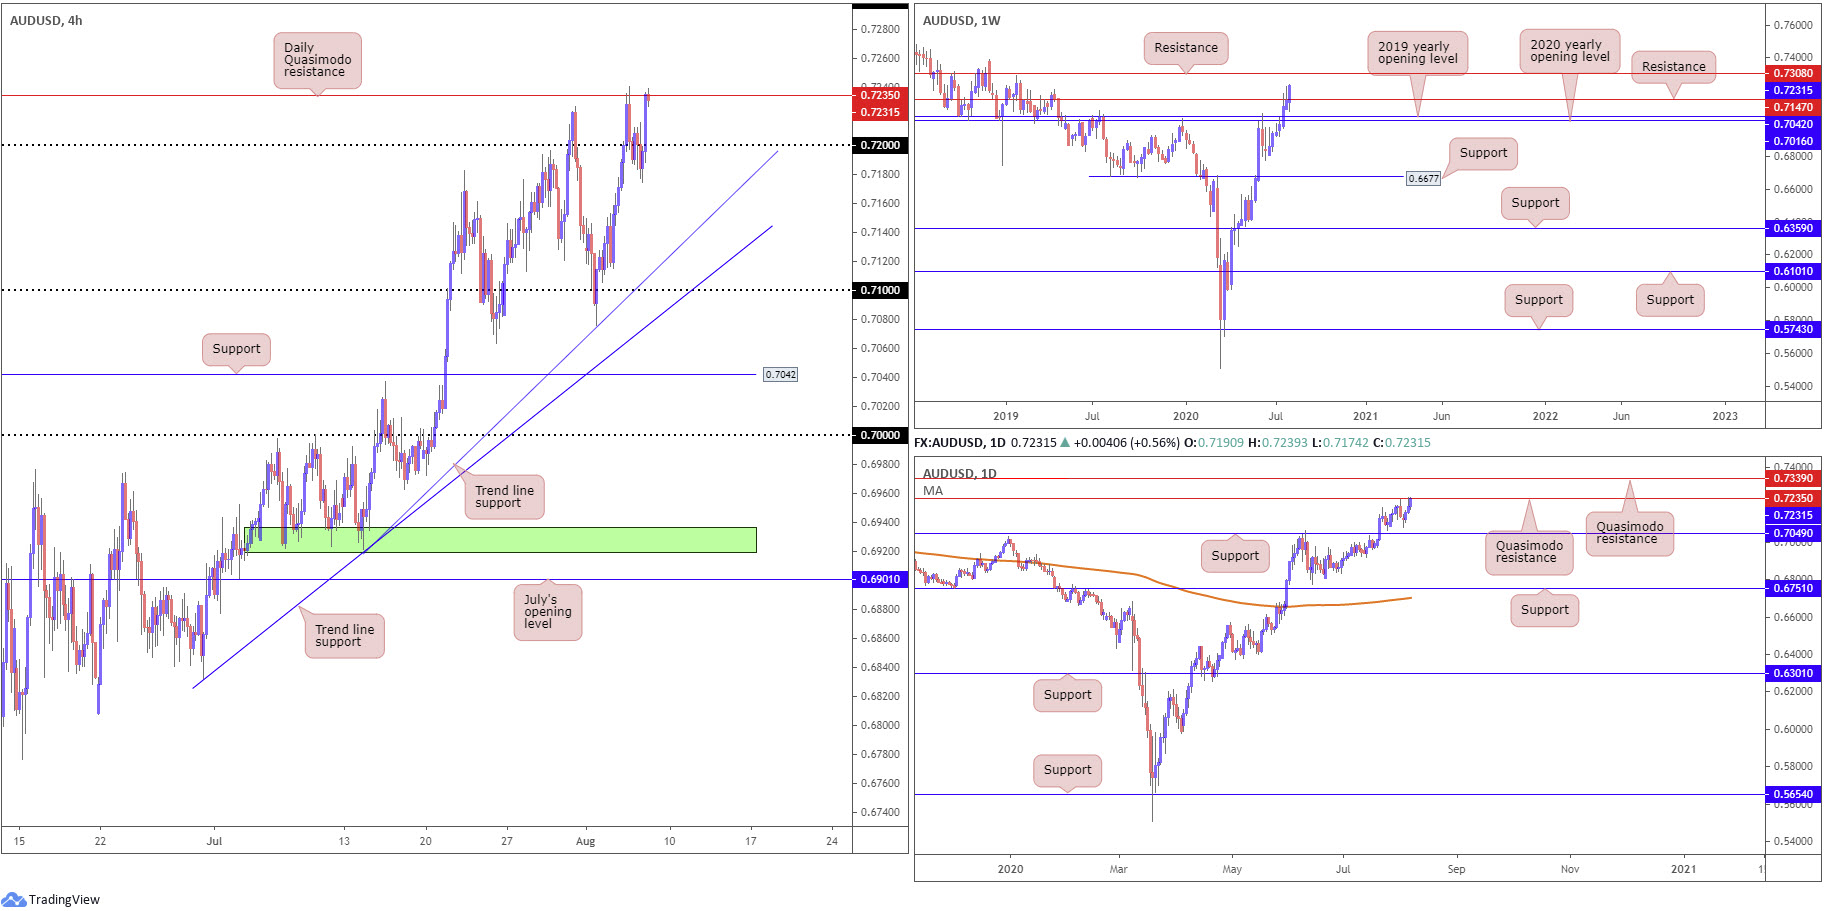
Following a reasonably short-lived dip south of 0.72 on the H4 Thursday, buyers returned in force and reclaimed 0.72+ status. Led by upbeat risk sentiment and soft dollar action, daily Quasimodo resistance made its way back into the spotlight at 0.7235 as we neared the day’s end.
Overthrowing the aforementioned daily Quasimodo resistance today shines the spotlight on a possible approach to another daily Quasimodo resistance priced at 0.7339. Breaking 0.7235 on the H4, however, shifts focus to the 0.73 handle, noting reasonably limited (active) supply to the left of price.
Higher up on the curve, activity on the weekly timeframe appears poised to make a play for resistance at 0.7308 after recently penetrating resistance at 0.7147.
Areas of consideration:
Weekly price, as you can see, delivers a clear bullish tone heading into NFP Friday, therefore daily selling from Quasimodo resistance at 0.7235 is likely to dry up shortly. Technicians will also acknowledge Wednesday’s reaction from 0.7235 failed to establish much of a move, consequently exhibiting a feeble presence from sellers (even more reason to believe an imminent break of 0.7235 is on the cards).
With the above taken into consideration, bullish themes may emerge north of 0.7235 today, targeting the 0.73 neighbourhood. Conservative players, nevertheless, may seek a 0.7235 retest before committing.
USD/JPY:
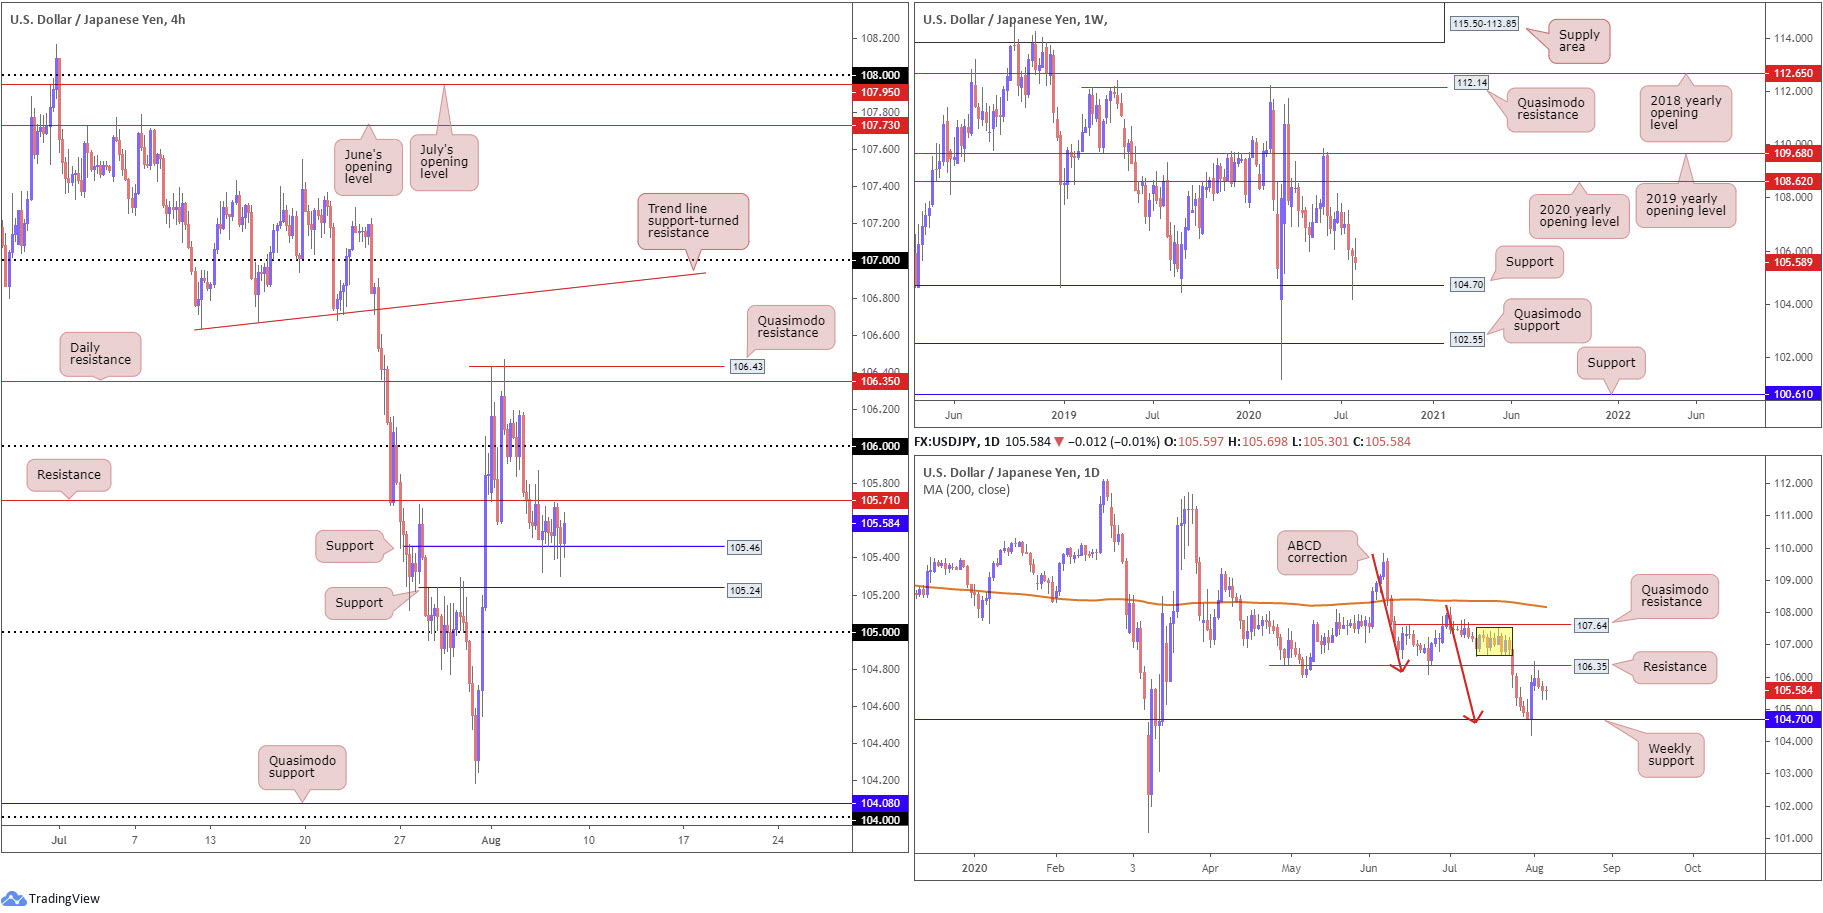
An indecisive session for the USD/JPY was observed Thursday, albeit closing considerably off worst levels (105.30). As we make our way into Friday’s session, a day traders prepare for US non-farm payrolls data, H4 action remains buoyed by support at 105.46 (a prior Quasimodo resistance level).
Technically, H4 resistance is plotted nearby at 105.71, with a break moving 106 into the firing range. Withdrawing through 105.46 today throws 105.24 support into the mix (a prior Quasimodo resistance level), followed by the 105 handle.
Weekly movement, as you can see, is virtually unmoved thus far, with traders still potentially digesting the recent hammer pattern derived from support at 104.70. Noticeable upside targets on the weekly timeframe rest at the 2020 yearly opening level from 108.62 and the 2019 yearly opening level at 109.68.
As a reminder, resistance on the daily timeframe at 106.35 (prior Quasimodo support) made its presence felt at the beginning of the week. Downside momentum, however, according to recent back-to-back lower shadows, reveals selling pressure may be drying up.
Areas of consideration:
Governed by the weekly timeframe rebounding from support at 104.70 and forming a bullish candlestick signal, longer-term analysis suggests the possibility of a run higher. Daily resistance at 106.35, nonetheless, has so far put a cap on upside, despite downside currently exhibiting signs of softening.
Going on the above, H4 traders might witness price climb through resistance at 105.71 to ignite intraday bullish themes to at least 106 and, dependent on the outcome of today’s US job’s data, possibly daily resistance at 106.35. Conservative buyers may seek additional confirmation before pulling the trigger (a retest forming at 105.71, for example).
USD/CAD:
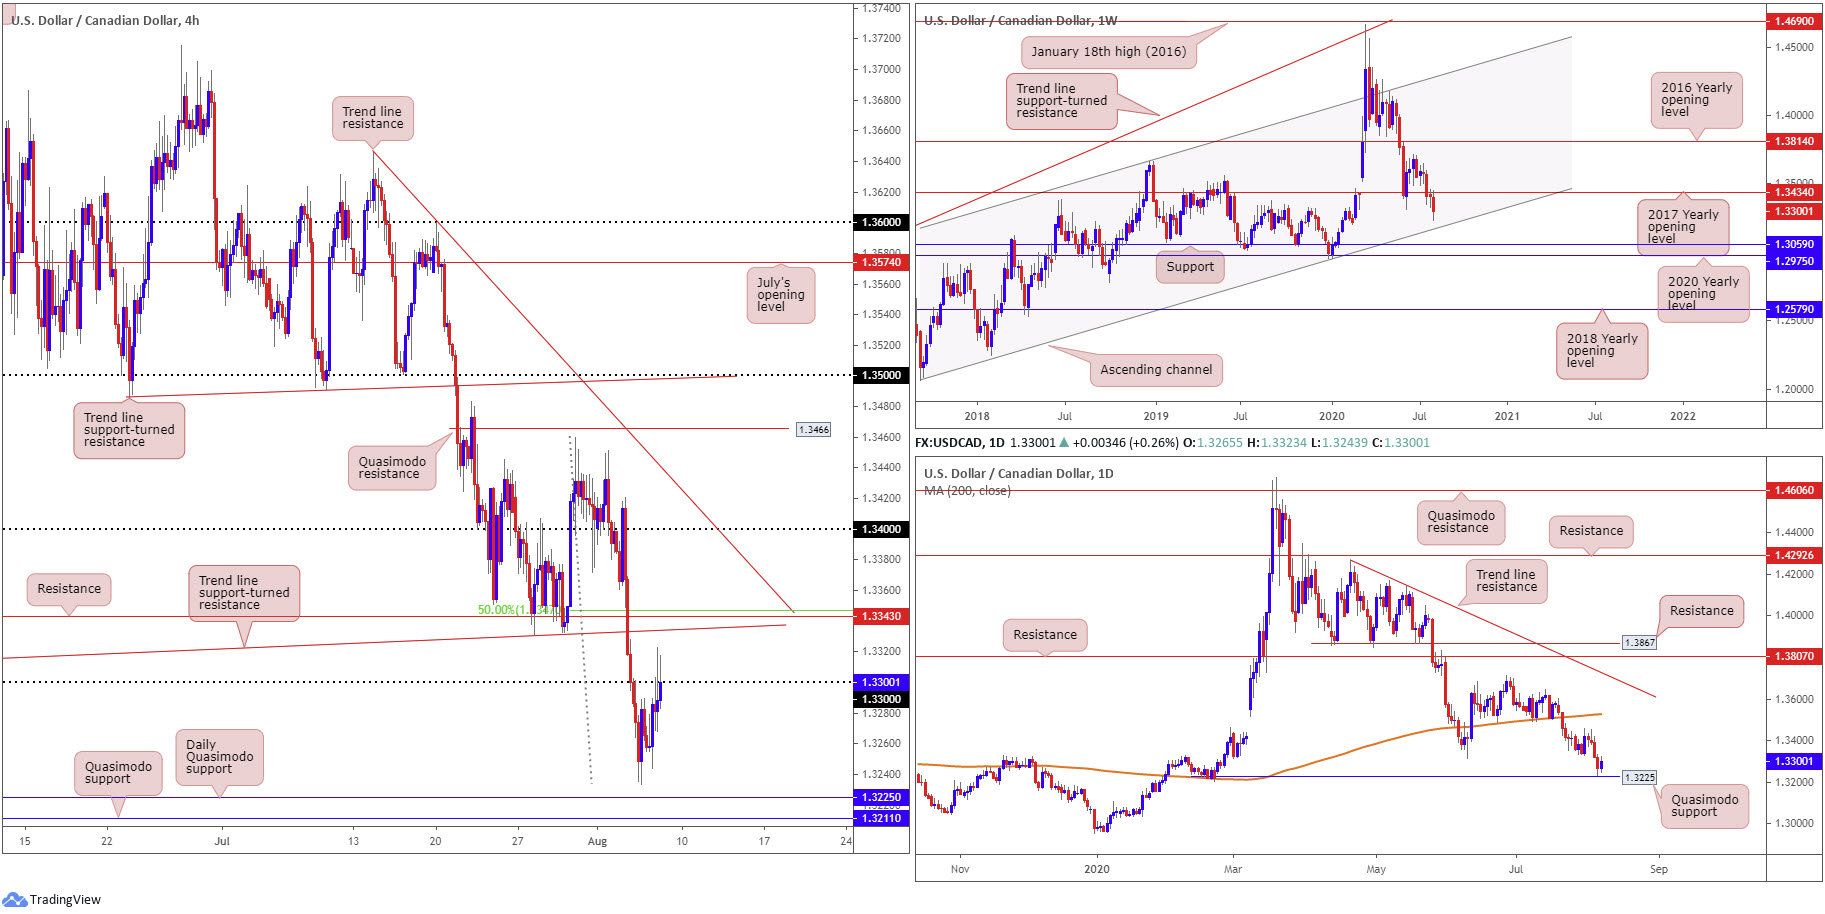
Snapping a four-day bearish phase, the US dollar closed modestly higher against the Canadian dollar Thursday. This brought H4 candles to the 1.33 region, albeit peppering out a session peak at 1.3323. Above 1.33, traders will be looking at resistance drawn from 1.3343, a level holding a close relationship with H4 trend line support-turned resistance, taken from the low 1.3315, and a 50.0% retracement at 1.3347.
Higher timeframe action had price recently turn ahead of Quasimodo support at 1.3225 on the daily timeframe, while weekly price appears starved of support (after engulfing the 2017 yearly opening level at 1.3434 [now a serving resistance]) until reaching channel support, taken from the low 1.2061.
Areas of consideration:
With weekly price indicating sellers potentially have room to stretch their legs, and daily price yet to test Quasimodo support at 1.3225, the recent 1.33 retest on the H4 scale could appeal to bearish strategies today.
Failure to hold 1.33 could see H4 resistance make an appearance at 1.3343, which may also be of interest to sellers given its local confluence.
USD/CHF:
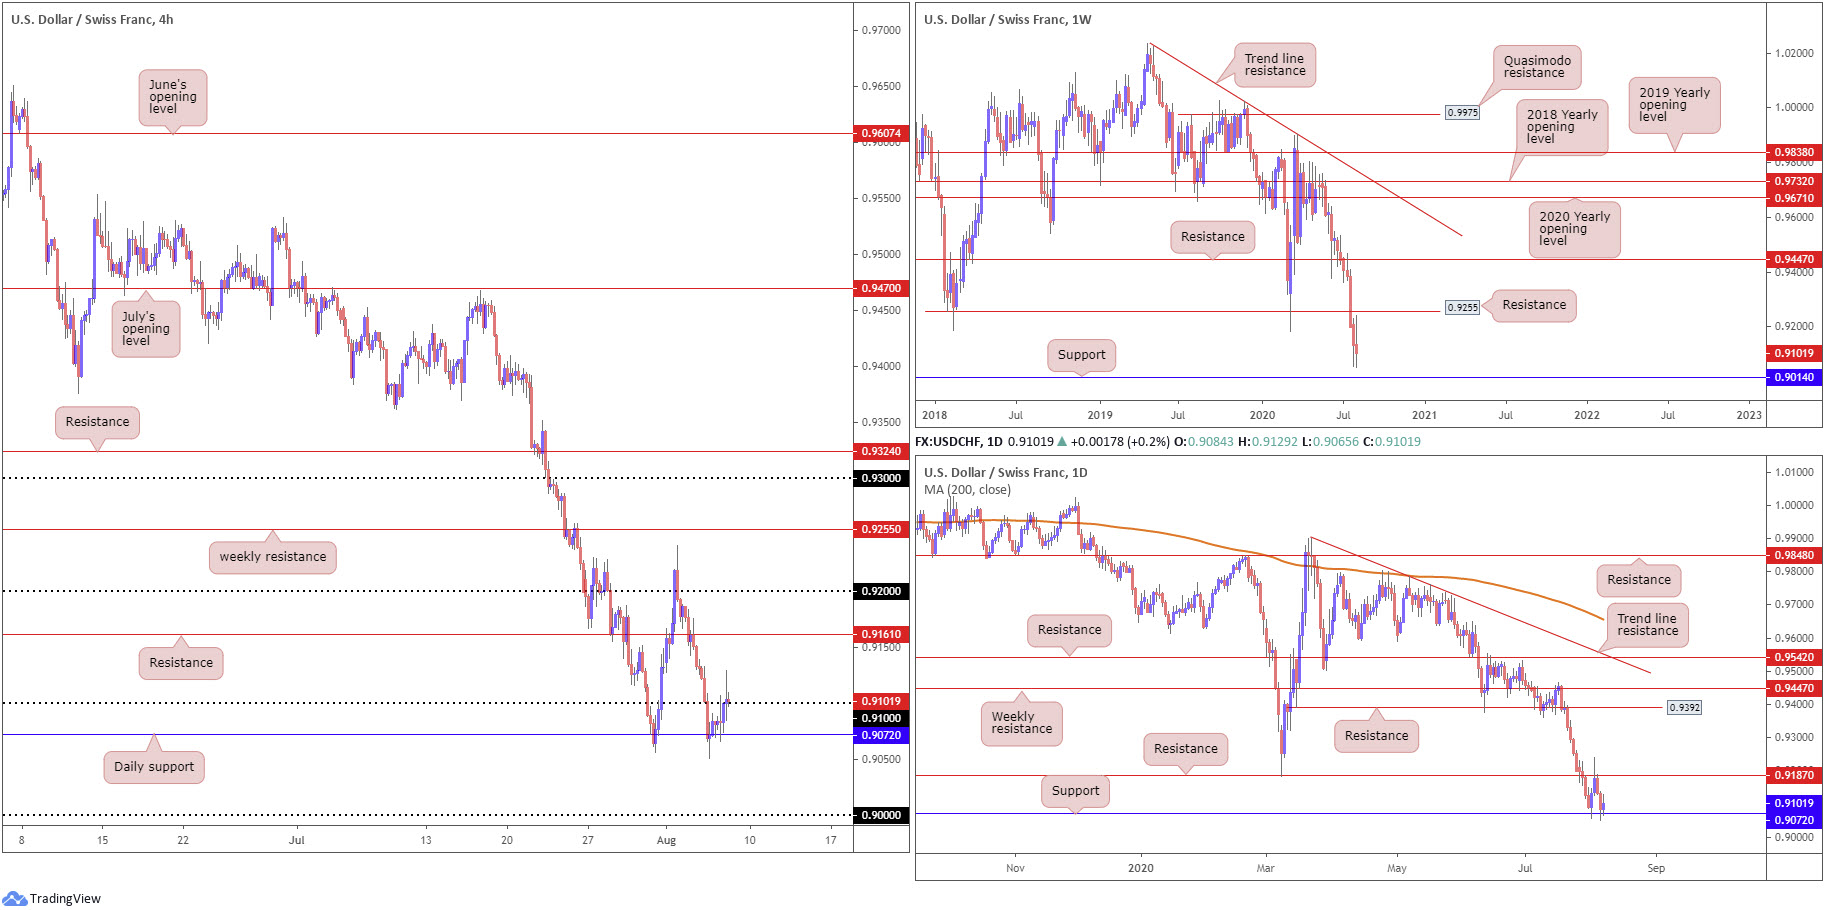
Fading multi-year lows at 0.9050, bolstered by daily support priced in at 0.9072, USD/CHF bulls staged a mild comeback Thursday and snapped a two-day bearish phase. The move also attempted to find acceptance above the 0.91 handle, reaching highs at 0.9129.
Holding things above 0.91 today nudges H4 resistance into the picture at 0.9161. Buyers are likely nervous north of 0.91, however, due to weekly price showing open space to support at 0.9014 and also coming off a decisive six-week decline.
Should sellers eventually take daily support at 0.9072, the key figure 0.90 on the H4 will be a key talking point.
Areas of consideration:
In line with the underlying downtrend, and room to move lower on the weekly timeframe to support at 0.9014, 0.91 on the H4 timeframe could hold as resistance, while a push higher may find H4 resistance at 0.9161 accommodates sellers.
Irrespective of the entry point, the downside target rests at weekly support from 0.9014/0.90 handle (H4).
Dow Jones Industrial Average:
US equities, across the board, extended their winning streak on Thursday.
The Dow Jones Industrial Average climbed 185.46 points, or 0.68%; the S&P 500 rallied 21.39 points, or 0.64%, and the tech-heavy Nasdaq 100 concluded higher by 141.65 points, or 1.27%.
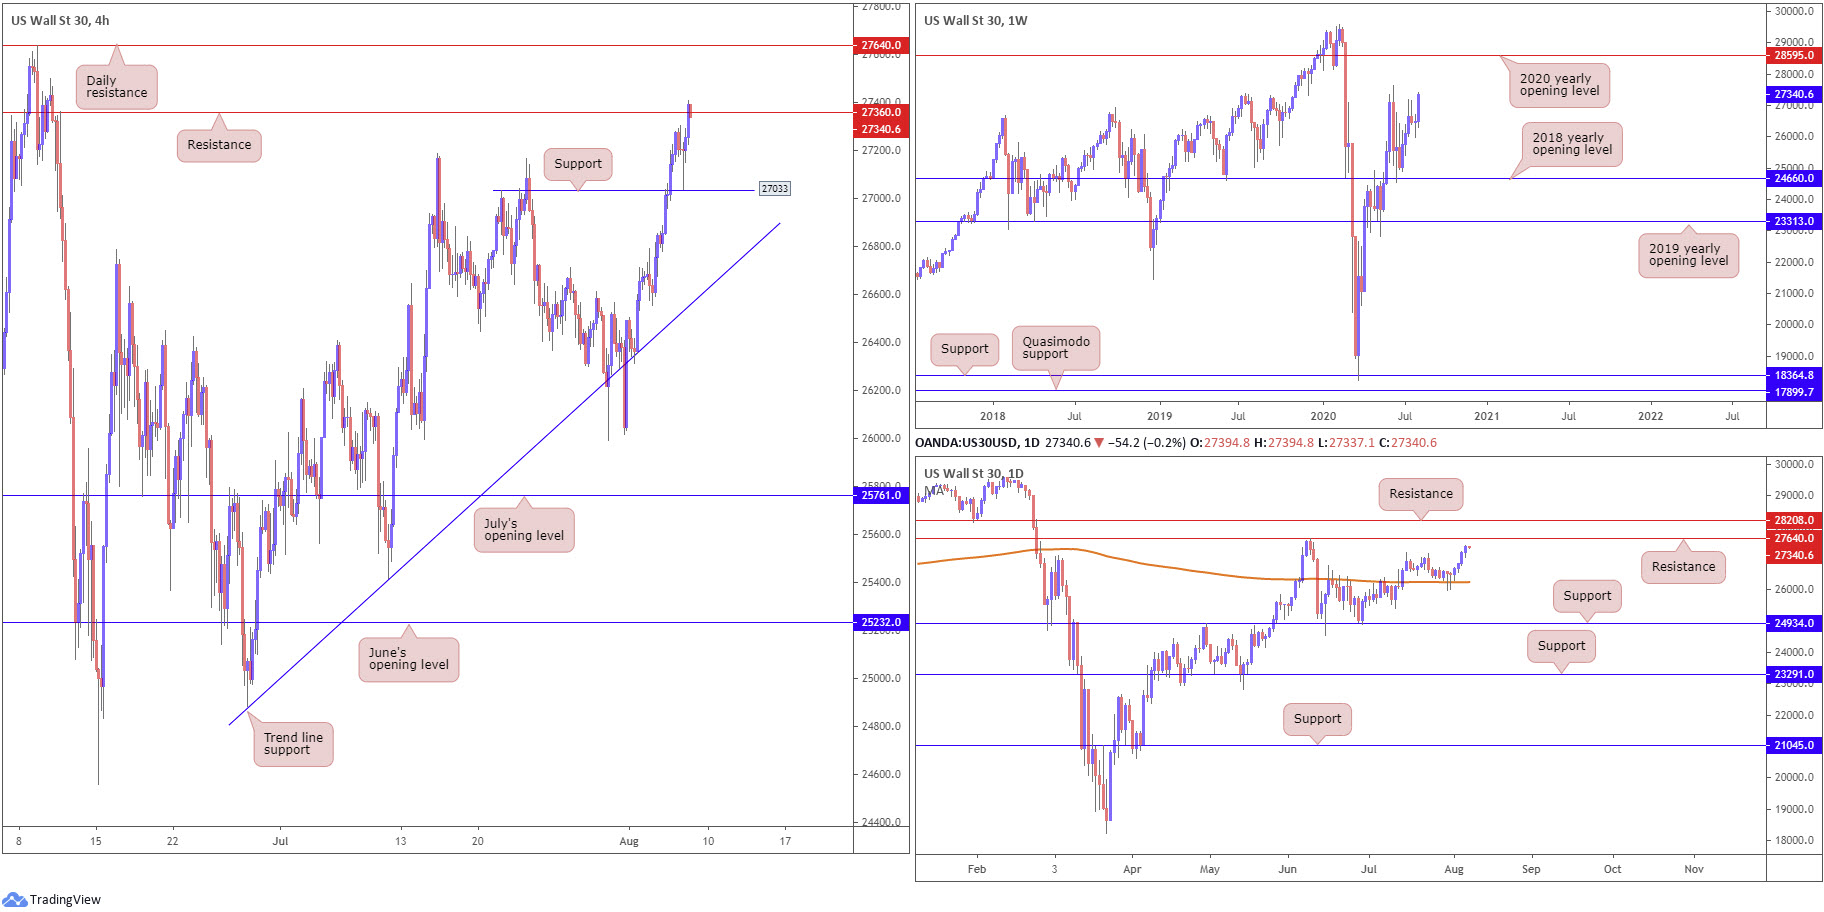
Following a dip to levels ahead of H4 support at 27033 on Thursday, price formed a hammer pattern which eventually launched H4 candles above resistance at 27360. Clearance of this base today shines focus on daily resistance parked at 27640.
From the weekly timeframe, after rebounding from the 2018 yearly opening level at 24660 mid-June, technical action is poised to pull in the 27638 high, followed by a plausible run to the 2020 yearly opening level at 28595.
After retesting the 200-day SMA (orange – 26248) heading into last week’s close, in the shape of four consecutive bullish candles we are now closing in on resistance at 27640, with a break here putting forward another layer of resistance at 28208.
Areas of consideration:
Unchanged outlook.
It is unlikely H4 resistance at 27360 will produce much for sellers, as according to both weekly and daily charts the next point of interest falls in at 27640 (daily resistance). Fresh buyers, therefore, could make a show in the event of a decisive H4 close above 27360, targeting the aforementioned daily resistance. Conservative traders may choose to drill down to the lower timeframes to secure an entry; others may require a H4 retest to form at 27360 before engaging.
XAU/USD (GOLD):
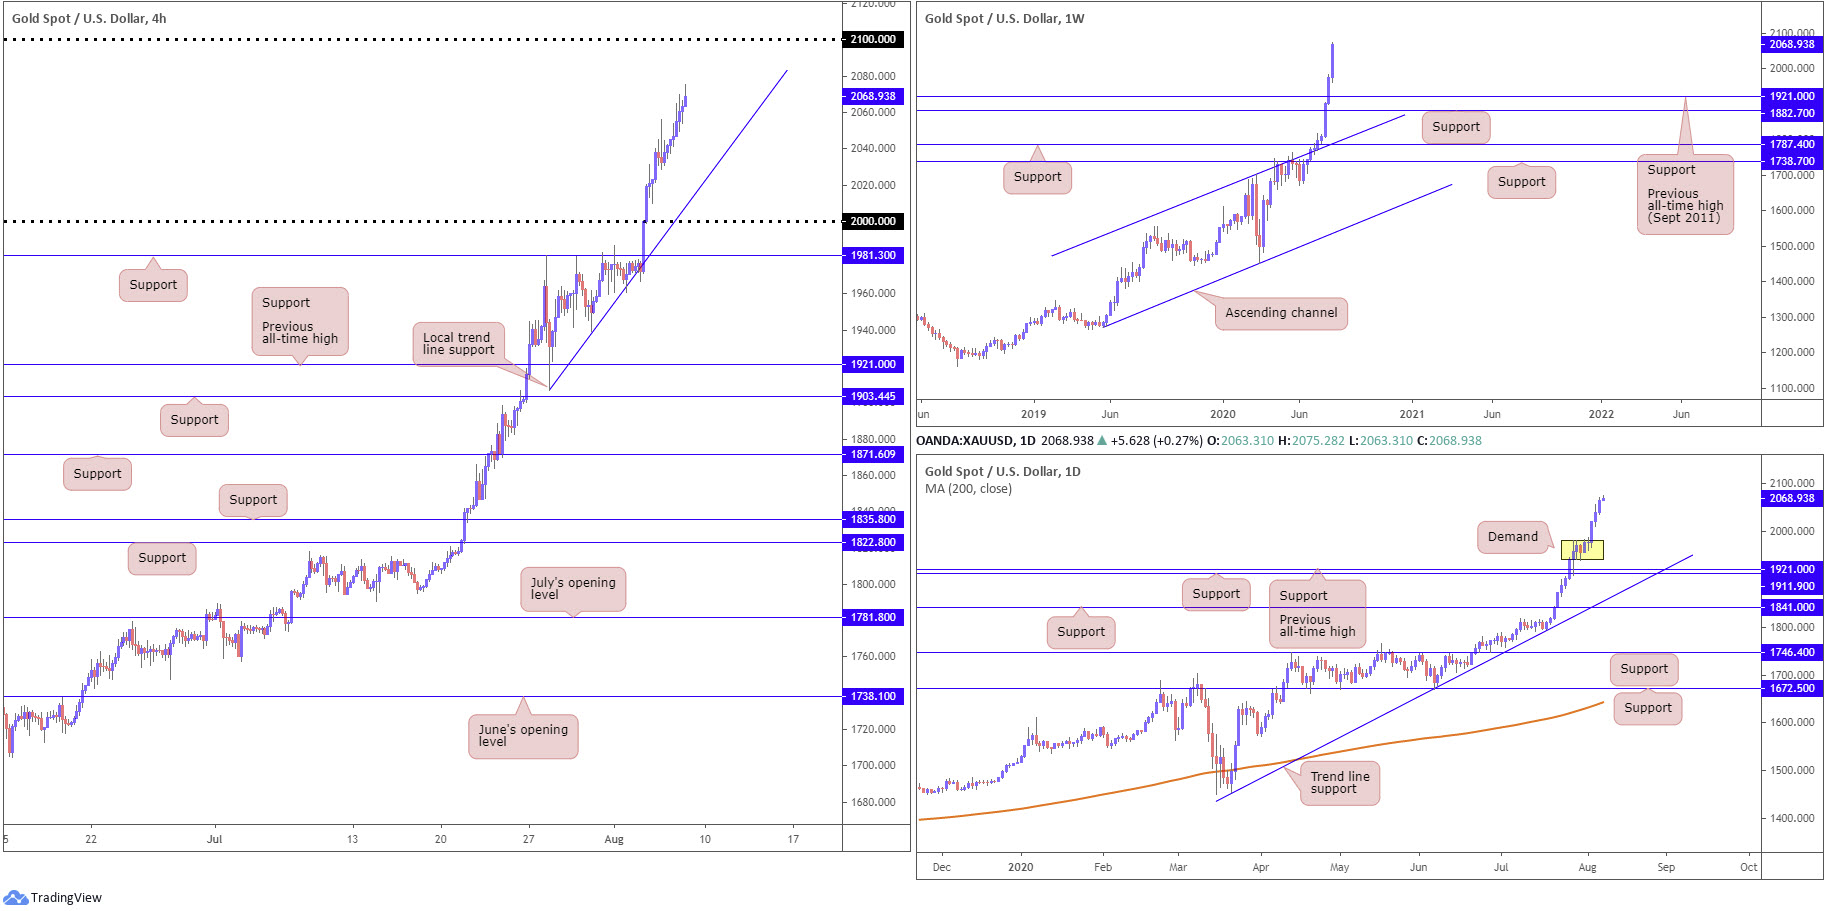
Bullion retained a strong underlying bid on Thursday, extending its record-breaking run. Spot gold was driven to an all-time peak at $2,069.81 per ounce (+1.23%), closing in on the $2,100.00 milestone.
Technically speaking, the local H4 trend line support, extended from the low $1,907.00, remains a key base to be watchful of in the event of a dip. A break of the current trend line pulls across the possibility of a $2k retest.
From the weekly timeframe, traders are urged to pencil in the possibility of a retest as far south as $1,921.00, the previous all-time high point (September 2011). A little bit closer to home, we can see daily flow projects price will likely cross swords with demand (yellow) at $1,941.10/$1,981.20, if a retreat comes to pass.
Areas of consideration:
Further buying remains likely in this market.
Unless traders are willing to drill down to the lower timeframes and approach local structure, waiting for H4 price to pullback and visit the current H4 trend line support is an alternative. H4 traders will likely seek additional candlestick confirmation before pulling the trigger as trend lines often come with fakeouts.
Breaking the said H4 trend line and reaching for $2k is equally likely to draw in dip-buying themes.
The accuracy, completeness and timeliness of the information contained on this site cannot be guaranteed. IC Markets does not warranty, guarantee or make any representations, or assume any liability regarding financial results based on the use of the information in the site.
News, views, opinions, recommendations and other information obtained from sources outside of www.icmarkets.com.au, used in this site are believed to be reliable, but we cannot guarantee their accuracy or completeness. All such information is subject to change at any time without notice. IC Markets assumes no responsibility for the content of any linked site.
The fact that such links may exist does not indicate approval or endorsement of any material contained on any linked site. IC Markets is not liable for any harm caused by the transmission, through accessing the services or information on this site, of a computer virus, or other computer code or programming device that might be used to access, delete, damage, disable, disrupt or otherwise impede in any manner, the operation of the site or of any user’s software, hardware, data or property.


