EUR/USD:
The US dollar rebounded Thursday, reclaiming a large portion of Wednesday’s lost ground after the Federal Reserve jolted markets by abandoning all plans to raise interest rates this year.
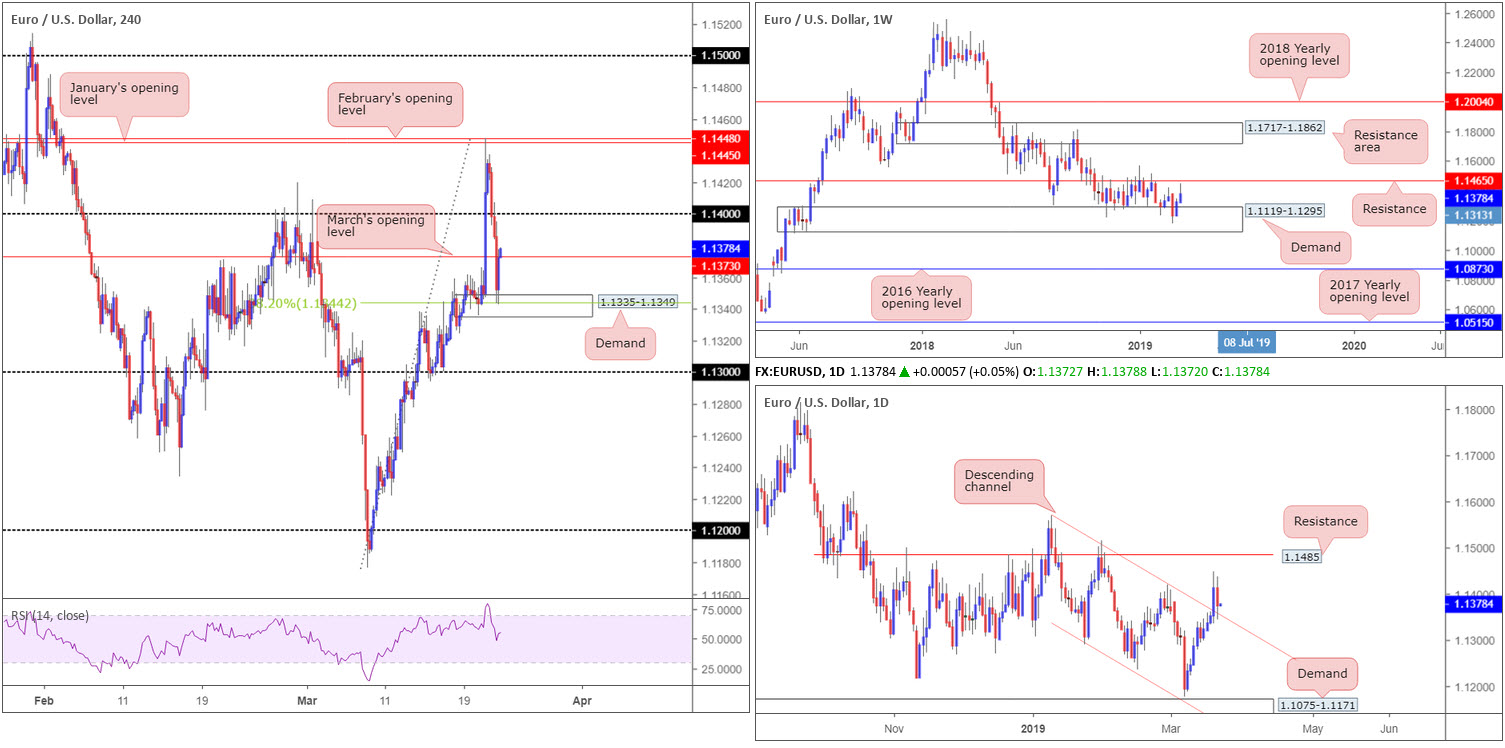
The stronger dollar weighed on the EUR/USD market yesterday, defeating a number of key levels on the H4 timeframe and snapping a four-day bullish phase. Demand at 1.1335-1.1349 (along with merging 38.2% Fibonacci support at 1.1344) elbowed its way into the spotlight, serving as a floor to mildly pare losses into the close. Buyers have March’s opening level at 1.1373 to contend with as resistance as well as 1.14, whereas below the current demand 1.13 is in sight as the next viable support.
On a broader perspective, weekly flow displays room to press lower until shaking hands with 1.1119-1.1295: a notable demand area. Daily action, on the other hand, draws channel resistance-turned support (extended from the high 1.1569) into the mix, providing the aforementioned H4 demand an extra layer of support.
Areas of consideration:
Although the weekly timeframe suggests further selling is a possibility, daily price testing channel resistance-turned support simultaneously suggests a move as far north as resistance at 1.1485 could be in store (located 20 pips higher than weekly resistance at 1.1465 – the next upside target on the weekly timeframe).
The main interest on the H4 scale is the recent bounce from demand at 1.1335-1.1349, though traders need to acknowledge the fact resistance is in play on this chart at 1.1373: March’s opening level. In addition to this, traders also need to recognise there’s limited room to manoeuvre above 1.1373 as 1.14 is the next port of call for resistance.
On account of the above reading, the research team suggests holding fire at current price. A H4 close back above 1.14 may open up possible intraday buying opportunities, targeting January/February’s opening levels at 1.1445/48, shadowed by the weekly resistance at 1.1465. Traders are urged to wait for a retest of 1.14 before pulling the trigger. Further to this, integrating favourable risk/reward conditions into your trading decision is recommended. Aim for a least a 1:2 ratio to 1.1445 (may entail entry on the lower timeframes).
Today’s data points: French Flash Services PMI; French Flash Manufacturing PMI; German Flash Manufacturing PMI; German Flash Services PMI; EUR Flash Manufacturing PMI; EUR Flash Services PMI.
GBP/USD:
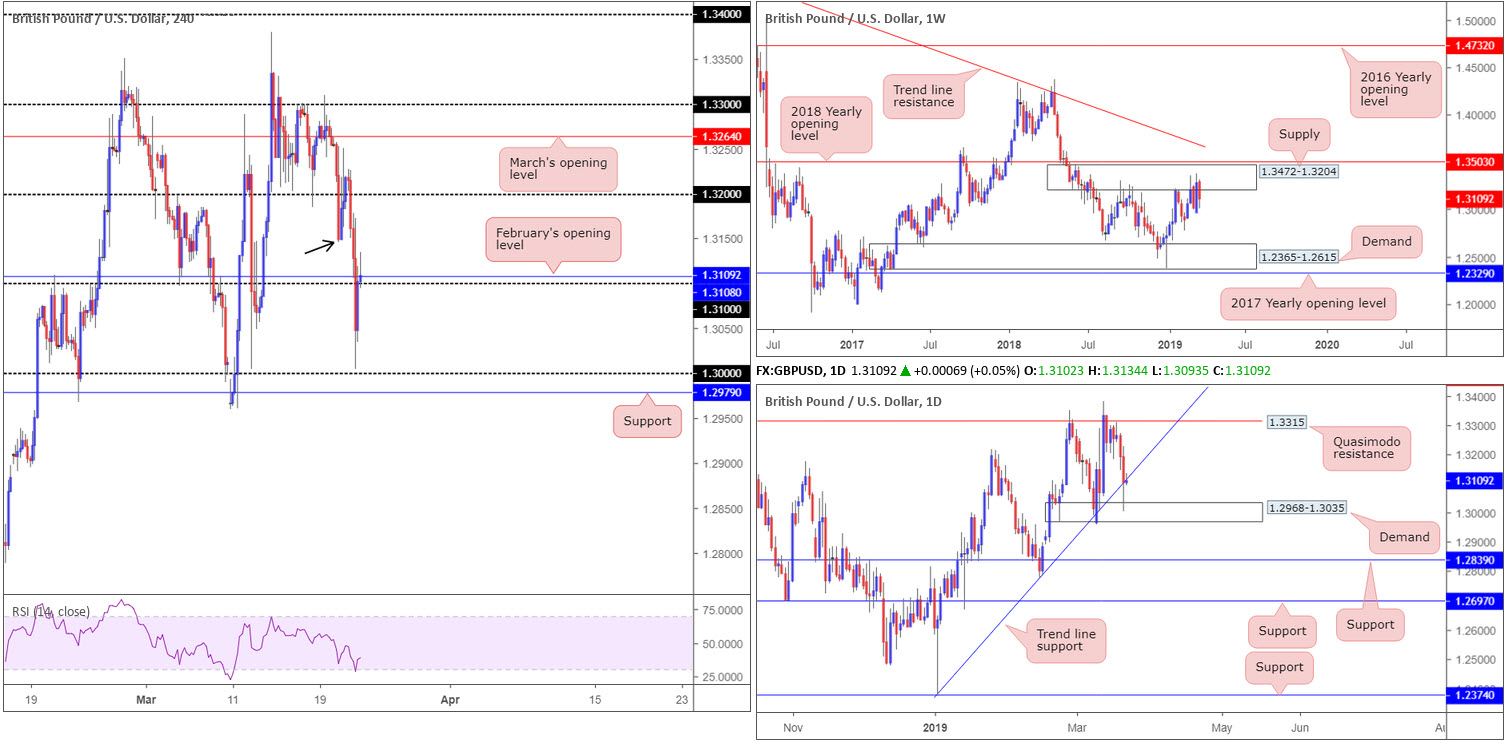
The British pound charged lower Thursday, marking its largest one-day fall this year. Amid growing concerns of a no-deal Brexit, sterling clocked lows north of key figure 1.30 on the H4 timeframe at 1.3003. As expected, yesterday’s BoE policy announcement delivered little as Brexit continues to tie the hands of policymakers. The decision to stand pat on rates at 0.75% came via a 9-0 vote with the MPC maintaining guidance.
From a technical standpoint, the main interest on the weekly timeframe is at supply drawn from 1.3472-1.3204. As highlighted in previous reports, although the area has been tested on a number of occasions since July 2018 (which could lead to the market eventually overthrowing the area for 1.3503), it would be rash to overlook the zone.
The daily picture saw yesterday’s candle rush through orders at trend line support (extended from the low 1.2373) into nearby demand plotted at 1.2968-1.3035. At this point it is unclear whether or not the current trend line support will survive.
A closer reading on the H4 timeframe has the market cycling above 1.31 in early Asia. This came after a modest rebound from just north of 1.30. In the event the buyers maintain a defence, possible selling is expected to emerge from 1.3146 (March 20 low – black arrow), followed closely by 1.32.
Areas of consideration:
According to our technical studies of the H4, daily and weekly timeframes, technical elements are mixed at the moment. Selling is emphasised on the weekly timeframe, though buyers are supported on the daily timeframe. H4 action also reveals limited confluence in terms of structure to base a trade from.
Therefore the research team have come to the conclusion this market may be best left on the back burner today.
Today’s data points: Limited.
AUD/USD:
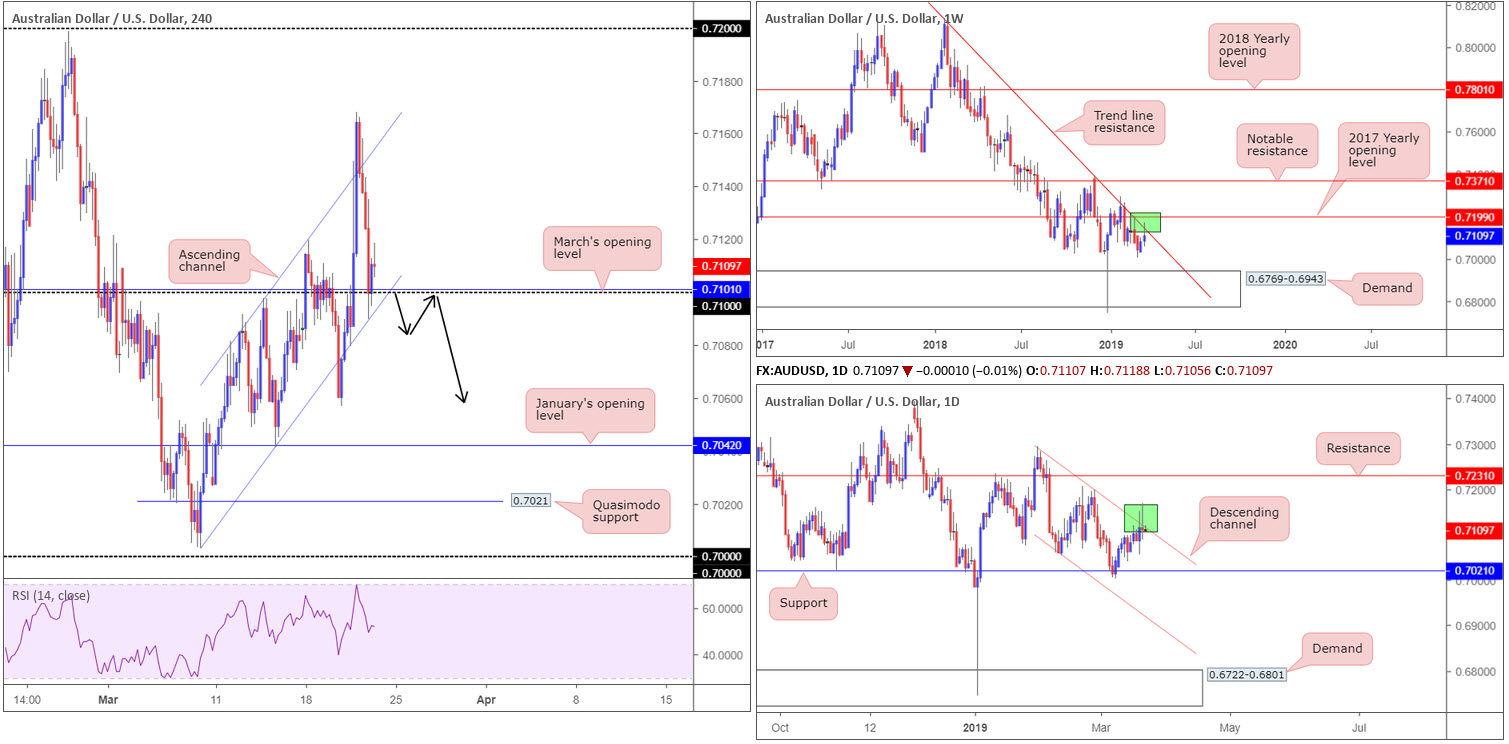
Early trade witnessed AUD/USD bulls enter the fold, boosted by a better-than-expected Australian unemployment reading. A resurgence of USD bidding, however, swiftly put a stop to further upside, topping at 0.7168. H4 flow re-entered its ascending channel formation and tested channel support (etched from the low 0.7003), which, as you can see, is closely supported by the 0.71 handle and March’s opening level at 0.7101.
Although a number of swing traders likely have longs on the radar thanks to the aforementioned H4 support, the key observation on the higher timeframes is RESISTANCE. Channel resistance on the daily timeframe is seen in play (taken from the high 0.7295), while weekly price also crossed swords with trend line resistance (etched from the high 0.8135).
Areas of consideration:
Given the picture on the higher timeframes, buying from 0.71 is chancy to say the least.
To prove seller intent from the bigger picture, traders may elect to wait and see if the H4 candles can defeat 0.71 to the downside, opening up a possible run in the direction of Wednesday’s low 0.7056, followed by January’s opening level at 0.7042. A retest of 0.71 as resistance, following a break lower, is considered a strong sell signal given the overall technical picture (entry and stop-loss placement can be determined on the rejecting candle’s structure).
Today’s data points: Limited.
USD/JPY:
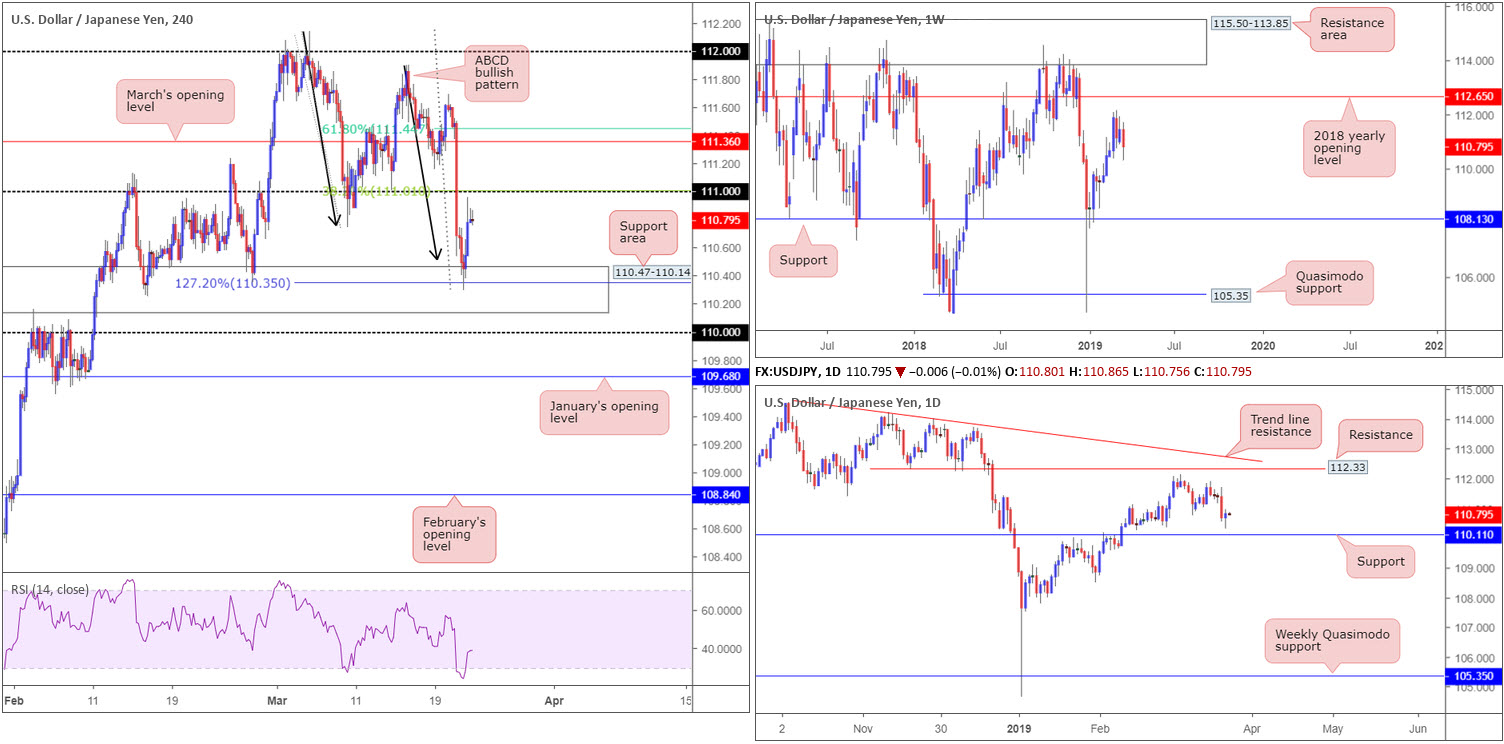
A broad-based USD recovery took shape Thursday, consequently lifting the USD/JPY to higher ground. Though the move was little to write home about, traders may recall Thursday’s briefing highlighted a potential long from the top edge of the H4 support area at 110.47-110.14, which happened to align with a 127.2% ABCD bullish pattern (black arrows) around 110.35. Well done to any of our readers who managed to jump aboard this move – the next upside target on the H4 scale falls in around 111 that also fuses with a 38.2% Fibonacci resistance set from the A-D leg (considered by many harmonic traders to be the first take-profit target).
Higher up on the curve, we see daily players lingering just north of support at 110.11 in the shape of a half-hearted bullish pin-bar pattern. Weekly flow, on the other hand, is currently haunting no man’s land. A few weeks back the market witnessed the pair top within striking distance of the 2018 yearly opening level at 112.65. Since then we’ve seen upside momentum decline.
Areas of consideration:
Should the H4 candles connect with 111 today, traders long the current H4 ABCD formation are urged to consider cashing in partial profits and reducing risk to breakeven. In the event we push for ground above 111, keep eyes on March’s opening level at 111.36 as the next take-profit target (shadowed closely by a 61.8% Fibonacci resistance at 111.44 set from the A-D leg – considered by many harmonic traders to be the second take-profit target).
Today’s data points: Limited.
USD/CAD:
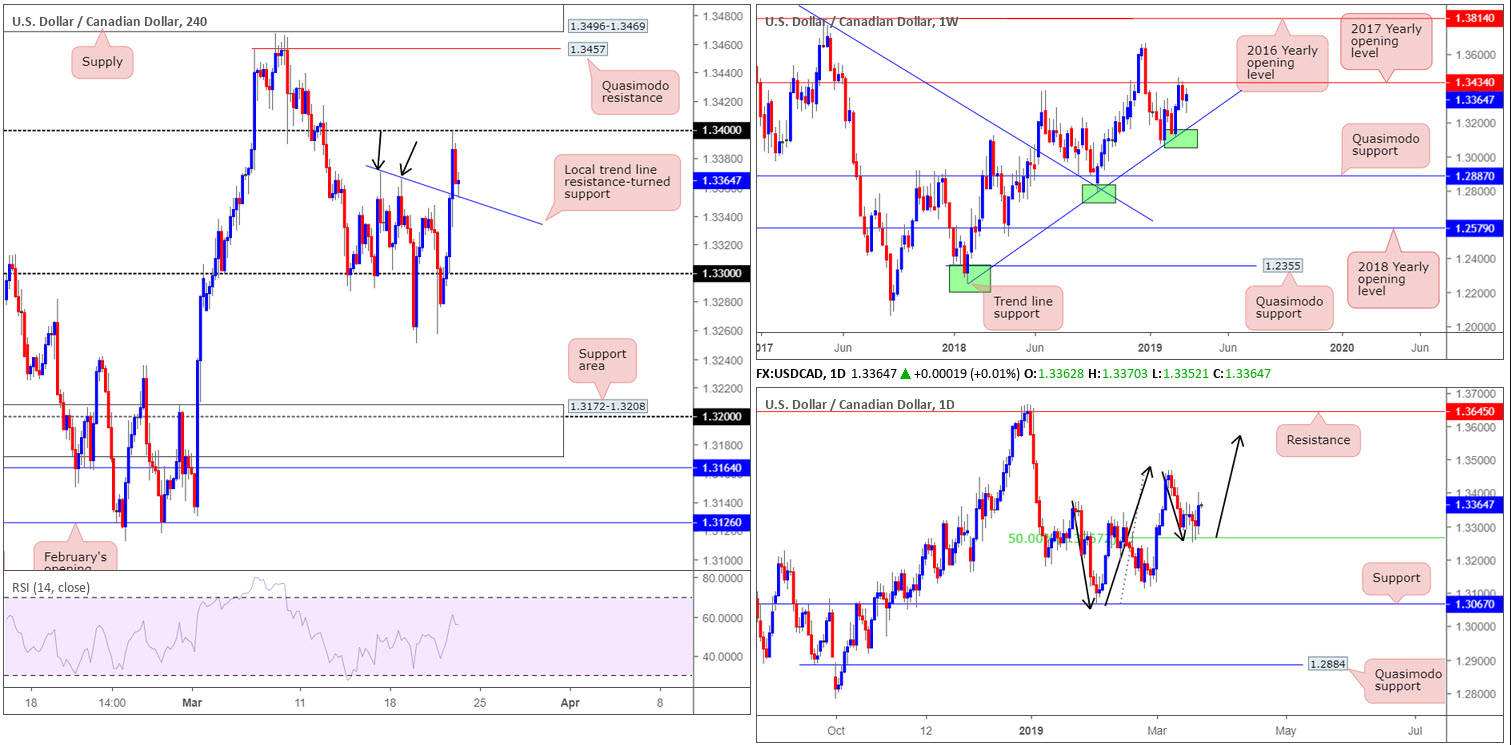
USD/CAD action capitalised on broad USD strength Thursday, pulling the unit to weekly highs at an even 1.34.
As the response from the underside of 1.34 forced a retest of a local trend line resistance-turned support (extended from the high 1.3371) on the H4 timeframe, this may be interpreted as a bullish signal. A strong move off here which overcomes 1.34 to the upside has Quasimodo resistance at 1.3457 in sight, tailed closely by supply at 1.3496-1.3469. Note above 1.34, limited (fresh) supply is visible to left of the current price until reaching the aforesaid Quasimodo.
Structure on the weekly timeframe has price capped by the 2017 yearly opening level at 1.3434, with the next downside objective set at a trend line support (extended from the low 1.2421). On the other side of the spectrum, daily action indicates it may be poised to approach higher ground today/next week. The higher high sported on March 7th followed by a 50.0% retracement to 1.3265 which held firm, places the buyers in good stead to advance north.
Areas of consideration:
Should the current H4 candle close strongly off its local trend line resistance-turned support, a long trade (with entry and risk levels determined by the candle’s structure) could be an option, targeting 1.34 as the initial take-profit zone.
Although the path is reasonably free of resistance above 1.34 on the H4 timeframe towards 1.3457, it’s worth pointing out the 2017 yearly opening level mentioned above on the weekly timeframe at 1.3434 may hinder upside.
Today’s data points: Canadian CPI m/m, Core Retail Sales m/m, Common CPI y/y, Median CPI y/y, Retail Sales m/m and Trimmed CPI y/y.
USD/CHF:
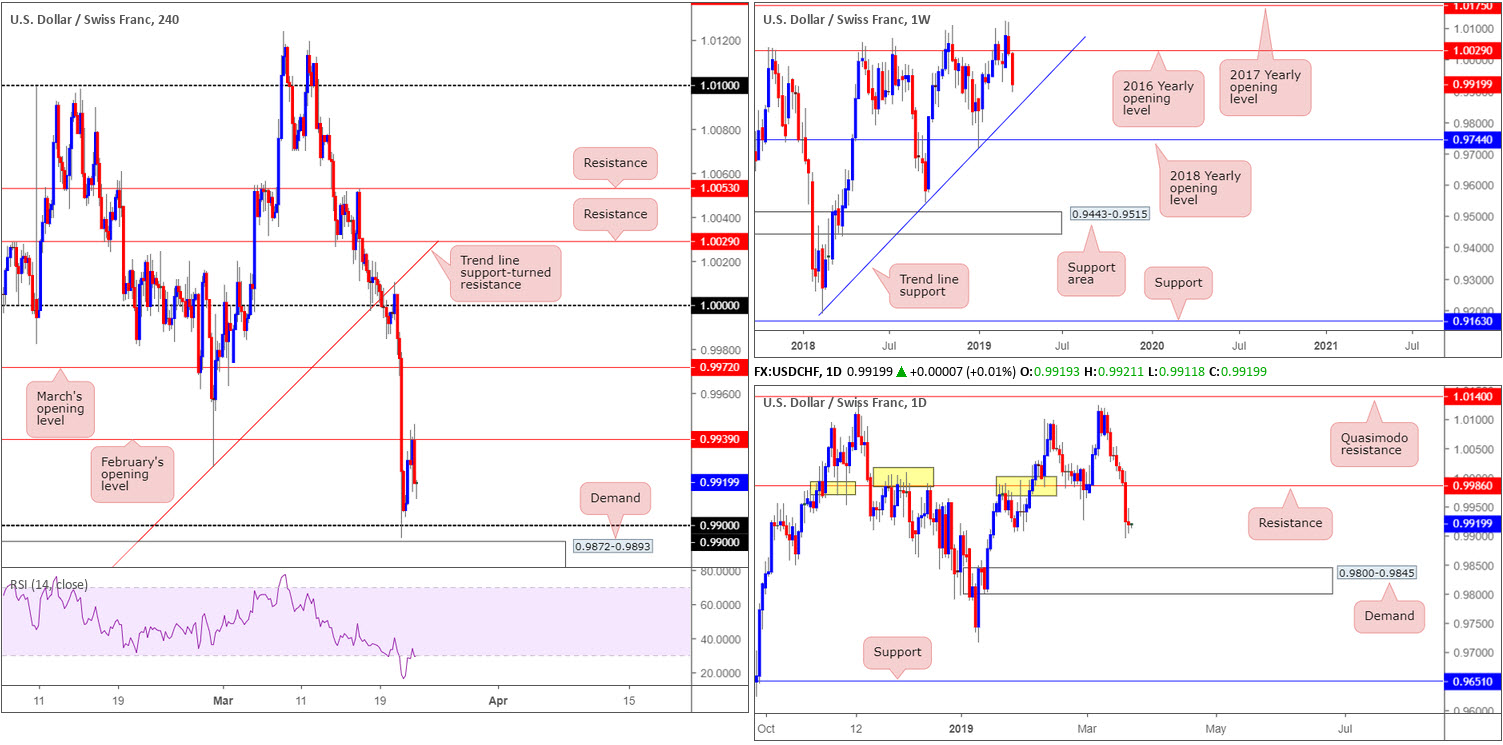
Despite speculative interest establishing off 0.99 to the upside on the H4 timeframe (missing demand at 0.9872-0.9893 by a couple of pips), February’s opening level at 0.9939 proved stubborn resistance Thursday. Yesterday’s rejection, formed in the shape of a strong H4 bearish rotation candle, marked the pair’s eighth consecutive losing day since topping at 1.0012.
Despite the current weekly candle sporting losses of more than 1 per cent, further selling, according to weekly structure, is possible towards trend line support (pencilled in from the low 0.9187). Daily flow, aside from the 0.9905 Jan 28 low, also demonstrates potential to charge as far south as demand plotted at 0.9800-0.9845.
Areas of consideration:
Both weekly and daily timeframes portend a move beyond the noted H4 demand to 0.9845: the top edge of daily demand which happens to merge with the current weekly trend line support. This daily demand, therefore, is a valid zone worthy of the watch list for a potential long in the near future.
Intraday sellers may attempt to sell the breakout below the aforementioned H4 demand, targeting 0.9845. This, as put forward in yesterday’s briefing, offers less than 30 pips to play with, so traders are urged to consider risk/reward implications before pulling the trigger.
Today’s data points: Limited.
Dow Jones Industrial Average:
The Dow Jones Industrial Average (CFD) rose 281 points Thursday, or 1.10%. US equities rebounded firmly yesterday following the Federal Reserve announcing projections for interest rates this year were limited.
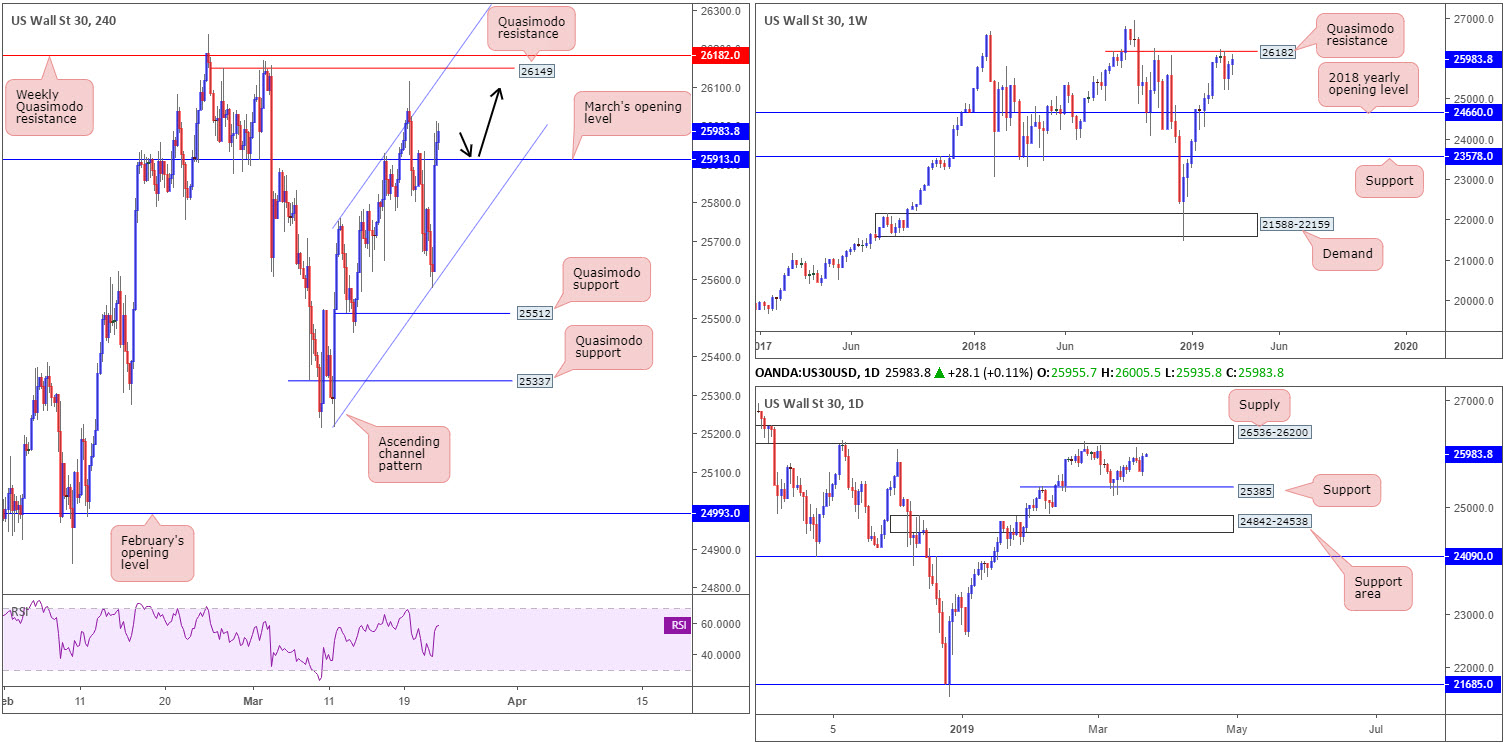
Powering higher by way of a bullish engulfing pattern, price action on the daily timeframe appears poised to approach a reasonably well grounded nearby supply coming in at 26536-26200. What’s also notable from a technical perspective is a weekly Quasimodo resistance parked a few points south of the aforementioned daily supply at 26182.
March’s opening level on the H4 timeframe at 25913, although serving as strong resistance Wednesday, was conquered Thursday. This, as you can probably see, draws focus to the 26114 Mar 19 high, shadowed closely by Quasimodo resistance at 26149. It’s also worth pointing out for channel traders that we have an ascending channel in motion as well (taken from the high 25758 and low at 25215).
Areas of consideration:
With room seen for the market to extend higher on all three timeframes from an intraday perspective, a retest play (black arrows) from 25913 is a possible scenario today, with a target objective set around 26149/26200 (range brings together the weekly Quasimodo resistance at 26182, the underside of the daily supply at 26200 and the H4 Quasimodo resistance at 26149).
Today’s data points: Limited.
XAU/USD (GOLD):
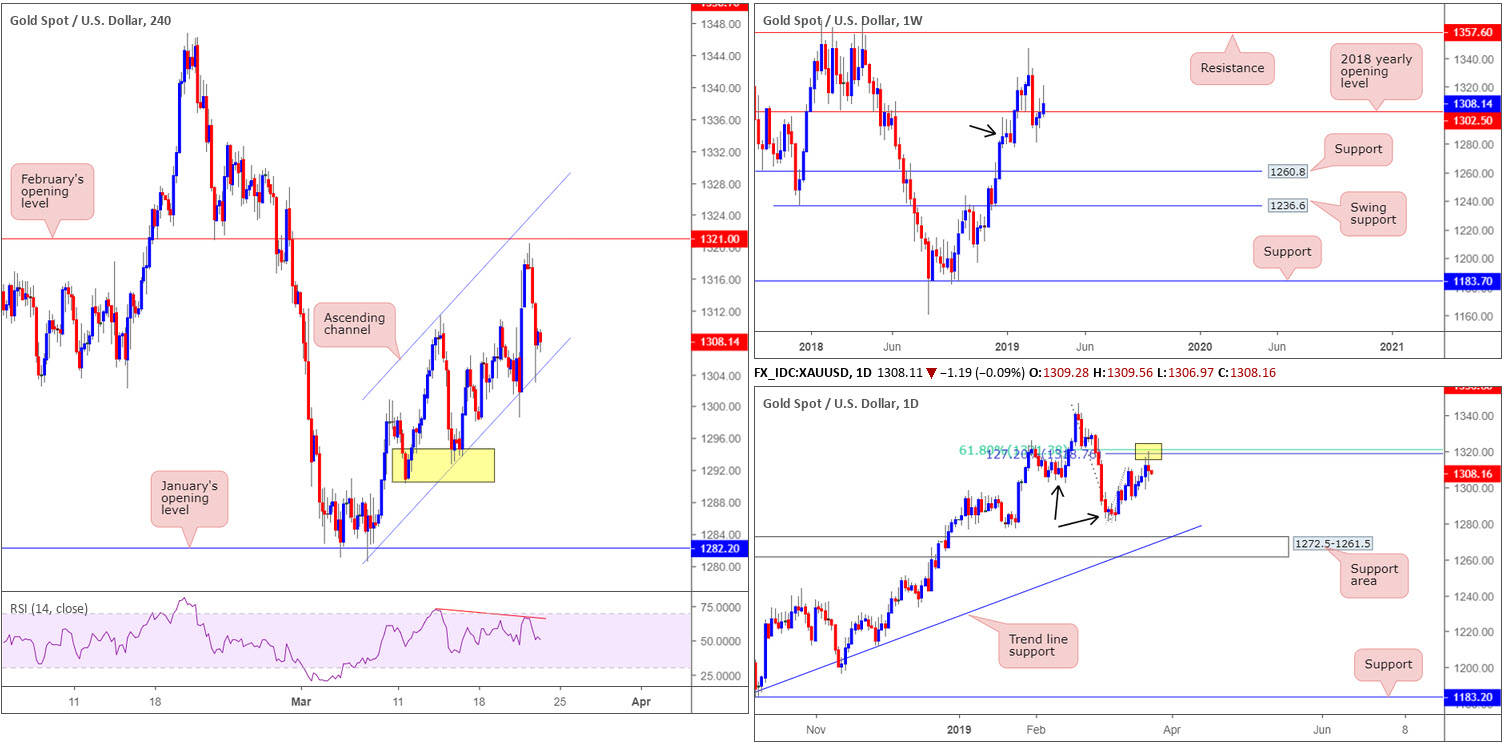
Bullion turned lower Thursday, strong-armed by a robust greenback across the board. Leaving February’s opening level at 1321.0 unopposed on the H4 timeframe, price action charged south and shook hands with channel support (etched from the low 1280.4). Buyers defended this angle going into the close, therefore mildly paring losses.
Reinforcing downside pressure yesterday was the 1321.3/1318.7 area on the daily timeframe: a 61.8% Fibonacci resistance and 127.2% Fibonacci ext. point. This area entered the radar following a lower low taking shape at 1281.0, breaking the 1302.4 Feb 14 low (black arrows).
The caveat to the lower low (and pullback) printed on the daily timeframe, however, is weekly structure. Note for three weeks the market has been engaging with a demand area at 1276.9-1298.5 (black arrow), pressuring the candles beyond its 2018 yearly opening level at 1302.5.
Areas of consideration:
In order to prove seller intent from current price, traders will likely be looking for a breakout below the current H4 channel support. Although this is valid, traders are urged to also consider 1302.5 on the weekly timeframe possibly offering support. With that being the case, it might be an idea to wait for a H4 break of 1302.5 along with the aforementioned H4 channel support. A retest to the underside of 1302.5 on the H4 timeframe, preferably in the shape of a H4 bearish candlestick signal (entry/risk can be defined according to this structure), would be considered a strong sell signal, steering towards an initial target of 1293.0ish (yellow H4 zone), followed by January’s opening level at 1282.2.
The accuracy, completeness and timeliness of the information contained on this site cannot be guaranteed. IC Markets does not warranty, guarantee or make any representations, or assume any liability with regard to financial results based on the use of the information in the site.
News, views, opinions, recommendations and other information obtained from sources outside of www.icmarkets.com.au, used in this site are believed to be reliable, but we cannot guarantee their accuracy or completeness. All such information is subject to change at any time without notice. IC Markets assumes no responsibility for the content of any linked site. The fact that such links may exist does not indicate approval or endorsement of any material contained on any linked site.
IC Markets is not liable for any harm caused by the transmission, through accessing the services or information on this site, of a computer virus, or other computer code or programming device that might be used to access, delete, damage, disable, disrupt or otherwise impede in any manner, the operation of the site or of any user’s software, hardware, data or property.