
EUR/USD:
The single currency sustained further losses Wednesday amid disappointing German data in the form of factory orders and construction PMI, along with broad-based US dollar bidding that pulled the DXY firmly above its 96.00 mark.
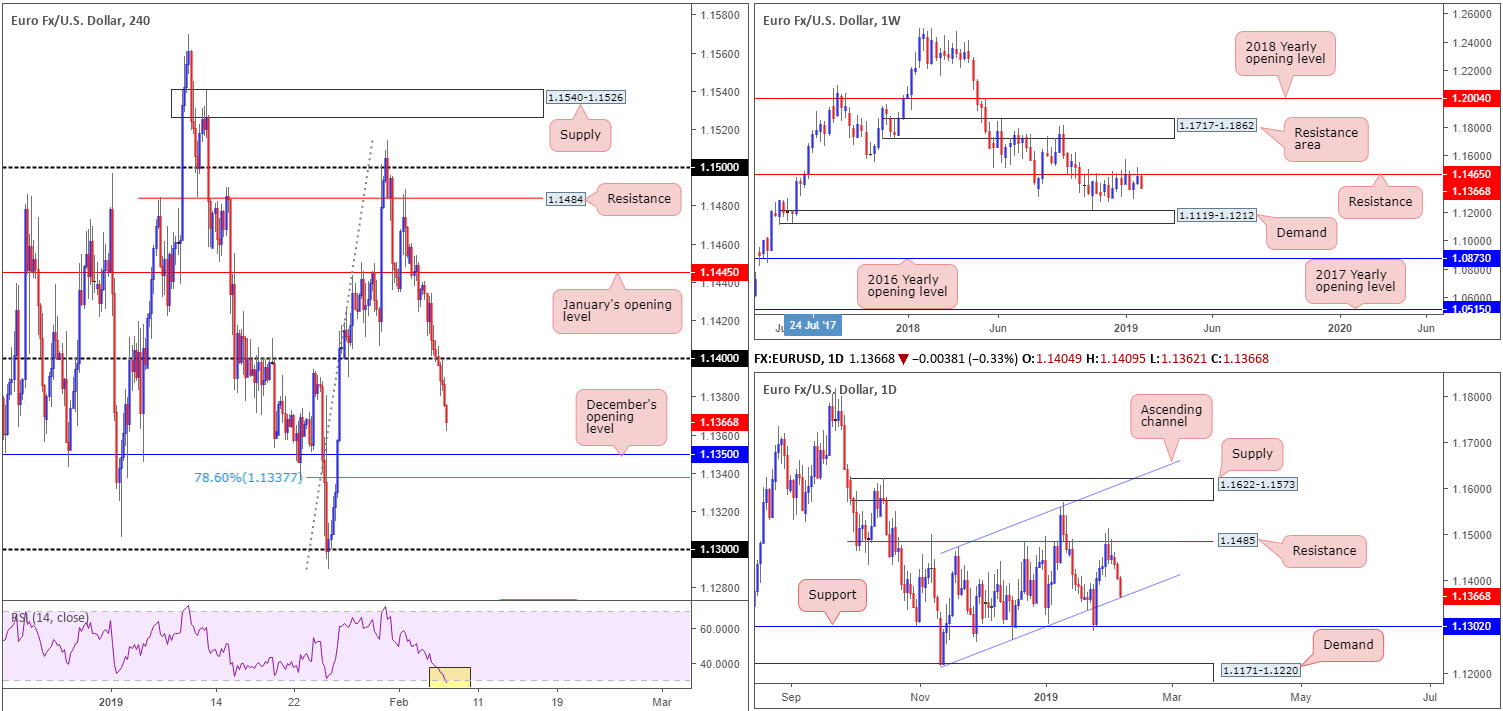
The H4 candles reclaimed 1.14 to the downside in early trade yesterday, tripping stops and exposing December’s opening level at 1.1350. Beyond this number, the research team notes limited support until connecting with 1.13. It may also interest some traders to note the RSI indicator is testing its oversold value.
H4 price, although displaying scope for further downside, may struggle. According to the daily timeframe, after successfully fading overhead resistance at 1.1485, is seen shaking hands with an ascending channel support (etched from the low 1.1215). This, given its history, could draw in buyers from this area and hamper downside today/the rest of the week. The flip side to this, of course, is the weekly timeframe. Since late October of 2018, the pair has been clinging to the underside of resistance coming in at 1.1465, with the next support target in view at demand drawn from 1.1119-1.1212.
Areas of consideration:
Apart from a nearby 78.6% H4 Fibonacci support value at 1.1337, there’s limited evidence on the H4 scale to suggest active buyers reside around December’s opening level at 1.1350. Further adding to this, a move down to this area of support would also imply a break of the current daily ascending channel support, and by extension likely attract sellers into the market against your long.
Entering long in this market based on the current daily ascending channel support is, therefore, likely on the radar for many traders today. Knowing we’re coming from weekly resistance, however, this could potentially hinder upside from here.
The 1.13 handle lower down on the H4 timeframe is a support worthy of mention, in view of the number representing a strong daily support at 1.1302. Once again, though, a long from here has possible opposition to contend with from the weekly timeframe.
On account of the above reading, the research team feels neither a long nor short is attractive today. Though there are levels of support and resistance nearby, little stands out in terms of a high-probability setup.
Today’s data points: EU Economic Forecasts; FOMC Member Clarida Speaks.
GBP/USD:
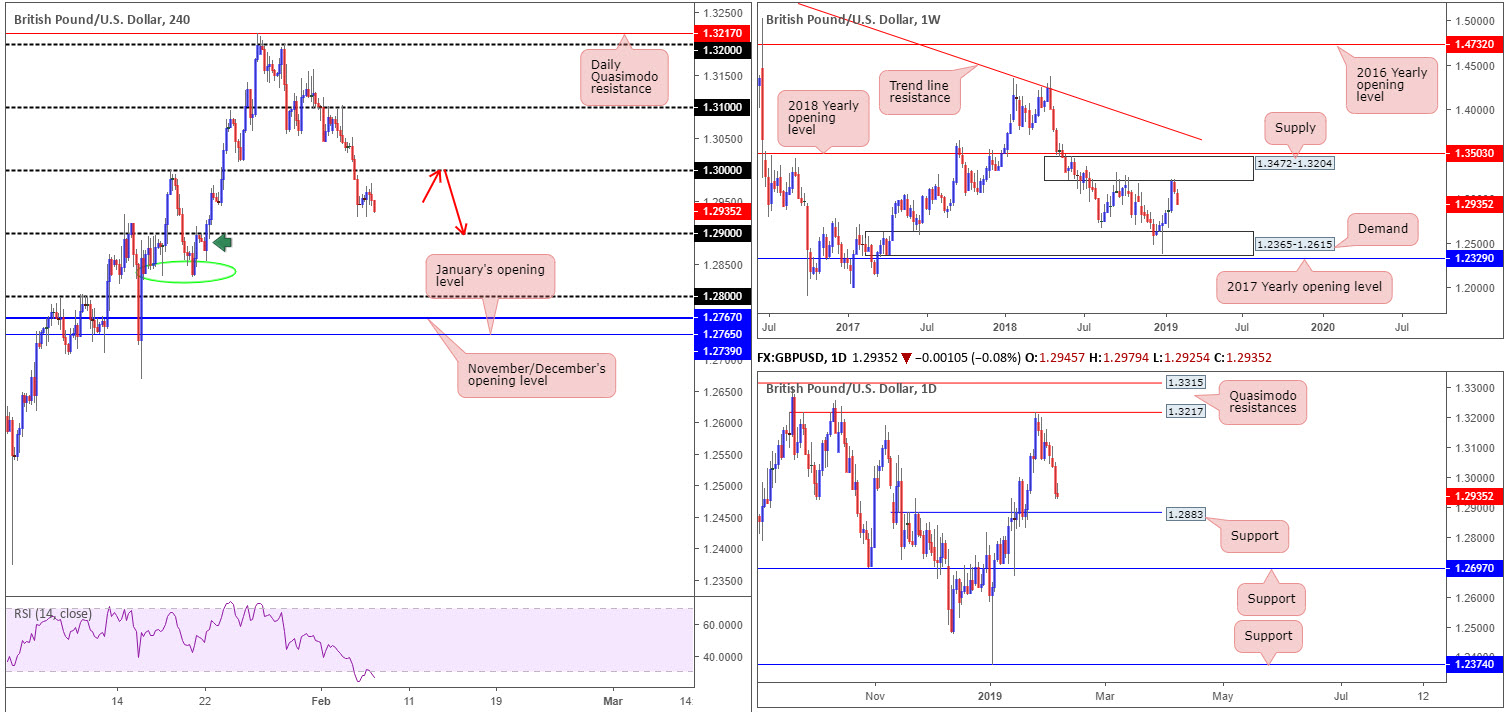
Wednesday observed a consolidative phase take shape mid-way between 1.30 and 1.29 after Tuesday’s sessions witnessed a firm break of 1.30. Dictated largely by dollar movement and on-going Brexit uncertainty as PM May spent her second day in Belfast speaking to Irish parties, the H4 candles appear poised to tackle 1.29 today which happens to merge with an area of demand around 1.2888 (green arrow).
Beyond 1.29, traders may want to acknowledge a local base of support around 1.2830 (green oval), shadowed closely by another layer of psychological support at 1.28. Before reaching 1.2830, though, daily support enters the fray around 1.2883 (this was a Quasimodo resistance-turned support). A violation of this level opens the gates to further selling on the daily timeframe towards support at 1.2697.
Against the backdrop of H4 and daily flow, weekly structure suggests vulnerability in this market. Having seen weekly price extend its downside presence from supply at 1.3472-1.3204 (with room seen to press as far south as demand coming in at 1.2365-1.2615), sellers on this scale appear firmly in the driving seat at the moment.
Areas of consideration:
On account of recent developments, as underscored in Wednesday’s briefing, the research team has eyes on the 1.30 level in the form of a retest play (red arrows). In the event this comes to fruition, targeting the 1.29 handle is a logical base, shadowed closely by daily support drawn from 1.2883.
Conservative traders may opt to wait and see if H4 price chalks up a bearish candlestick pattern off 1.30 at the retest. By having this in the bag, not only do traders boast additional selling confirmation, the structure also provides entry and stop parameters.
Should we fail to retest 1.30, which judging by the current picture, looks like we might, drilling down to the lower timeframes and searching for support-turned resistance patterns to trade could be an option towards 1.29.
Today’s data points: BoE Inflation Report; MPC Official Bank Rate Votes; Monetary Policy Summary and Official Bank Rate; FOMC Member Clarida Speaks.
AUD/USD:
Down 1.77%, the Australian dollar encountered heavy selling vs. its US peer Wednesday. As anticipated, the Reserve Bank of Australia announced it kept its policy rate unchanged at 1.5%. While the opening response to the RBA was relatively muted, the commodity currency experienced a heavy wave of selling after RBA Governor Lowe shifted forward guidance to a more neutral bias vs. the prior tightening stance while speaking at the National Press Club in Sydney.
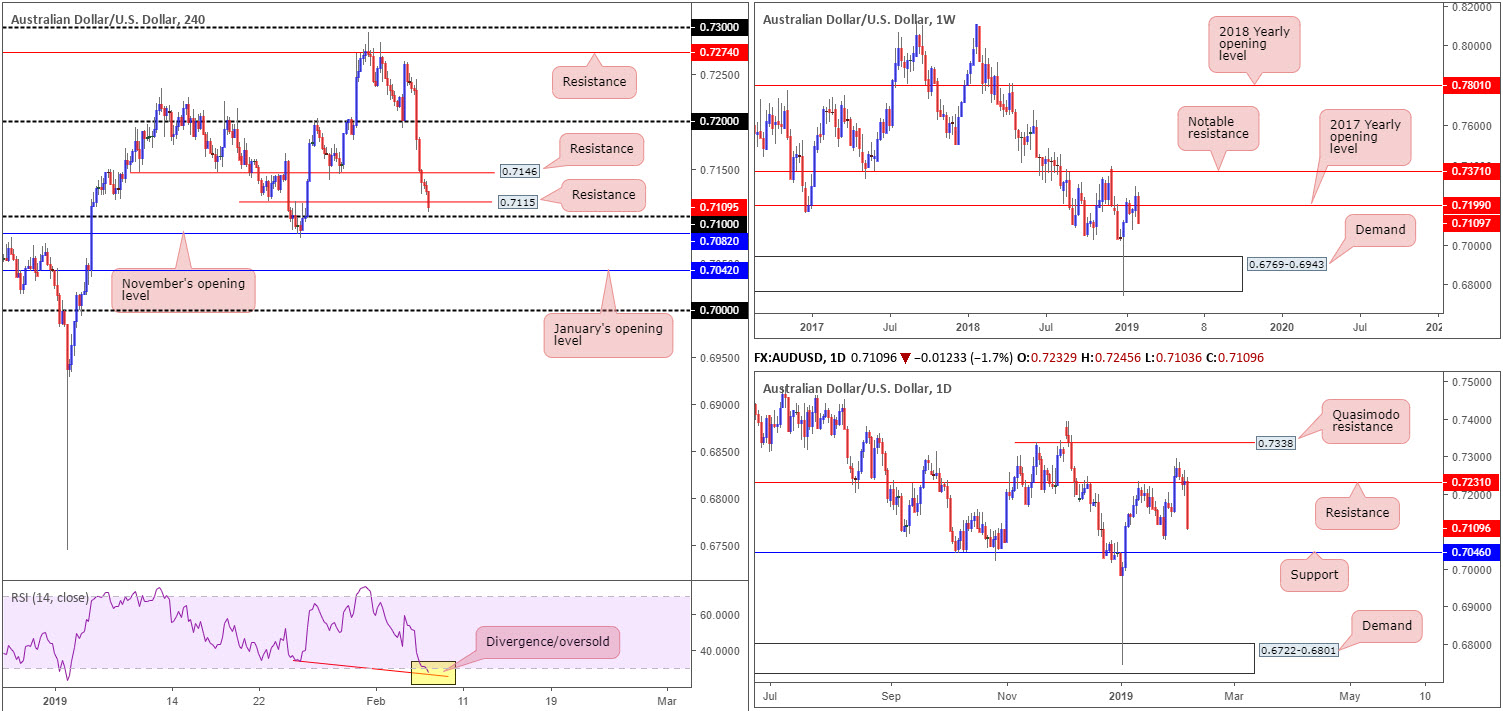
A number of technical support levels were engulfed as a result of yesterday’s selloff, most prominent being the 2017 yearly opening level on the weekly timeframe at 0.7199. This move, assuming further downside is seen, could extend as far south as demand plotted at 0.6769-0.6943.
Daily flow, as you can probably see, is hovering nearby the 0.7076 January 25 low that’s followed closely by notable support emerging from 0.7046. Lower down the curve, we can see the H4 candles trading within striking distance of 0.71. This level, according to our technical studies, boasts little in terms of supplementary confluence. In addition, resistance is seen close by at 0.7115, tailed closely by another port of resistance at 0.7146. Mention should also be made to the RSI indicator currently displaying a divergence/oversold reading.
Areas of consideration:
Although this may appear a sellers’ market right now, shorting the break of 0.71 lands traders at the helm of November’s opening level at 0.7082.
A break of 0.7082 to the downside, however, unlocks the door to a possible intraday shorting opportunity in the direction of January’s opening level at 0.7042/daily support mentioned above at 0.7046. In order to secure entry, traders are urged to drill down to the lower timeframes and attempt to pin down a bearish candlestick configuration on any retest seen at 0.7082.
Today’s data points: FOMC Member Clarida Speaks.
USD/JPY:
Alongside US equities, the USD/JPY market concluded the day unmoved, ranging between 110.05/109.56.
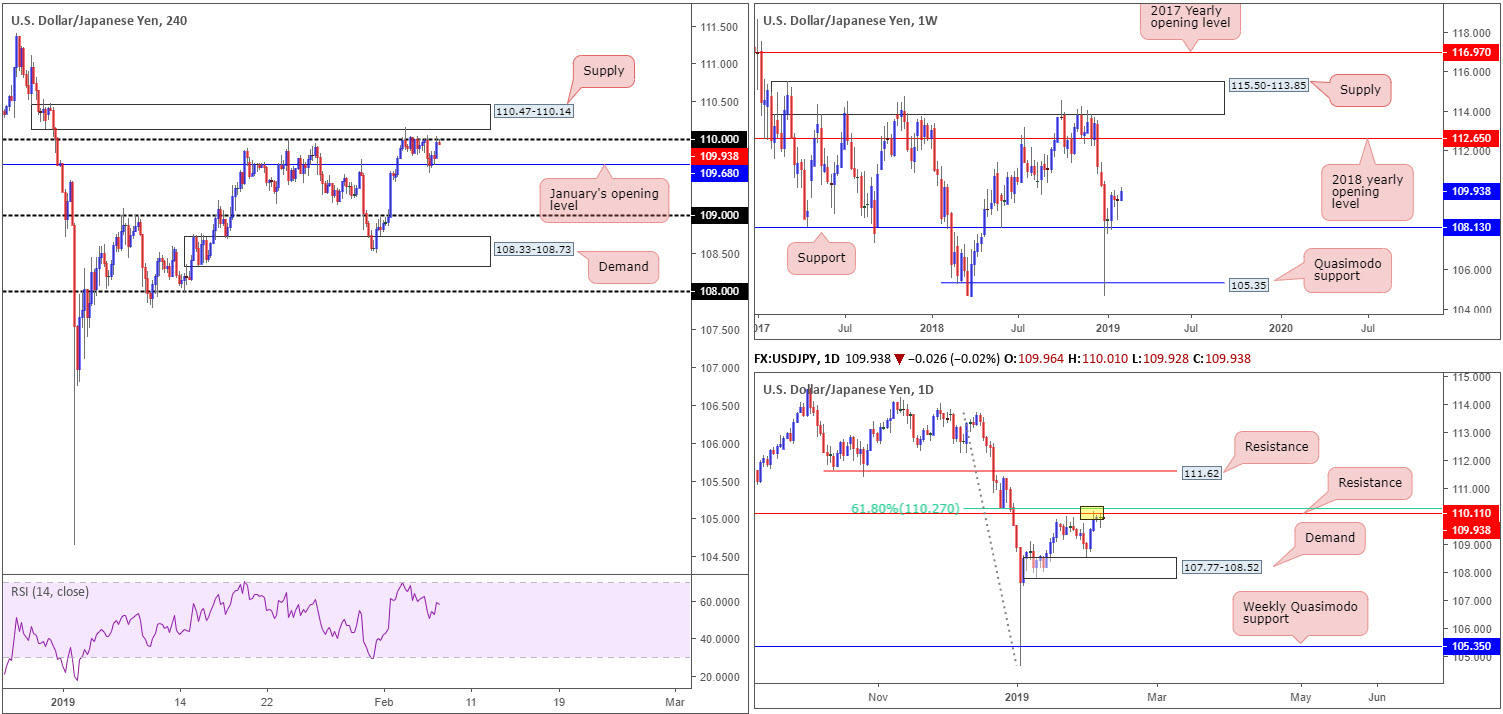
The 110 handle remains a forceful ceiling in this market. Wednesday’s intraday flow witnessed a modest selloff form from here, though swiftly met strong buying opposition off January’s opening level at 109.68. The H4 supply hovering above 110 at 110.47-110.14 remains of interest.
Another push above 110 not only trips stop-loss orders from traders attempting to fade the psychological mark, which, when filled, become buy orders to sell in to, breakout buyers will also likely attempt to join the movement here. This offer of liquidity to sell to, coupled with daily resistance seen plotted at 110.11 (and its nearby 61.8% Fibonacci resistance value at 110.27), will likely offer traders another opportunity to sell the current supply zone.
The only grumble in regard to selling the pair is weekly price trading above support at 108.13 and demonstrating room to press as far north as the 2018 yearly opening level at 112.65.
Areas of consideration:
Traders who believe the H4 supply and daily resistance is enough evidence to draw sellers’ attention will likely short this market at 110.14 with stop-loss orders planted just north of 110.47. Once, or indeed if, the H4 candles reclaim 109.68 to the downside, this may be a good opportunity to begin thinking about reducing risk to breakeven and taking partial profits off the table.
For conservative traders, threatened by weekly structure exhibiting potential to the upside, waiting for additional candlestick confirmation might be an idea worth exploring before pulling the trigger (entry/stop parameters can be defined according to this structure).
Today’s data points: FOMC Member Clarida Speaks.
USD/CAD:
A clear G10 laggard, the Canadian dollar suffered Wednesday amid choppy oil action and a rising greenback. Downside was further aggravated by BoC Deputy Governor Lane highlighting the temporary slowdown in Canada and rising US rates pressuring the CAD.
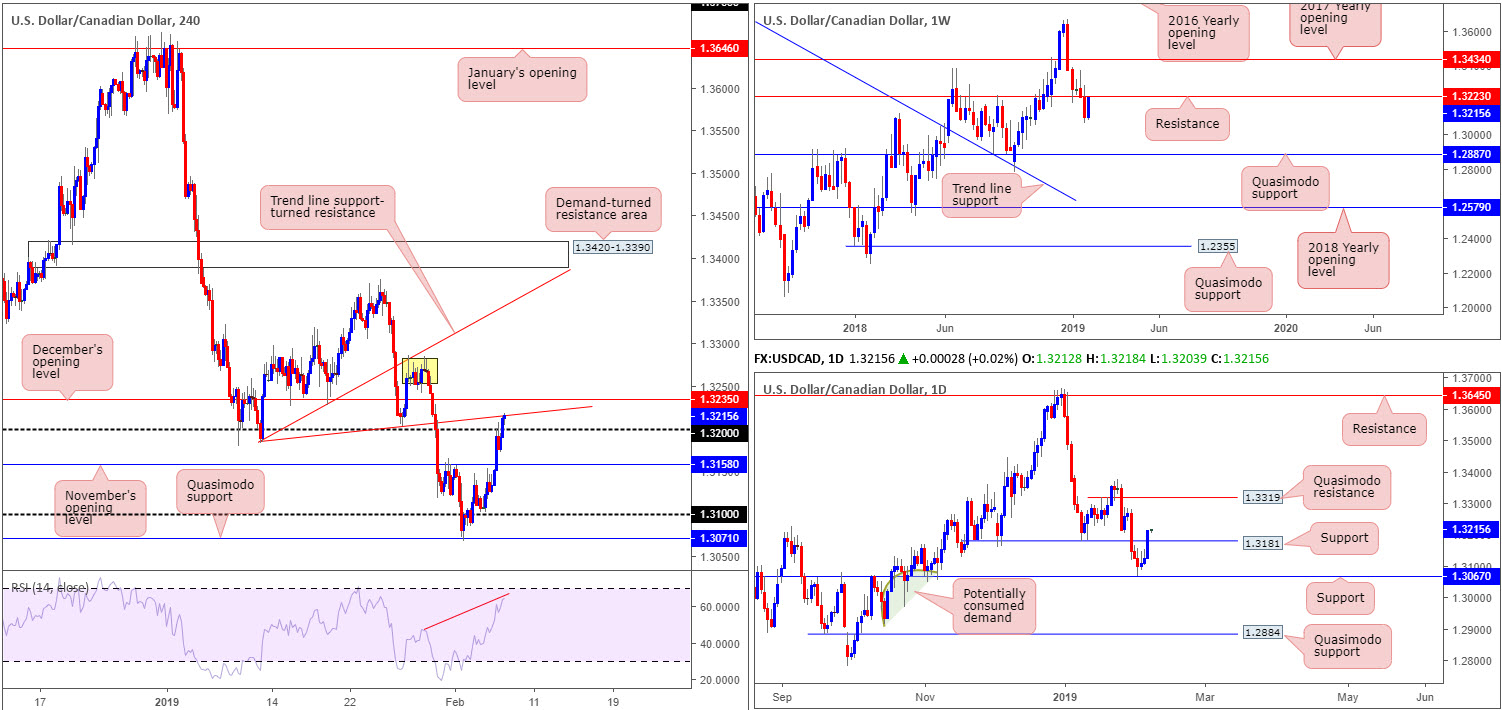
USD/CAD bulls, as you can see on the H4 chart, conquered not only November’s opening level at 1.3158 but also the round number 1.32 as well. The next upside objective, beyond the current H4 trend line support-turned resistance (extended from the low 1.3184), is drawn from December’s opening level at 1.3235, followed closely by an area of potential supply marked in yellow around 1.3266. It might also be of interest to some traders to note the RSI indicator is currently displaying a divergence reading.
On a wider perspective, daily price, in the shape of a full-bodied bull candle, punctured resistance at 1.3181 (now acting support) and exposed Quasimodo resistance at 1.3319. Higher up the curve, nevertheless, weekly price is seen within a few pips of reaching notable resistance at 1.3223.
Areas of consideration:
In light of weekly price trading within close proximity of a resistance band at 1.3223 and H4 action testing a trend line support-turned resistance that’s bolstered by another layer of nearby resistance on the H4 scale at 1.3235 (December’s opening level), a selloff from here could take place today (stop-loss orders can be positioned above 1.3235). The only drawback we see here is daily support will likely re-enter the fight at 1.3181. This may not cause too much of a problem, though, as let’s remember where we’re coming from on the weekly timeframe.
Today’s data points: Today’s data points: FOMC Member Clarida Speaks.
The use of the site is agreement that the site is for informational and educational purposes only and does not constitute advice in any form in the furtherance of any trade or trading decisions.
The accuracy, completeness and timeliness of the information contained on this site cannot be guaranteed. IC Markets does not warranty, guarantee or make any representations, or assume any liability with regard to financial results based on the use of the information in the site.
News, views, opinions, recommendations and other information obtained from sources outside of www.icmarkets.com.au, used in this site are believed to be reliable, but we cannot guarantee their accuracy or completeness. All such information is subject to change at any time without notice. IC Markets assumes no responsibility for the content of any linked site. The fact that such links may exist does not indicate approval or endorsement of any material contained on any linked site.
IC Markets is not liable for any harm caused by the transmission, through accessing the services or information on this site, of a computer virus, or other computer code or programming device that might be used to access, delete, damage, disable, disrupt or otherwise impede in any manner, the operation of the site or of any user’s software, hardware, data or property.


