EUR/USD:
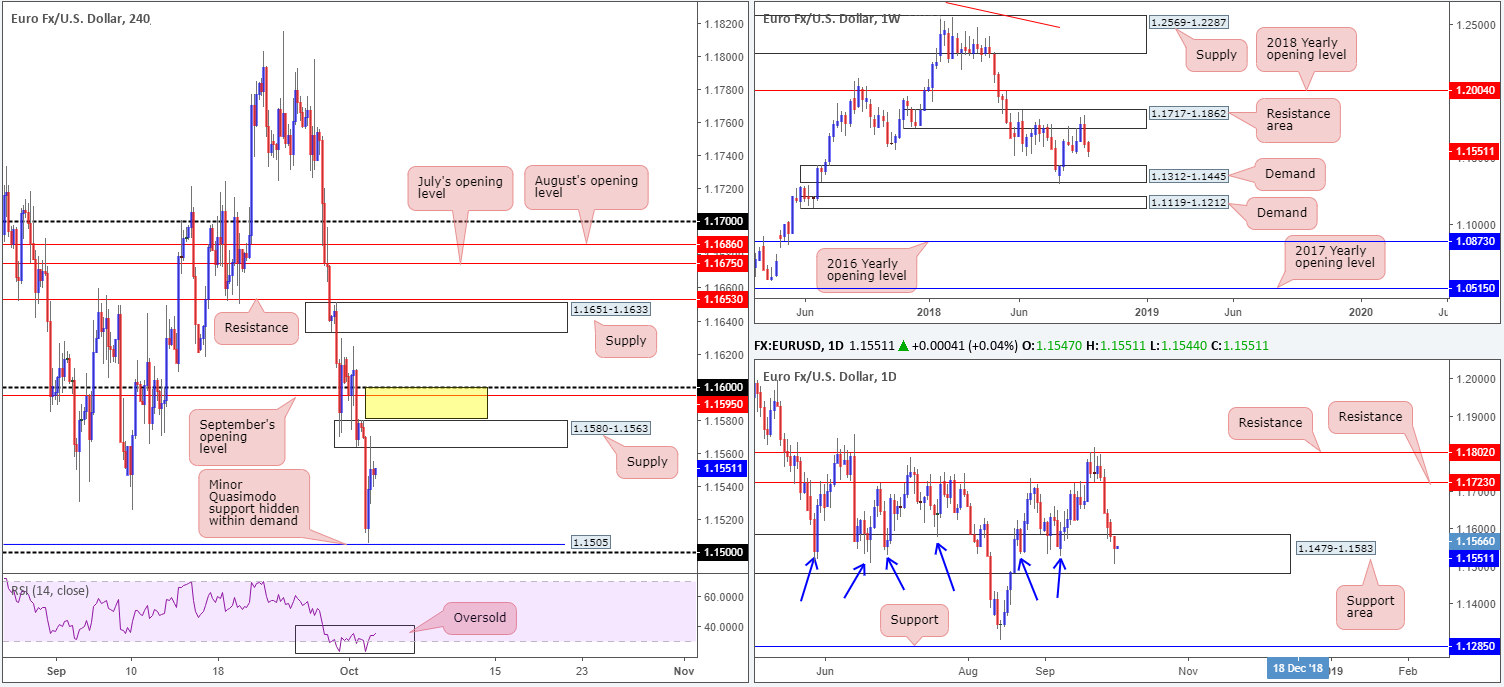
Throughout the course of Tuesday’s sessions, the single currency fist bumped a minor H4 Quasimodo support level at 1.1505 to the pip, having breached numerous downside chart levels from a peak of 1.1580 amid EU criticism over Italy’s budget.
The day concluded with the H4 candles challenging a newly formed supply coming in at 1.1580-1.1563. In conjunction with this zone, our technical studies observe a downside bias on the weekly timeframe, following last week’s bearish engulfing formation printed from a resistance area at 1.1717-1.1862. Assuming further selling takes place this week, traders could attempt a run towards demand drawn from 1.1312-1.1445. The key observation on the daily timeframe, however, is a notable support area at 1.1479-1.1583. It might be worth noting a break of this zone immediately places weekly traders within close proximity of its demand mentioned above at 1.1312-1.1445.
Areas of consideration:
A fakeout of the current H4 supply zone to bring in sellers from September’s opening level at 1.1595/round number 1.16 is a possibility today (yellow zone represents a fakeout area).
A short from 1.1600s would place one against possible daily buying out of 1.1479-1.1583, though in-line with weekly flow. Given this conflicting view, waiting for a H4 bearish candlestick formation to emerge off 1.16 is recommended before pulling the trigger. For those who prefer to trade without candlestick confirmation, a safe stop-loss position, according to technical structure, is likely beyond the October 1st high at 1.1624.
In the event a trade from 1.16 comes to fruition, the ultimate downside target falls in around 1.1445: the top edge of the weekly demand. Interim downside targets, nevertheless, can be seen at the top edge of H4 supply: 1.1580, followed by the minor H4 Quasimodo support at 1.1505/1.15.
Today’s data points: German banks closed in observance of German Unity Day; US ADP non-farm employment change; US ISM non-manufacturing PMI; FOMC members Barkin, Brainard and Mester, along with Fed Chair Powell also take to the stage.
GBP/USD:
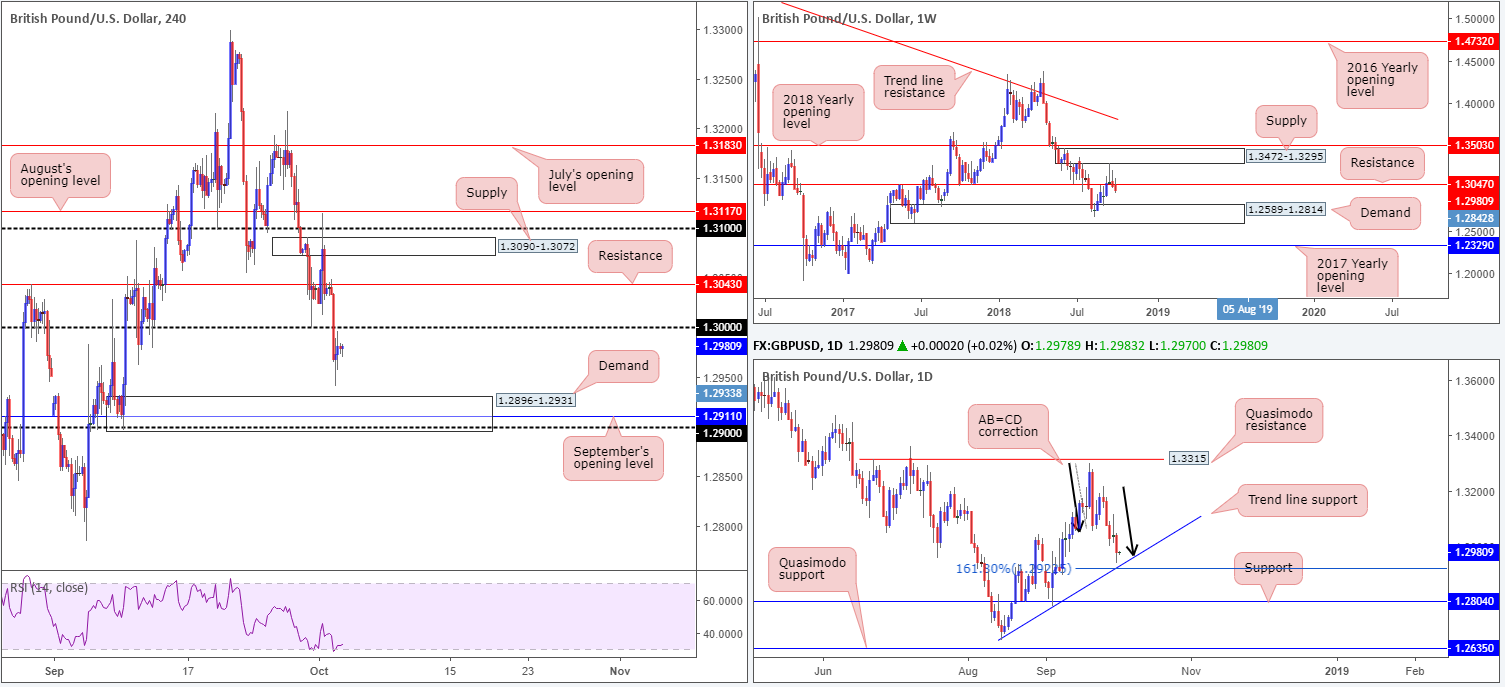
Cable rebounded from sub 1.2950 lows on Tuesday, having accelerated losses through its 1.30 handle on the H4 timeframe. Stop-loss orders were triggered on a break of the big figure, following a disappointing UK construction PMI read. The modest recovery from the mentioned lows is said to be at the hands of Former Foreign Minister, Boris Johnson, who called Tories to back PM May and her Chequers’ plan. The headline offered some respite, though the unit was unable to reclaim its 1.30 barrier. This morning likely has traders honing in on the 1.30 level as a potential retest play as resistance, targeting H4 demand at 1.2896-1.2931 (houses September’s opening level at 1.2911 and the 1.29 handle).
On a wider perspective, weekly movement is making ground beneath its resistance level at 1.3047. Further selling from this region could eventually witness a test of demand at 1.2589-1.2814. The daily candles, nonetheless, are trading within striking distance of a trend line support (extended from the low 1.2661) and an AB=CD bullish correction pattern (black arrows). Pattern completion, however, in our humble view, does not occur until we reach 1.2927: its 161.8% Fib ext. point (frequently labelled an AB=CD alternate pattern).
Areas of consideration:
With 1.30 out of sight as support, a retest to the underside of this number may be on the cards today. As highlighted in Tuesday’s report, a retest in the shape of a bearish candlestick formation would likely be enough evidence to suggest further selling towards H4 demand at 1.2896-1.2931. Stop-loss orders and entry are dictated by the candlestick structure selected.
The H4 demand, aside from being a take-profit target for shorts, is also a zone worthy of longs. Not only does it house September’s opening level at 1.2911 and the 1.29 handle, it also converges with the daily AB=CD termination point at 1.2927. Collectively, this is likely enough confluence to produce a bounce, at the very least.
Today’s data points: UK services PMI; US ADP non-farm employment change; US ISM non-manufacturing PMI; FOMC members Barkin, Brainard and Mester, along with Fed Chair Powell also take to the stage.
AUD/USD:
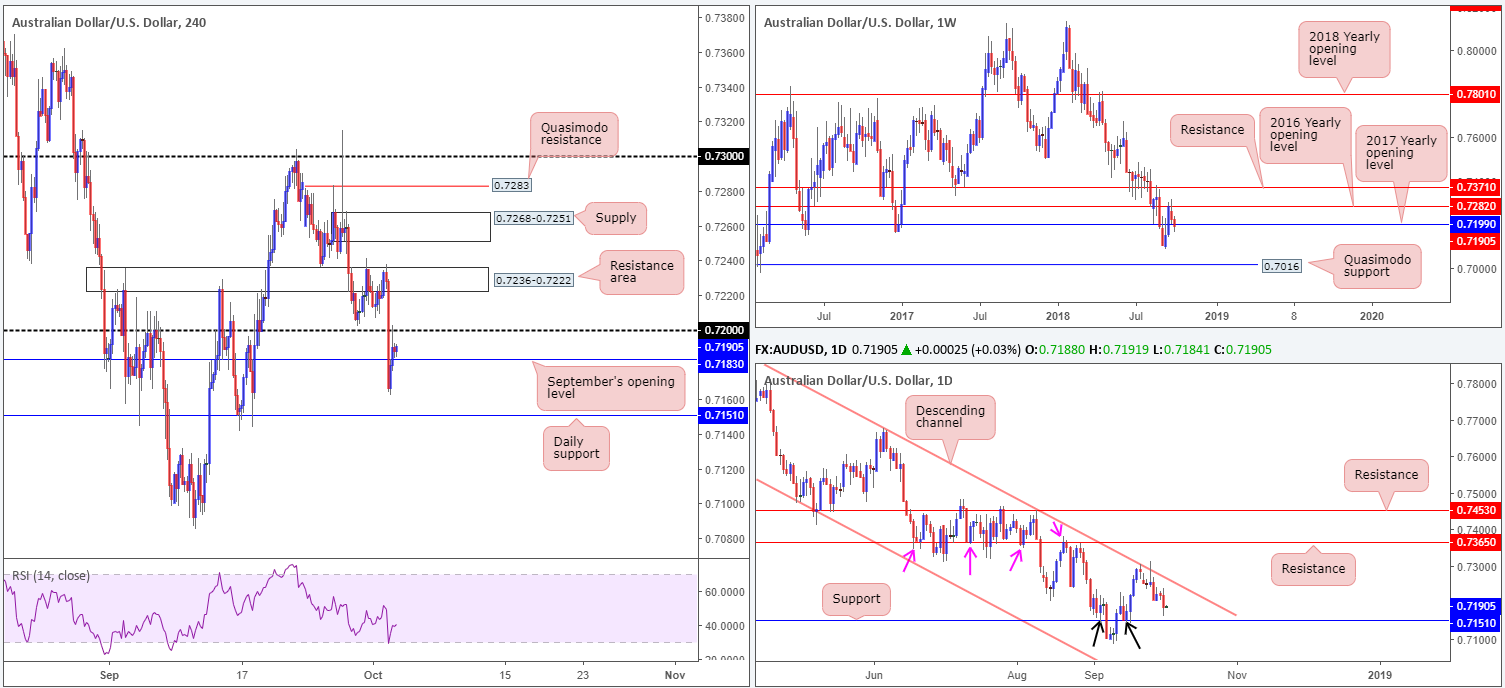
Risk-off sentiment dragged the commodity currency through its 0.72 handle to lows of 0.7162 on Tuesday. Although a modest rebound was observed from the said lows, buyers were unable to reclaim 0.72, which is now an acting resistance level. Should sellers remain defensive sub 0.72 today and a break of September’s opening level at 0.7183 is seen, a test of daily support at 0.7151 may take place.
In terms of weekly flow, the pair is trading marginally beneath its 2017 yearly opening level placed at 0.7199 (also represents 0.72 on the H4). On this scale, the September 10 lows of 0.7085 are in view as the next downside support hurdle, followed by Quasimodo support at 0.7016.
Areas of consideration:
Shorts on the break of September’s opening level at 0.7183, although positioned in-line with higher-timeframe flows, offers limited space to maneuver given how close daily support is seen at 0.7151. Unless you’re able to pin down a setup which requires a small enough stop-loss order to accommodate reasonable risk/reward, this is not really a trade worthy of a being labelled as high probability.
What about longs from daily support at 0.7151? Of course, this is also an option today, though the only grumble is weekly price threatening to test its September 10 low 0.7085 after pushing through the 2017 yearly opening level of 0.7199.
On the whole, it appears neither a long nor short seems attractive today. Opting to remain on the sidelines, therefore, may be the better option.
Today’s data points: US ADP non-farm employment change; US ISM non-manufacturing PMI; FOMC members Barkin, Brainard and Mester, along with Fed Chair Powell also take to the stage.
USD/JPY:
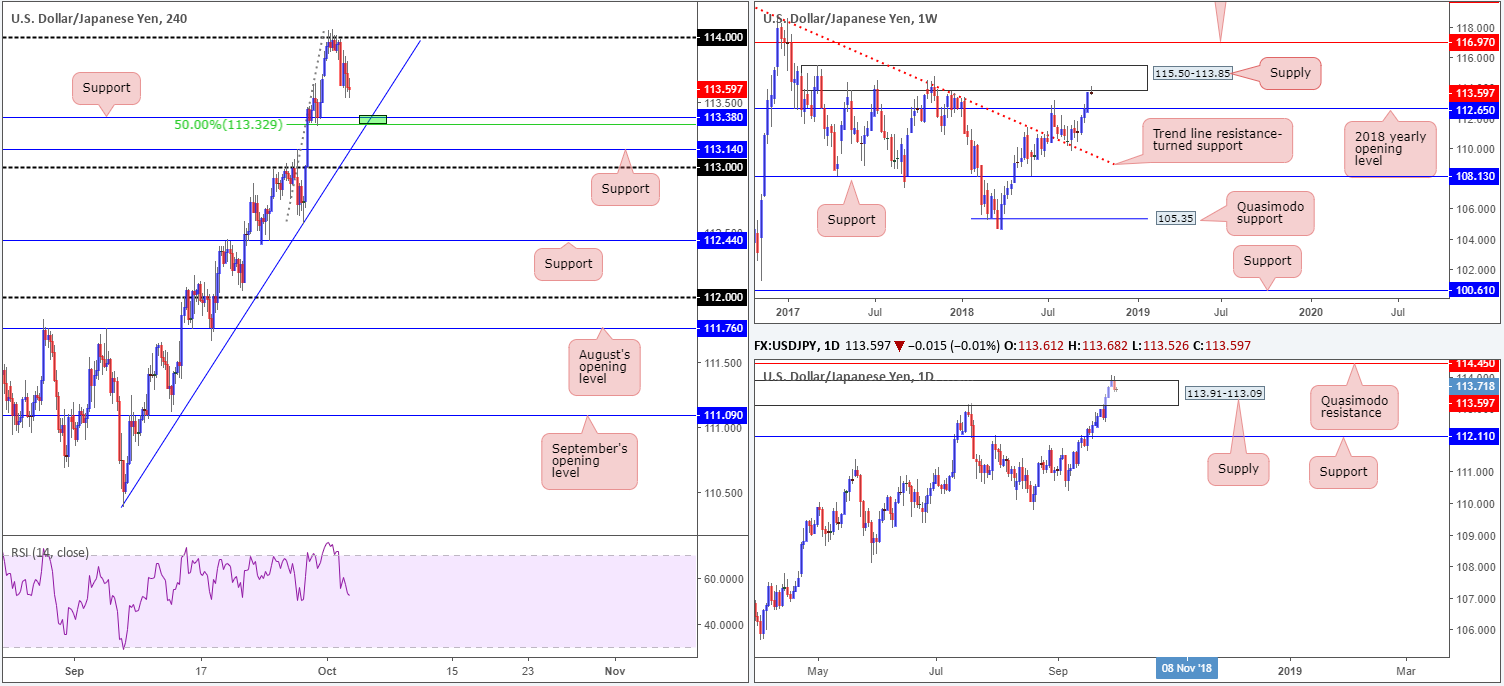
Although the US dollar index recorded its fifth consecutive daily gain yesterday, the USD/JPY failed to conquer its 114 handle on the H4 timeframe as investors piled into the safe-haven yen amid risk-off sentiment.
Short-term studies observes a key support level drawn from 113.38 as the next downside target. Traders may also want to acknowledge the intersecting trend line support (taken from the low 110.38), as well as a 50.0% support value at 113.33.
Major supply on the weekly timeframe at 115.50-113.85 recently elbowed its way into the spotlight, offering a potential rotation back to support penciled in at 112.65: its 2018 yearly opening level. Recent movement also witnessed daily supply at 113.91-113.09 suffer a breach. This move likely stopped out a truckload of sellers unaware they had stops placed at a point weekly sellers were likely to enter the market! This is why multi-timeframe analysis is so important.
Areas of consideration:
Intraday, the radar is likely fixed on the intersecting H4 support at 113.38 and aforementioned H4 trend line support/50% support (green zone). However, traders should expect no more than a bounce from here in light of where we’re coming from on the higher timeframes: weekly supply!
Unfortunately, we do not see much in the way of resistance to sell on the H4 timeframe, unless, of course, a second retest is seen at 114. A H4 bearish candlestick formation printed from this psychological barrier would, according to the higher timeframes, be considered a high-probability shorting opportunity. Stop-loss orders and entry are determined on the candlestick structure selected.
Today’s data points: US ADP non-farm employment change; US ISM non-manufacturing PMI; FOMC members Barkin, Brainard and Mester, along with Fed Chair Powell also take to the stage.
USD/CAD:
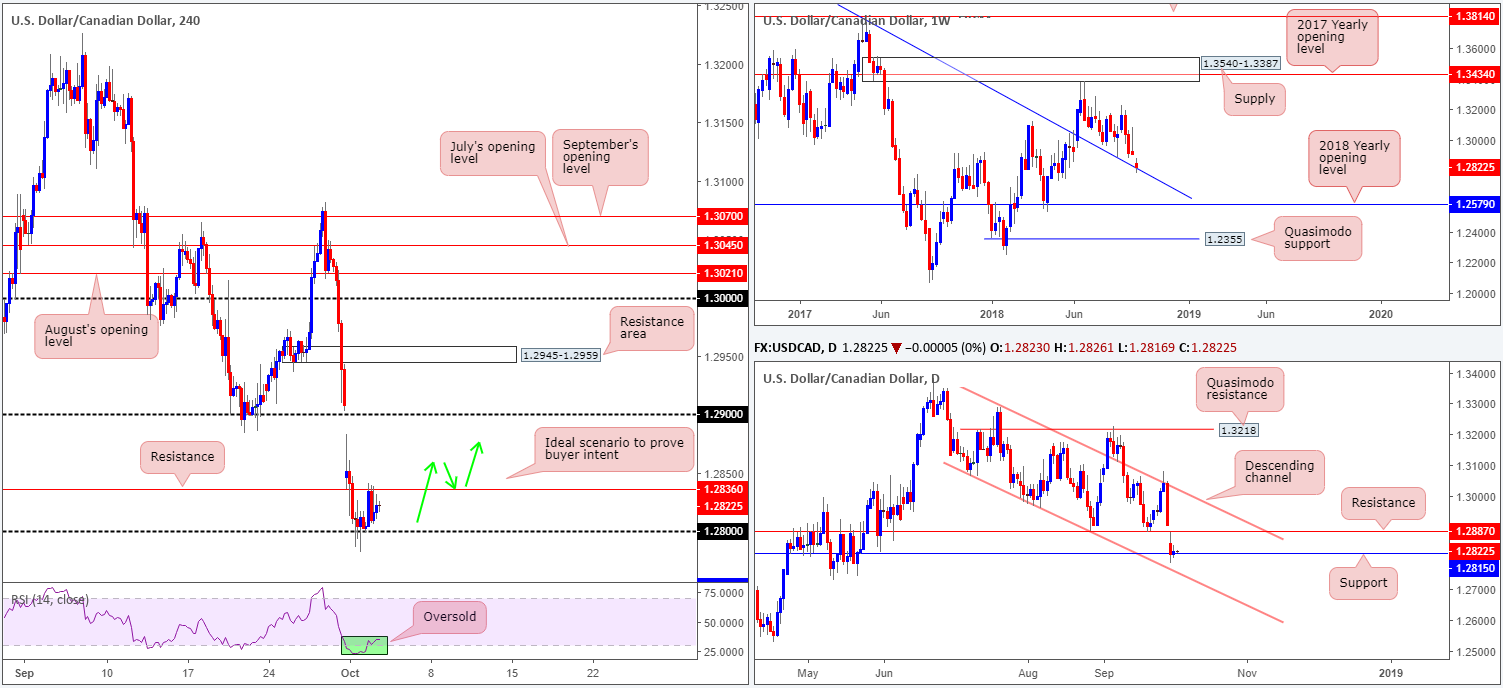
Despite the market eking out marginal gains on Tuesday, technical structure remains unchanged.
Price action on the weekly scale, thanks to Monday’s precipitous decline, is seen tackling a trend line resistance-turned support (extended from the high 1.4689). This barrier supported this market once already back in late August, so there’s a chance we may see history repeat itself.
The story on the daily timeframe, nevertheless, brings attention to support at 1.2815 that’s sited just north of a channel support (extended from the low 1.3066).
Across the water on the H4 timeframe, the candles are sandwiched between its 1.28 handle and a resistance level chalked up at 1.2836. Also worth taking into account on this scale is the RSI indicator displaying a strong oversold reading.
Areas of consideration:
From a technical perspective, support is present on all three timeframes we watch:
- Weekly trend line resistance-turned support (extended from the high 1.4689).
- Daily support at 1.2815.
- The 1.28 level on the H4 timeframe.
To prove buyer intent out of these supports, an engulf of nearby H4 resistance at 1.2836 would be ideal. A H4 close above this level that’s followed up with a retest in the shape of a bullish candlestick formation would likely be enough to draw in buyer momentum towards daily resistance at 1.2887, followed closely by the 1.29 handle.
As for entry and stop-loss placement, traders are urged to use the selected candlestick pattern to determine these parameters.
Today’s data points: US ADP non-farm employment change; US ISM non-manufacturing PMI; FOMC members Barkin, Brainard and Mester, along with Fed Chair Powell also take to the stage; Crude oil inventories.
USD/CHF:
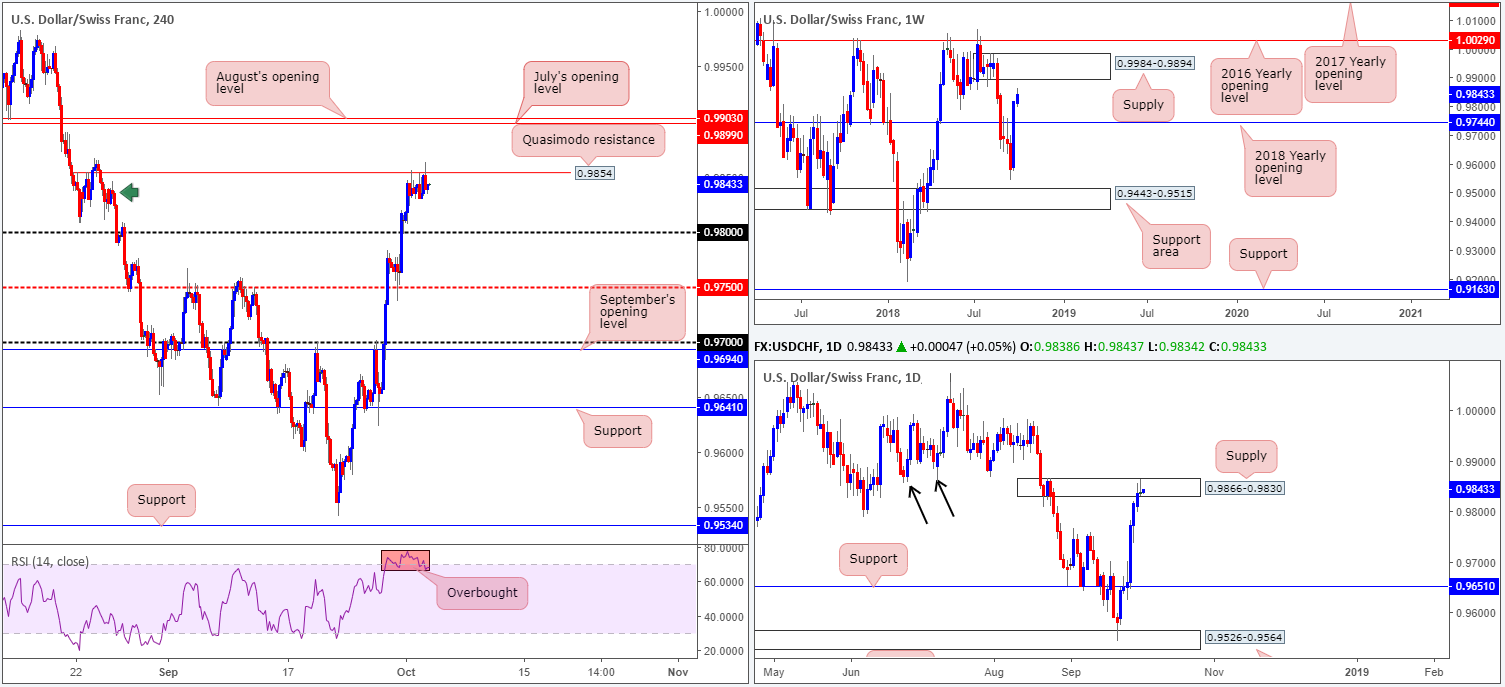
As can be seen from the H4 timeframe this fine Wednesday morning, the Quasimodo resistance at 0.9854 remains firm, despite a push to highs of 0.9863. For those who read our daily briefings you may recall the team highlighted this barrier as a possible sell zone. Despite conservative traders likely taken on a breakeven stop yesterday, the level is still active – even more so considering the strong bearish H4 rotation candle recently seen from here.
The rationale behind selecting this level was simply due to a stop run above H4 supply marked with a green arrow at 0.9845, as well as the level being tightly fixed within the upper limits of a daily supply zone at 0.9866-0.9830.
What also drew attention was the fact the daily supply is attractive, by and of itself. Aside from this area delivering solid downside momentum from its base, it was effectively the decision point to break through support marked with two black arrows around the 0.9855 neighbourhood.
Areas of consideration:
For folks who are short from 0.9838: the close of the recent H4 bearish candle, the 0.98 handle on the H4 timeframe appears a logical downside target. Should price retest 0.98, traders are looking at a risk/reward of nearly twice the position risk, assuming one has placed the stop two pips above the daily supply at 0.9868.
Today’s data points: US ADP non-farm employment change; US ISM non-manufacturing PMI; FOMC members Barkin, Brainard and Mester, along with Fed Chair Powell also take to the stage.
Dow Jones Industrial Average:
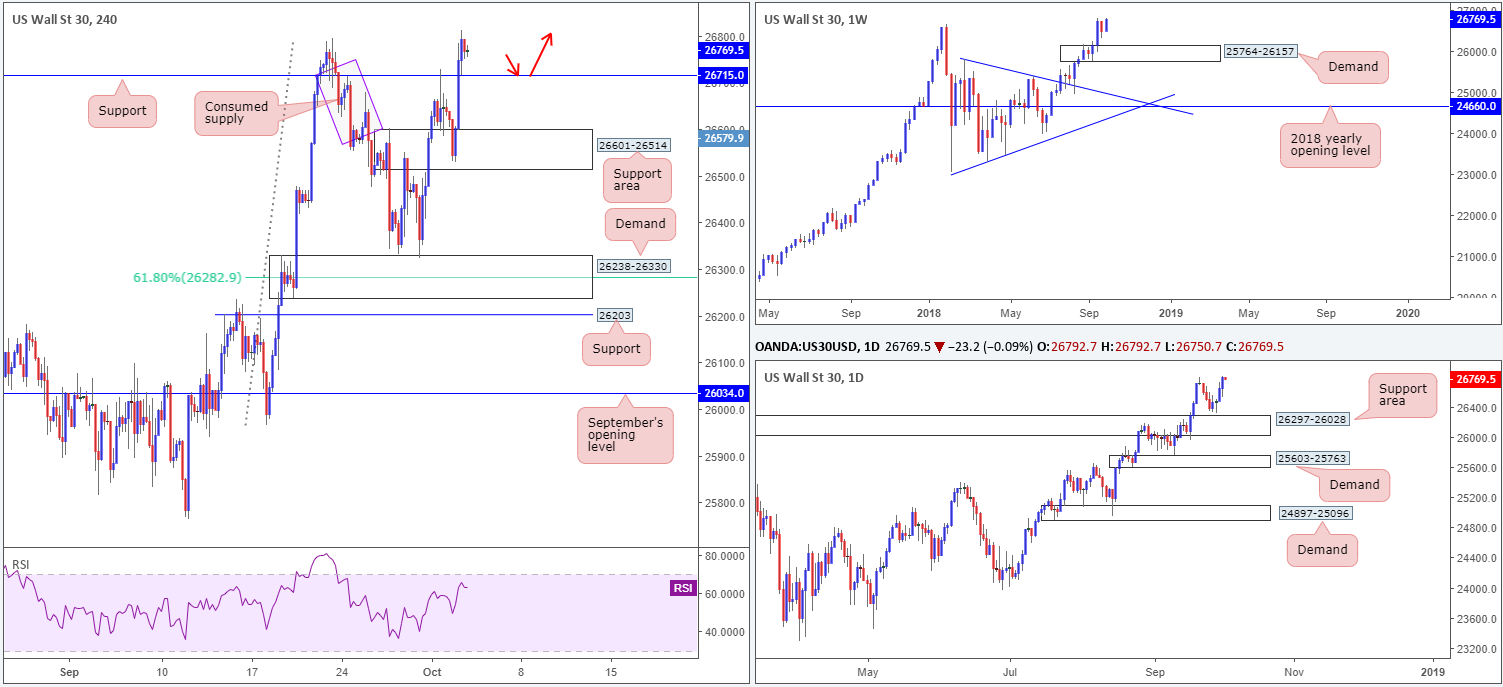
US equities began the day on a weak footing amid concerns over Italy’s budget crisis. Despite this, the H4 support area at 26601-26514, an area the team highlighted as a possible buy zone in Tuesday’s report, held its ground beautifully. Well done to any of our readers who took advantage of the move out of this area, as the index punched to a fresh record high of 26811.
Why we liked this area, aside from there being limited H4 supply seen to the left of current price, came down to the higher timeframes. The current H4 support area is positioned around the top edge of a daily support area marked at 26297-26028, which itself is reinforced by a weekly demand area visible from 25764-26157.
Areas of consideration:
With the unit seen trading at record highs, intraday attention is drawn to the nearby H4 support at 26715. A firm retest off of this level (red arrows) in the form of a bullish candlestick formation would likely be enough to encourage further buying. Not only does this setup give traders a second chance to enter long should they have missed the initial call from the aforementioned demand, it also offers traders who are currently long the chance to pyramid their position.
Today’s data points: US ADP non-farm employment change; US ISM non-manufacturing PMI; FOMC members Barkin, Brainard and Mester, along with Fed Chair Powell also take to the stage.
XAU/USD (Gold)
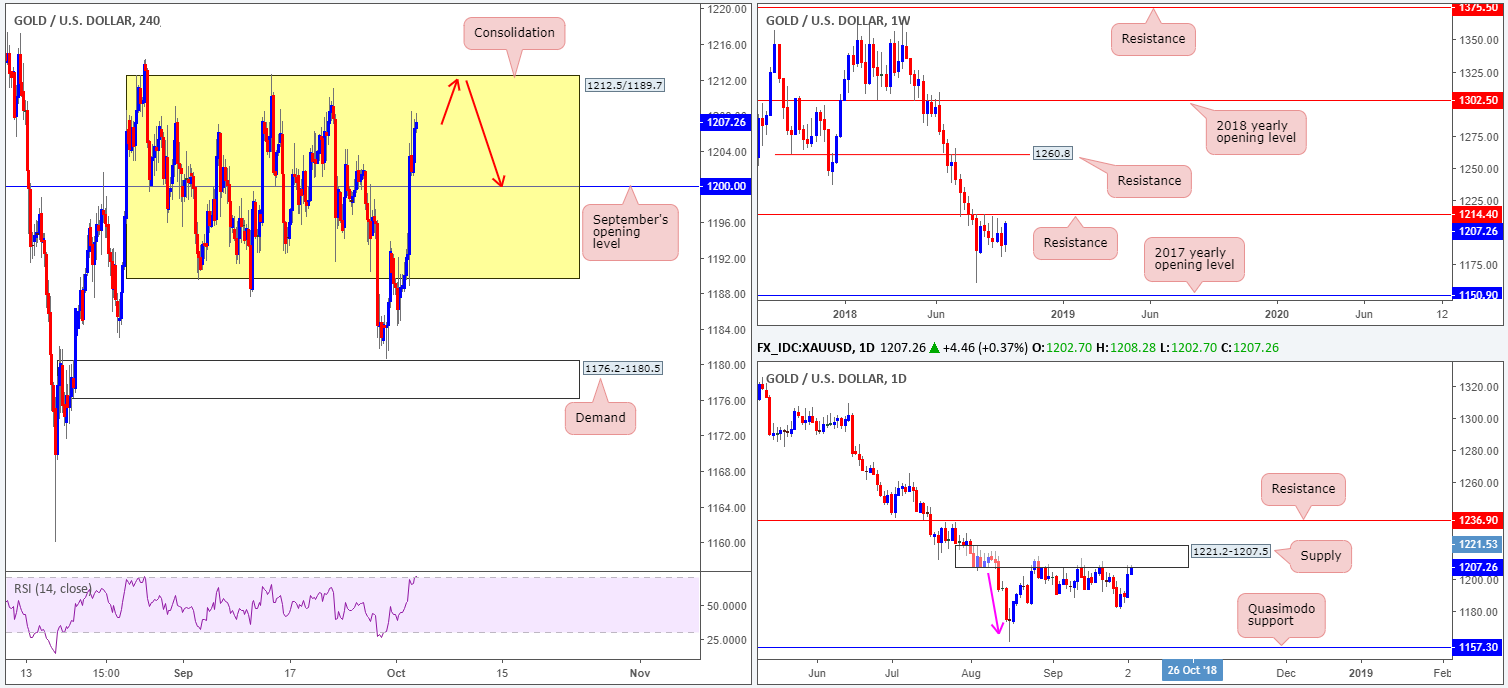
On the back of a waning USD market, the price of gold advanced in recent sessions, firmly breaking back into its H4 consolidation marked in yellow at 1212.5/1189.7. In fact, the H4 candles appear poised to challenge the top edge of this range today!
Support this is a daily supply zone plotted at 1221.2-1207.5. Aside from the base displaying attractive downside momentum (pink arrow), this area could also be considered the ‘decision point’ to print 2018 yearly lows of 1160.3. From current price, structure shows room to press as low as a Quasimodo support at 1157.3. In conjunction with this zone, another factor in favour of a rotation lower is weekly resistance positioned within the walls of the noted daily supply at 1214.4.
Areas of consideration:
Keeping it Simple Simon this morning, traders are urged to keep eyes on the top edge of the current H4 range at 1212.5 for a possible shorting opportunity (red arrows). A H4 bearish candlestick formation chalked in from here would, given the overall technical picture, likely be enough to drawn in sellers and push back into the range. As for entry and stop-loss placement, traders may want to use the selected candlestick pattern to determine these parameters. The first take-profit region within the range can be seen at September’s opening level drawn from 1200.0.
The use of the site is agreement that the site is for informational and educational purposes only and does not constitute advice in any form in the furtherance of any trade or trading decisions.
The accuracy, completeness and timeliness of the information contained on this site cannot be guaranteed. IC Markets does not warranty, guarantee or make any representations, or assume any liability with regard to financial results based on the use of the information in the site.
News, views, opinions, recommendations and other information obtained from sources outside of www.icmarkets.com.au, used in this site are believed to be reliable, but we cannot guarantee their accuracy or completeness. All such information is subject to change at any time without notice. IC Markets assumes no responsibility for the content of any linked site. The fact that such links may exist does not indicate approval or endorsement of any material contained on any linked site.
IC Markets is not liable for any harm caused by the transmission, through accessing the services or information on this site, of a computer virus, or other computer code or programming device that might be used to access, delete, damage, disable, disrupt or otherwise impede in any manner, the operation of the site or of any user’s software, hardware, data or property.