
EUR/USD:
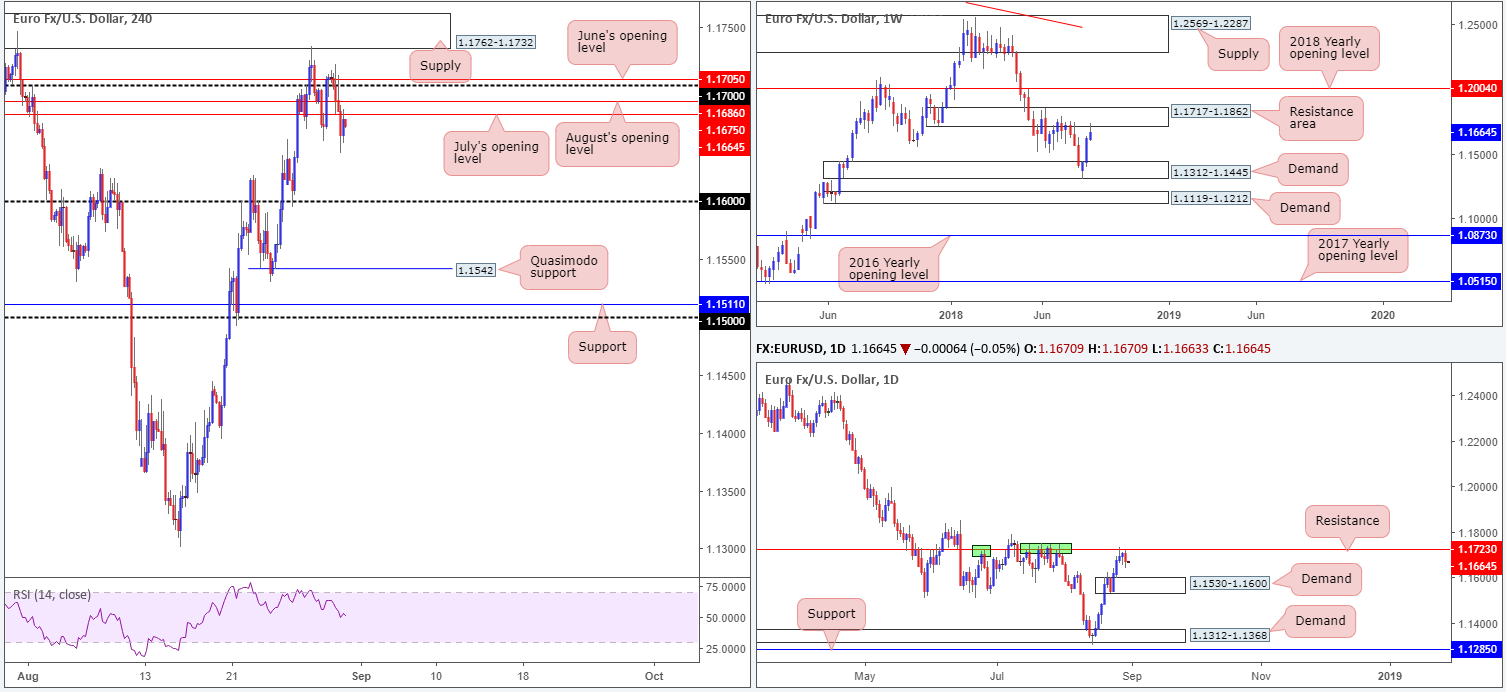
The shared currency encountered relatively strong selling on Thursday, sufficient enough to break a four-day bullish phase. The markets were all about falling emerging currencies yesterday: contagion from TRY selling and Italian jitters ahead of Fitch’s ratings review.
On a wider perspective, technically speaking that is, a move lower was expected. Weekly price recently shook hands with a nice-looking resistance area coming in at 1.1717-1.1862 and shows room to recoil as far south as demand at 1.1312-1.1445. On top of this, daily movement checked in with a resistance level at 1.1723 on Tuesday and yesterday chalked up a bearish engulfing formation. On this scale, the next downside support target can be seen at demand drawn from 1.1530-1.1600.
A closer look at price action on the H4 timeframe places the 1.16 handle in view as the next viable support (also marks the top edge of the aforementioned daily demand), given the H4 candles are seen trading beneath July’s opening level at 1.1675. In fact, 1.1675 could be an ideal location to consider shorts from, seeing as we’re also coming from resistance on the higher timeframes as well!
Areas of consideration:
Shorts from 1.1675, with stop-loss orders tucked above June’s opening level at 1.1705, are an option today. Placing your stops above this number allows the trade room to breathe, along with having the additional protection from August’s opening level at 1.1686 and the 1.17 handle.
Today’s data points: German retail sales m/m; EUR CPI flash estimate y/y; Chicago PMI.
GBP/USD:
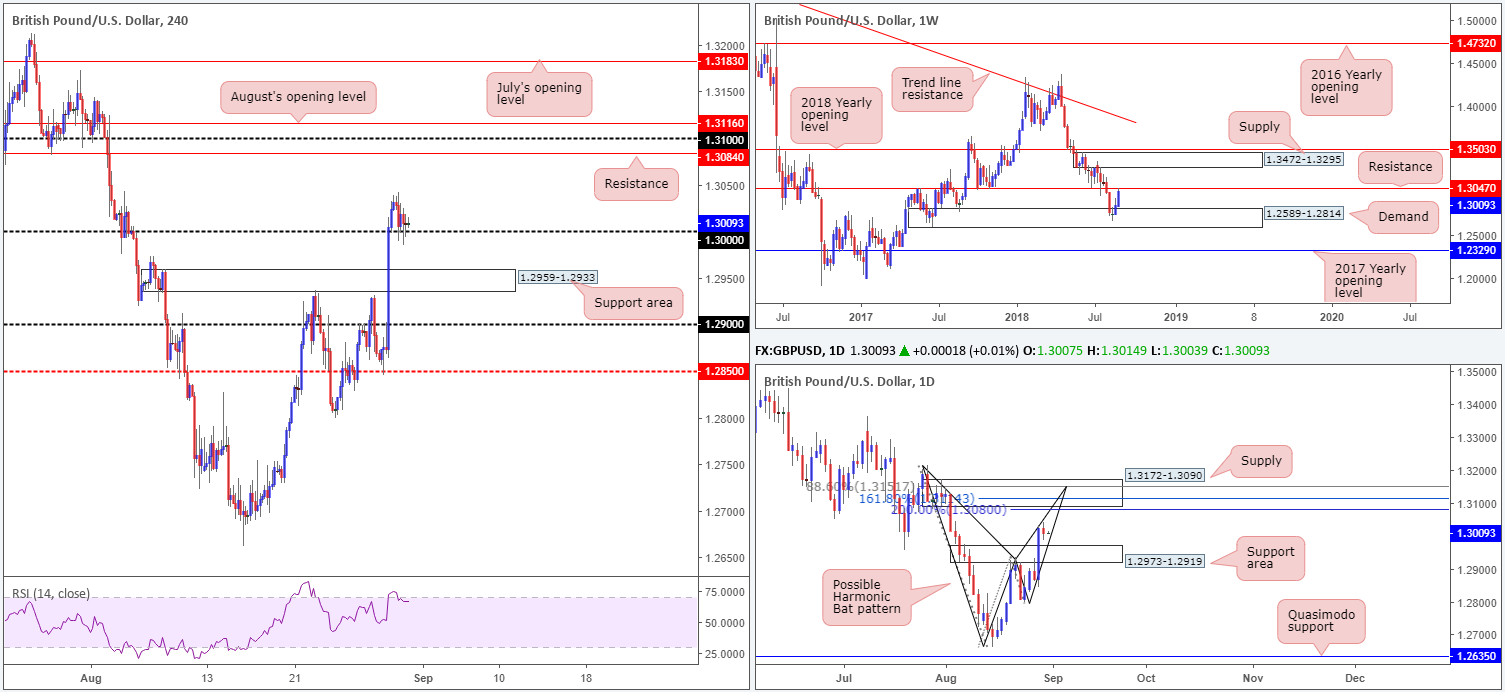
Despite recording a modest loss on Thursday, the British pound retested the 1.30 handle seen on the H4 timeframe and held ground. To our way of seeing things, traders appear to be taking a cautious approach here as EU’s Barnier and UK’s Brexit Secretary Raab meet today.
Another reason behind the lack of bullish enthusiasm off 1.30 yesterday could be the fact weekly price came within striking distance of a key resistance level at 1.3047. On the other side of the field, though, looking at this market from the daily timeframe shows us the buyers have free reign until we reach supply coming in at 1.3172-1.3090. Aside from this zone being considered strong supply, it also converges with a possible harmonic bat completion around 1.3151.
Areas of consideration:
On the one hand, we have weekly price informing us of a possible move lower, whereas on the other hand, both daily and H4 structures show strong support, with the potential to send price as high as 1.3090ish: the underside of the aforementioned daily supply.
By entering long you are effectively buying into weekly resistance, and by entering short you are going up against psychological support and daily demand. As a result, neither a long nor short seems attractive right now.
Today’s data points: Chicago PMI.
AUD/USD:
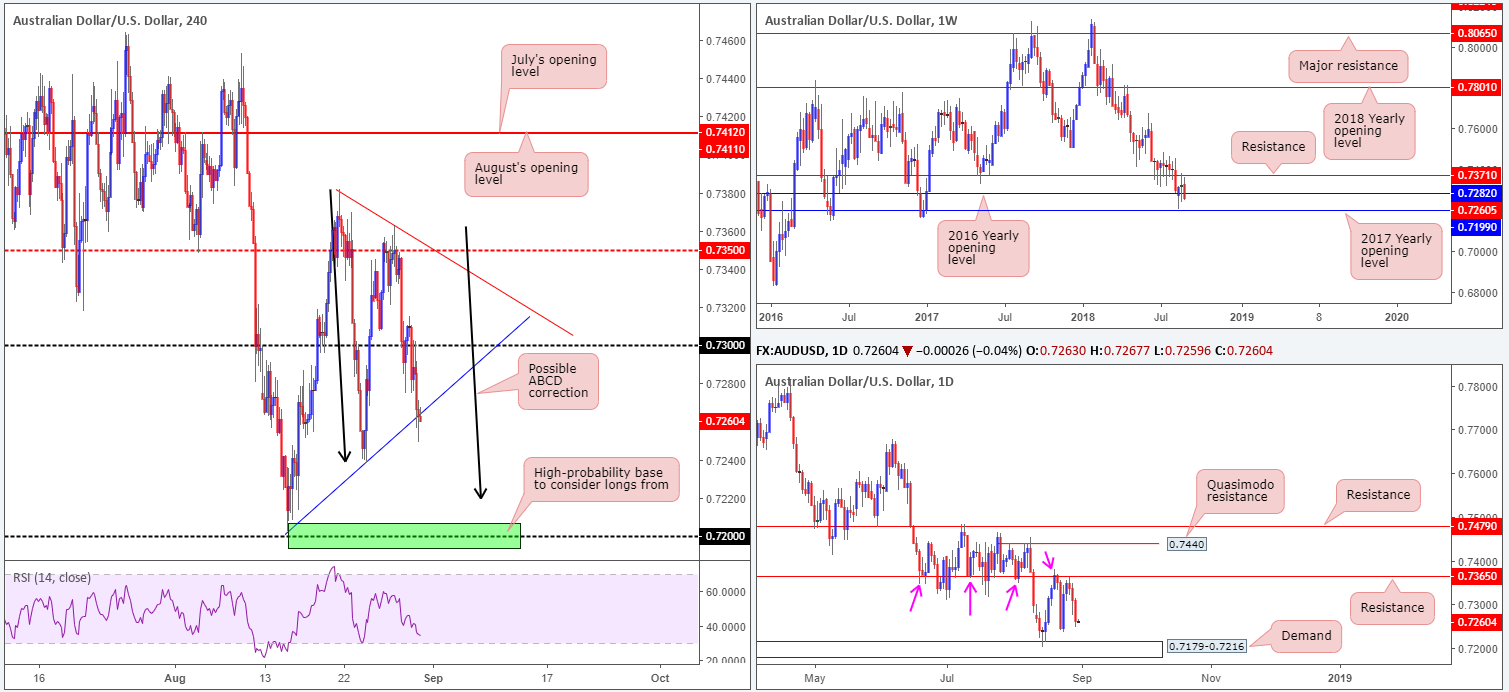
The Australian dollar entered into a phase of selling in early trade on Thursday amid weaker-than-expected local data. Intraday action resumed its decline during US hours on comments from US President Trump, saying he backs applying tariffs on Chinese goods worth $200 billion as early as next week.
Coming in from the top this morning, the markets observed weekly action engulf the 2016 yearly opening level at 0.7282, placing the spotlight on the 2017 yearly opening level at 0.7199 as the next logical support. The story on the daily timeframe, nonetheless, places the commodity currency within shouting distance of last week’s lows: 0.7238, followed closely by demand plotted at 0.7179-0.7216.
While H4 activity is currently seen testing a trend line support (taken from the low 0.7202), an ABCD downside correction (black arrows – extended from the high 0.7381) implies a break of this ascending support may be on the cards. Also worth noting is this ABCD formation completes just ahead of the daily demand area mentioned above at 0.7179-0.7216, which happens to hold within it the 0.72 handle and the 2017 yearly opening level noted above on the weekly timeframe at 0.7199.
Areas of consideration:
Longs from the current H4 trend line support are not considered high probability, due to all three timeframes indicating a potential move south.
The 0.72 handle, however, is an attractive base for longs, according to the overall technical picture. Supported by the 2017 yearly opening level along with being housed within daily demand, a buy from here is an option today, with a stop fixed beneath the daily demand at 0.7179.
Today’s data points: China manufacturing PMI; Chicago PMI.
USD/JPY:
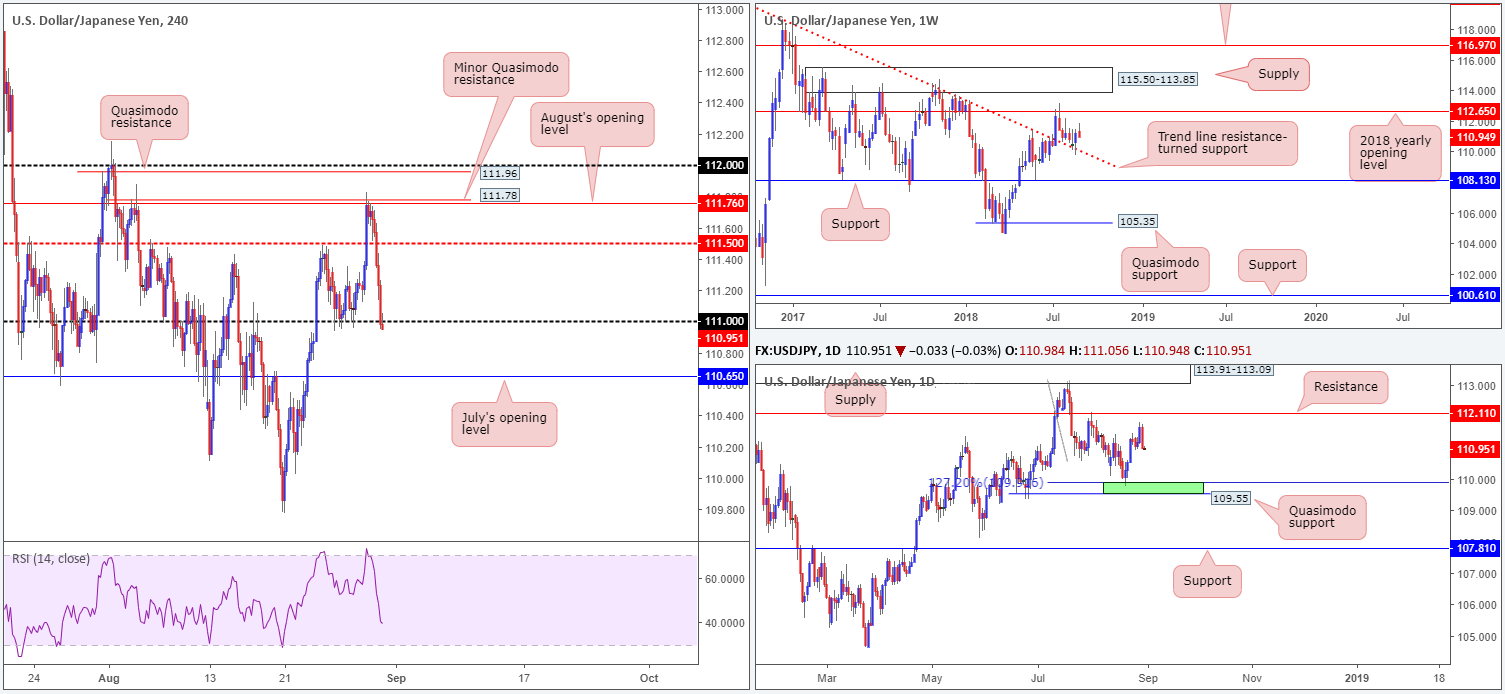
The USD/JPY went back to playing on the defensive on Thursday, as demand for the safe-haven yen strengthened. On the back of a selloff in US equities and falling emerging currencies yesterday: contagion from TRY selling, the H4 candles reclaimed the 111 handle, which appears fragile, as we write. A break of 111 has July’s opening level at 110.65 to target.
Assuming downside pressure continues to be seen, weekly price could eventually retest a trend line resistance-turned support (taken from the high 123.57). In conjunction with weekly price, daily action also displays room to press as far south as 109.55/109.91: a green area comprised of a Quasimodo support level and a 127.2% Fib ext. point taken from the high 113.17.
Areas of consideration:
Intraday shorts below 111, assuming further downside takes shape, could be something to consider today, targeting 110.65. In order to accommodate reasonable risk/reward, however, waiting for price to retest the underside of 111 and entering on a lower-timeframe bearish candlestick signal may be required (stop-loss orders can be positioned beyond the extreme of the candlestick signal). In addition to this, do bear in mind both weekly and daily timeframes show price action could push much lower than 110.65, therefore it could be an idea to leave some of the position on the table to run.
Today’s data points: Chicago PMI.
USD/CAD:
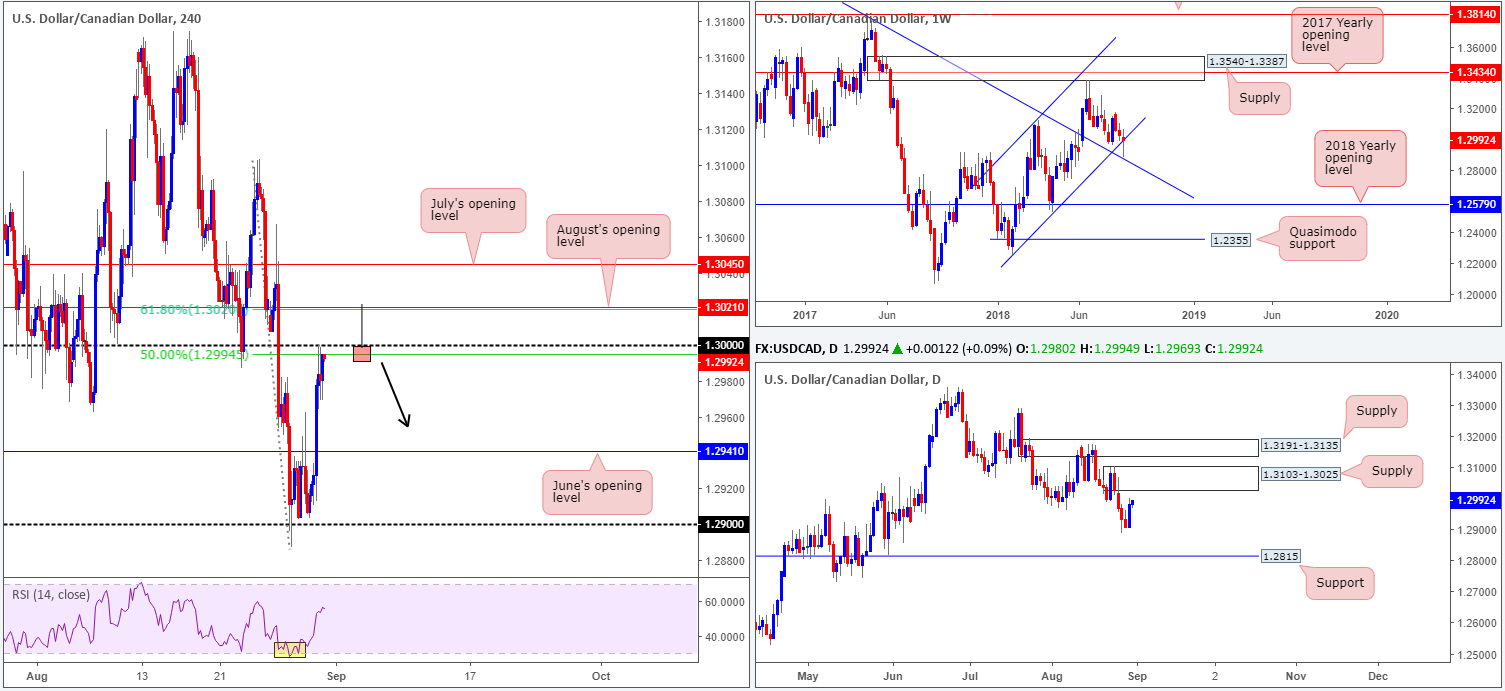
The US dollar strongly advanced against its Canadian counterpart on Thursday, following the release of slightly weaker-than-expected Canadian GDP figures. As is evident from the H4 timeframe, the move smashed through June’s opening level at 1.2941 and eventually touched gloves with the key figure 1.30. Note here a 50.0% resistance value is seen nearby at 1.2994. It may also be worth noting that beyond 1.30 we can see August’s opening level at 1.3021, which happens to unite with a 61.8% Fib resistance at 1.3020.
On a wider perspective, weekly price came within touching distance of testing a trend line resistance-turned support (etched from the high 1.4689) in recent trade, and has since rotated higher. A little lower on the curve, however, daily price is seen nearing the underside of supply coming in at 1.3103-1.3025.
Areas of consideration:
Although 1.30 is holding firm right now, the more attractive level for shorts this morning appears to be around August’s opening level mentioned above at 1.3021. Not only because it converges with a 61.8% H4 Fib resistance level, but also due to the level fusing nicely with the lower edge of daily supply at 1.3025.
An ideal sell, technically speaking, would be for H4 price to chalk up a bearish pin-bar formation that pierces through 1.30 and tests August’s opening level (see chart for a visual representation). A sell on the close of the bearish candle, with a stop above its wick, targeting June’s opening level at 1.2941 as the initial take-profit zone, is then an option.
Today’s data points: Chicago PMI; CAD RMPI m/m.
USD/CHF:
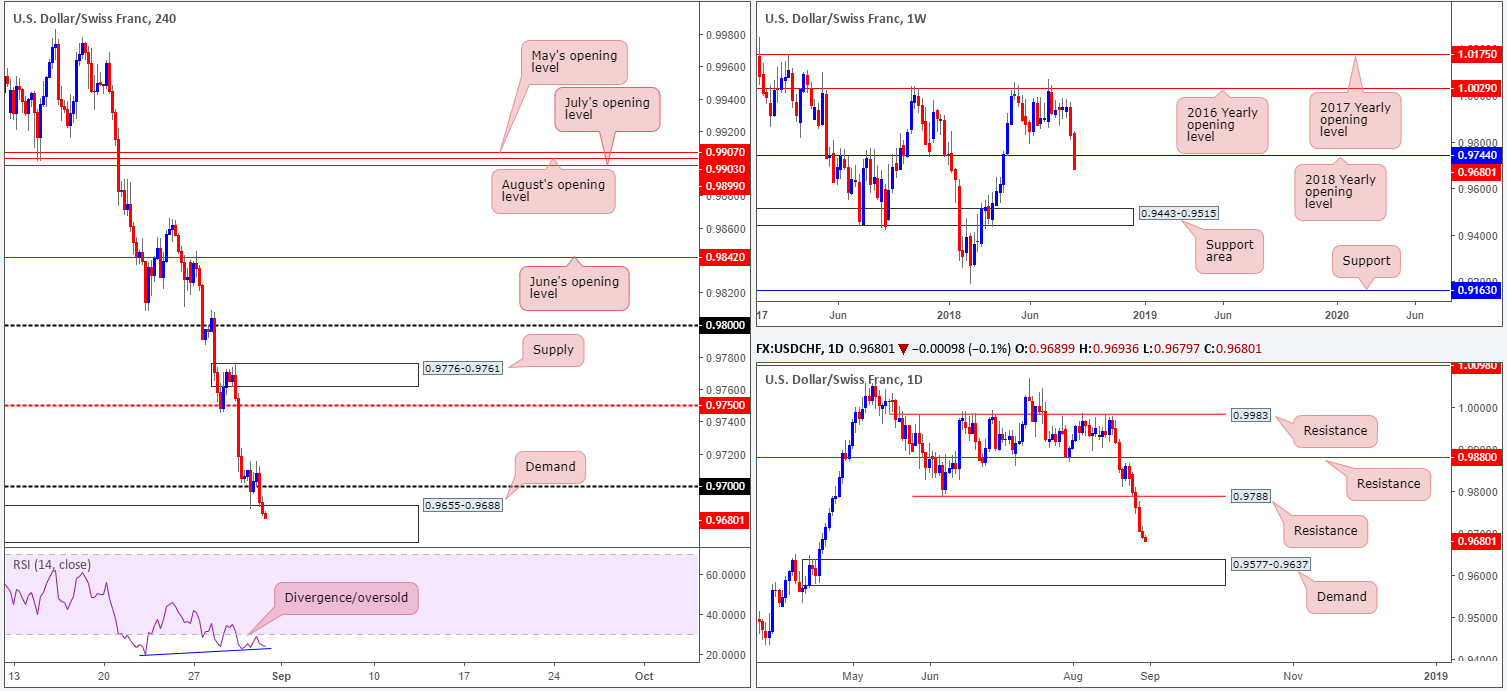
For the first time since April, the USD/CHF edged below the 0.97 handle on Thursday. H4 demand at 0.9655-0.9688, as you can see, though, was almost immediately brought into the mix. Also worth noting on this scale is the H4 RSI indicator displaying divergence out of oversold territory.
The current H4 demand, according to the higher-timeframe landscape, will likely struggle to generate much buying. Weekly price recently engulfed the 2018 yearly opening level at 0.9744 in strong fashion. A decisive close beneath this area will likely indicate this market could be in for more selling in the near future, targeting as far south as the weekly support area coming in at 0.9443-0.9515. Meanwhile, on the daily timeframe, limited support is observed until we reach demand penciled in at 0.9577-0.9637.
Areas of consideration:
From a technical standpoint, both weekly and daily timeframes suggest selling may be the path to take. With that being the case, shorts around the underside of 0.97, targeting the top edge of daily demand at 0.9637, could be something to watch for today. Yes, we know price remains within H4 demand at the moment, though with overhead pressure potentially coming in from the higher timeframes, this area is likely to break in the near future.
Today’s data points: Chicago PMI.
Dow Jones Industrial Average:
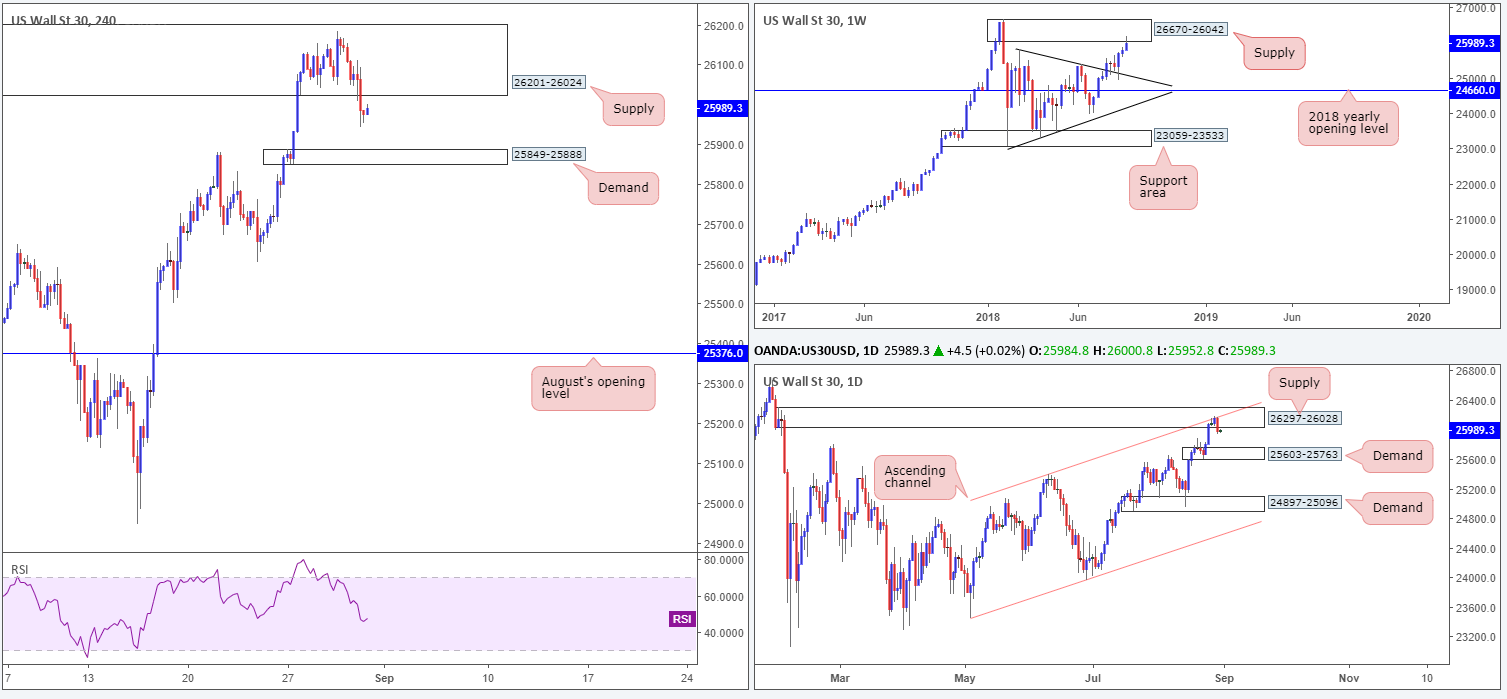
Snapping a four day-bullish phase, US equities traded defensively on Thursday as focus shifted back to US-China trade.
H4 supply at 26201-26024, although price tested the upper limits of this area, appears in good shape at the moment. For those who read Wednesday’s briefing you may recall the team highlighted this zone as a possible sell zone should a full or near-full-bodied H4 bear candle emerge. Well done to those who took advantage of this move!
Supporting the current H4 supply zone are two higher-timeframe supply zones. Weekly price recently engaged with the lower edge of a supply at 26670-26042, following a strong retest off a trend line resistance-turned support (etched from the high 25807). In terms of daily supply seen at 26297-26028, not only does this zone intersect with a daily channel resistance (taken from the high 25399), it is also glued to the underside of the aforesaid weekly supply area.
Areas of consideration:
As of current price, the next downside target on the H4 scale comes in around demand drawn from 25849-25888, while daily action has its eye on the demand coming in a little lower at 25603-25763. For folks who are short the current H4 supply, these areas could be considered worthy take-profit zones.
Today’s data points: Chicago PMI.
XAU/USD (Gold)
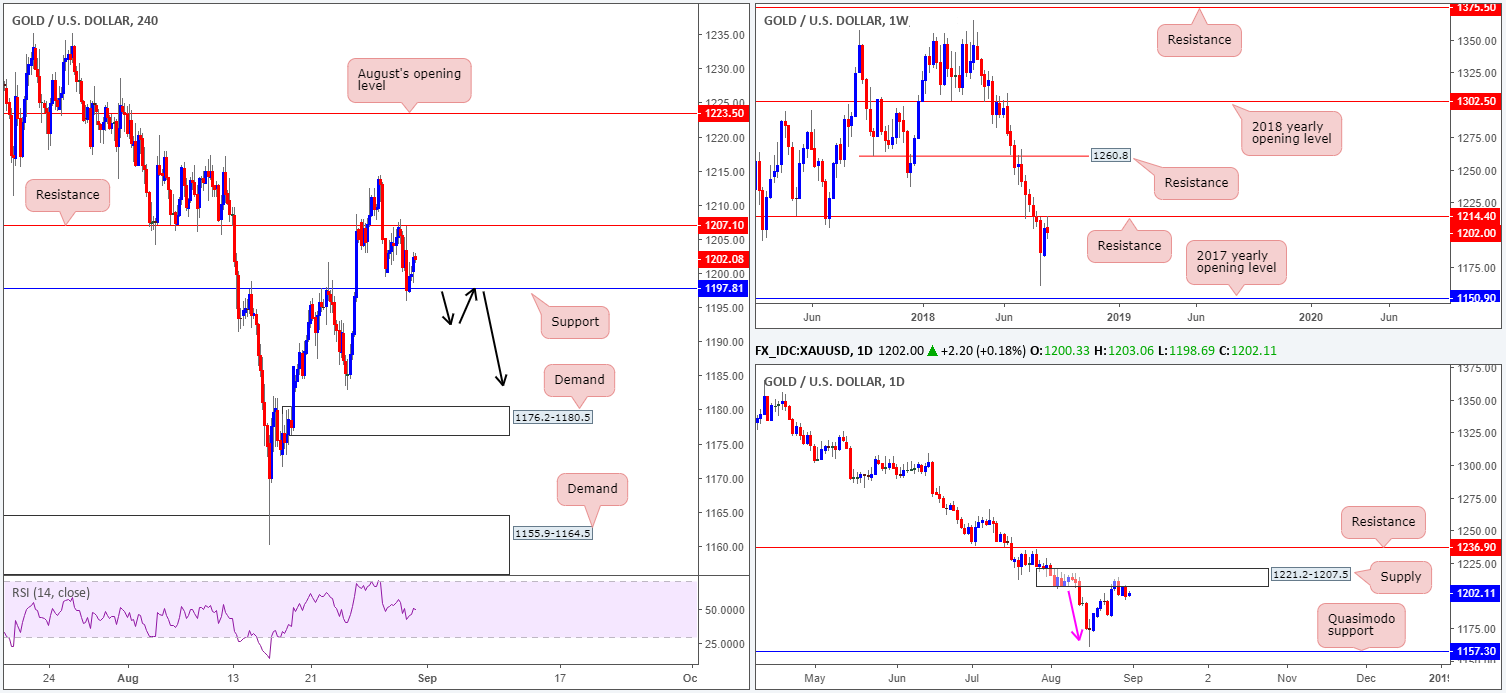
Having seen the USD print a modest recovery during Thursday’s movement, it should come as little surprise to note the price of gold declined. After firmly testing H4 resistance at 1207.1, bullion pressed for lower levels and eventually crossed swords with nearby H4 support at 1197.8, which, as you can see, remains on the defensive. How long this level will remain in play is difficult to judge. One thing we do know, however, is the higher-timeframes suggest lower prices could be in store.
Weekly action recently retested the underside of resistance at 1214.4 and sold off nicely. On this timeframe, the current candlestick is portraying a reasonably nice-looking bearish pin-bar formation. Couple this with daily price trading from supply at 1221.2-1207.5, we have ourselves some strong sellers in the mix we believe.
Areas of consideration:
To prove there are willing sellers in this market, traders are urged to consider waiting and seeing if H4 price can engulf the current H4 support. A close beneath this number, followed up with a retest in the shape of a full or near-full-bodied H4 bear candle would, technically speaking, likely be sufficient enough to consider shorts (black arrows), targeting August 24 low at 1182.9, followed closely by H4 demand at 1176.2-1180.5.
The use of the site is agreement that the site is for informational and educational purposes only and does not constitute advice in any form in the furtherance of any trade or trading decisions.
The accuracy, completeness and timeliness of the information contained on this site cannot be guaranteed. IC Markets does not warranty, guarantee or make any representations, or assume any liability with regard to financial results based on the use of the information in the site.
News, views, opinions, recommendations and other information obtained from sources outside of www.icmarkets.com.au, used in this site are believed to be reliable, but we cannot guarantee their accuracy or completeness. All such information is subject to change at any time without notice. IC Markets assumes no responsibility for the content of any linked site. The fact that such links may exist does not indicate approval or endorsement of any material contained on any linked site.
IC Markets is not liable for any harm caused by the transmission, through accessing the services or information on this site, of a computer virus, or other computer code or programming device that might be used to access, delete, damage, disable, disrupt or otherwise impede in any manner, the operation of the site or of any user’s software, hardware, data or property.


