EUR/USD:
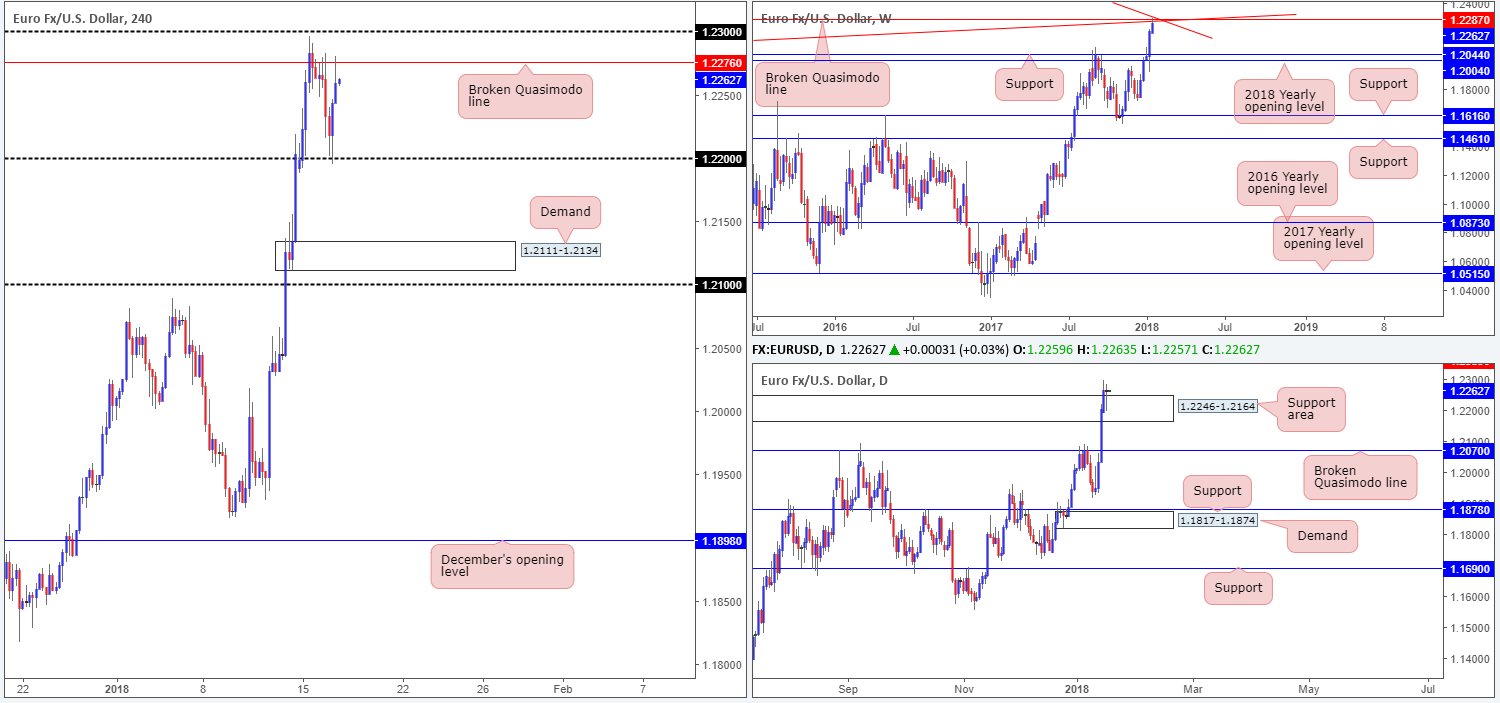
Going into the early hours of London on Tuesday, the euro fell sharply from the underside of a H4 broken Quasimodo line at 1.2276. In spite of this, US traders put a firm stop to this selling once their doors opened for business, posting a firm recovery back up to highs of 1.2280.
Longer term, the EUR/USD is seen trading around the underside of a weekly broken Quasimodo line at 1.2287, which happens to converge with two weekly trendline resistances (1.1641/1.6038). Down on the daily timeframe, supply at 1.2246-1.2164 was consumed on Monday and held firm as a support area on Tuesday. From a technical standpoint, this has potentially opened up the path north to a daily broken Quasimodo line at 1.2359 (not seen on the screen).
Market direction:
Seeing as how H4 price remains in an offered position beneath the H4 broken Quasimodo line, and weekly price is seen linking arms with three major resistances, we feel that further downside is still a strong possibility today/this week. The only grumble we have is the current daily support area!
For those that are considering shorts in this market, we would, given the support 1.22 offered yesterday, now require a break of the 1.22 handle in order to confirm seller intent. Beyond here, we have the H4 demand at 1.2111-1.2134 in sight, shadowed closely by the 1.21 handle.
Data points to consider: EUR final CPI y/y at 10am; US industrial production m/m and capacity utilization rate at 2.15pm; FOMC member Mester speaks at 9.30pm GMT.
Areas worthy of attention:
Supports: 1.22 handle; 1.2111-1.2134; 1.21 handle; 1.2246-1.2164.
Resistances: 1.2287; weekly trendline resistances; 1.2359; 1.23 handle; 1.2276.
GBP/USD:
Economic data from the UK on Tuesday showed that CPI came in line with market expectations on a yearly basis, while core-CPI, also on a yearly basis, came in marginally lower than consensus at 2.5%.
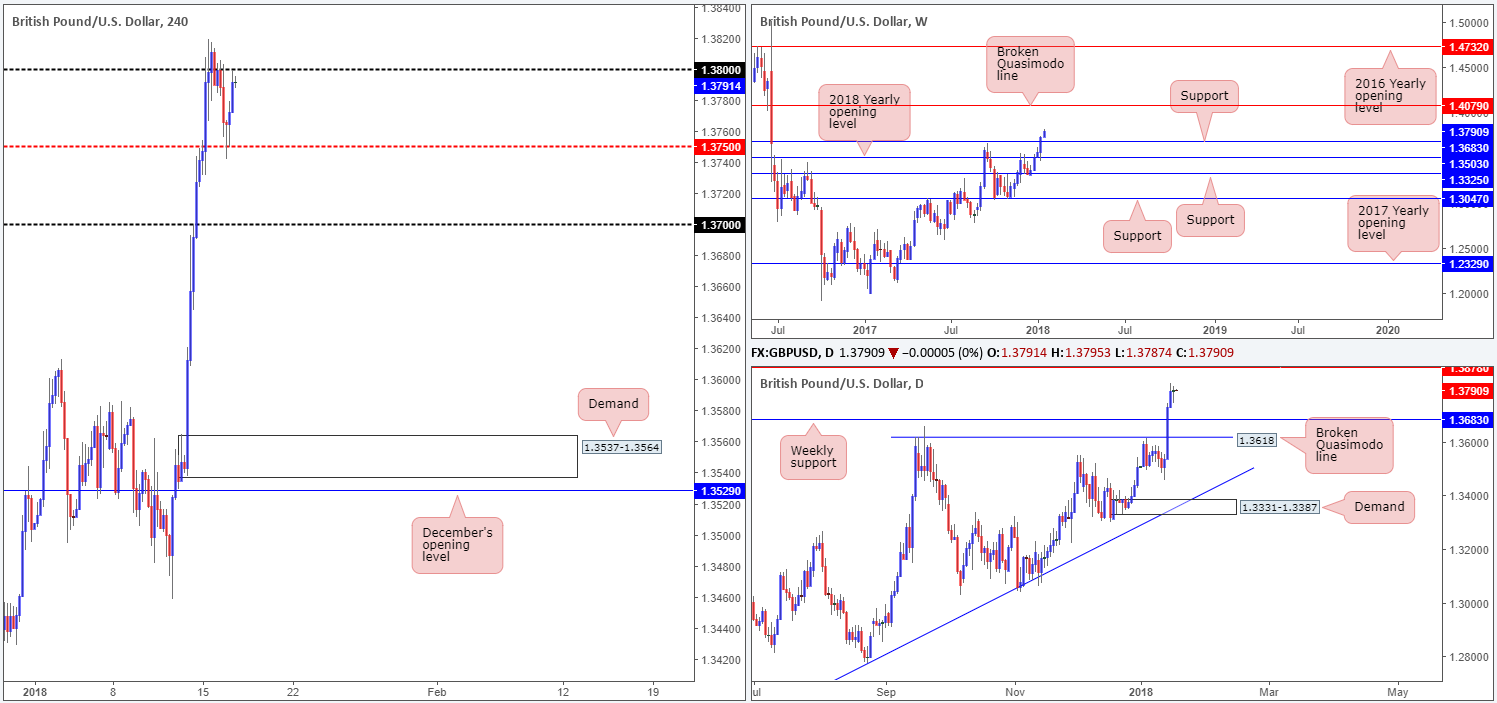
Along similar lines to the EUR/USD, the British pound dropped lower in early London hours and reached the H4 mid-level support base 1.3750, before turning higher into the US session and eroding all of the day’s losses.
While the H4 candles remain lurking below the 1.38 handle, higher-timeframe structure indicates further upside could be a possibility. Weekly price managed to overcome a major weekly resistance level at 1.3683 (now acting support) during last week’s trading. In consequence to this, the runway north appears relatively free for the bulls to stretch their legs and approach the 1.40s, specifically a weekly broken Quasimodo line at 1.4079. On the daily timeframe, the break of the aforementioned weekly resistance placed a daily Quasimodo line in the firing range at 1.3878 (not seen on the screen).
Market direction:
Technically speaking, it is possible that 1.38 may be taken out today. For that reason, a decisive H4 close above this number, followed up with a strong retest could be a sign that buyers are making another play to push higher. Upside targets for any longs above 1.38 would be set at the H4 mid-level resistance 1.3850 (not seen on the screen), followed by the aforementioned daily Quasimodo resistance.
Data points to consider: MPC member Saunders speaks at 11.45am; US industrial production m/m and capacity utilization rate at 2.15pm; FOMC member Mester speaks at 9.30pm GMT.
Areas worthy of attention:
Supports: 1.37 handle; 1.3750; 1.3683.
Resistances: 1.38 handle; 1.4079; 1.3878.
AUD/USD:
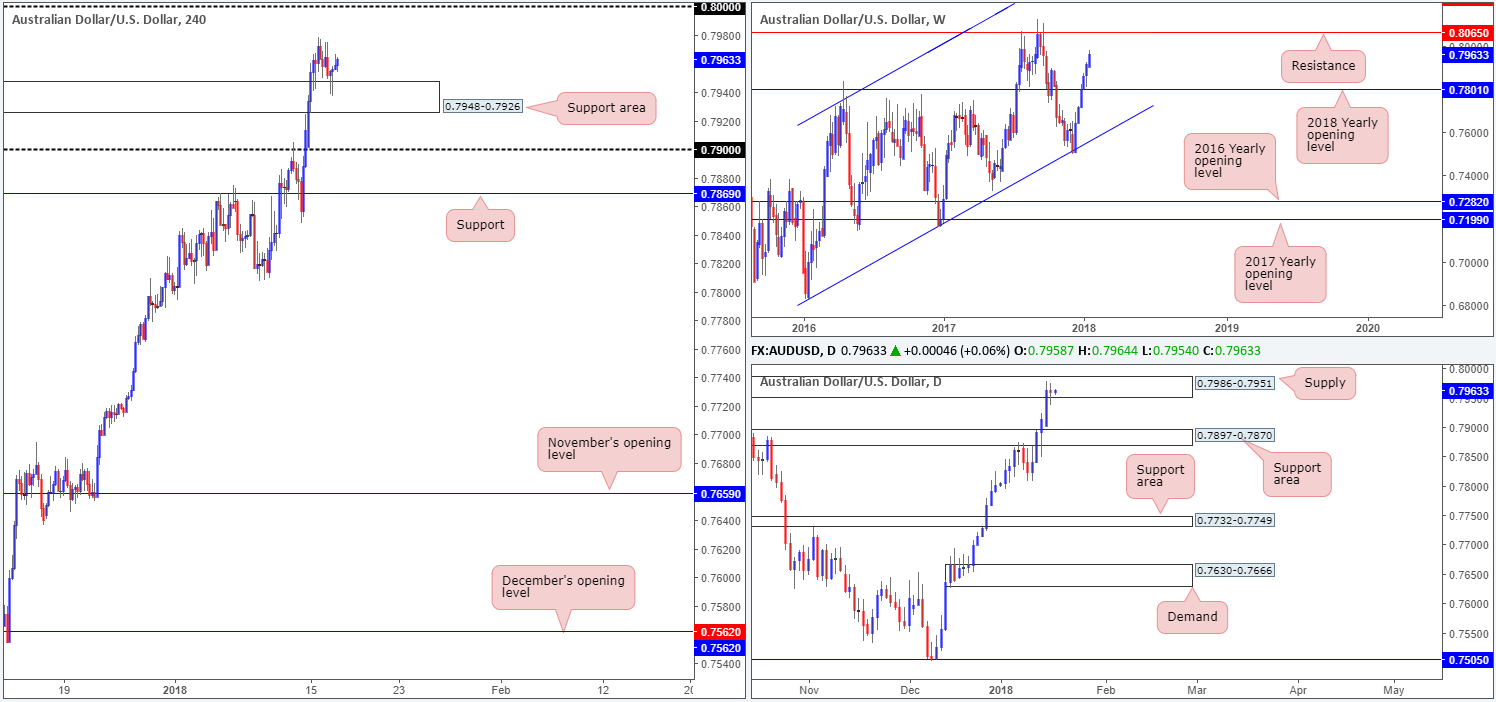
After topping at highs of 0.7978 on Monday, the commodity-linked currency dropped lower during Tuesday’s segment and retested a H4 support area plotted at 0.7948-0.7926. Two back-to-back H4 buying tails were seen printed from within this zone amid London/US trading yesterday, indicating a possible move up to the large psychological band 0.80.
On the bigger picture, one can see that the currency has been on a tear since shaking hands with a weekly channel support extended from the low 0.6827 five weeks ago. Further buying is likely to place the unit within striking distance of weekly resistance penciled in at 0.8065. This level boasts a robust history so expect active sellers to make an appearance here! Turning our attention to the daily timeframe, supply at 0.7986-0.7951 held firm on Tuesday, chalking up a clear-cut indecision candle. A break of this area would, in our opinion, unlock the door for weekly price to challenge the noted resistance.
Market direction:
Buying this market, although promising on the weekly and H4 charts, is still not something we’d label high probability due to the aforementioned daily supply.
Selling, on the other hand, remains attractive from 0.80. Assuming the number is tested, the break of the noted daily supply would likely activate stops. These stops, once filled, become buy orders. Buy orders are what’s required in order to sell. Therefore, there is a good chance that players with big pockets may be looking to take advantage of this liquidity pocket.
This setup may not trigger today, but is certainly one to keep on the watchlist, we believe.
Data points to consider: US industrial production m/m and capacity utilization rate at 2.15pm; FOMC member Mester speaks at 9.30pm GMT.
Areas worthy of attention:
Supports: 0.7948-0.7926.
Resistances: 0.80 handle; 0.8065; 0.7986-0.7951.
USD/JPY:
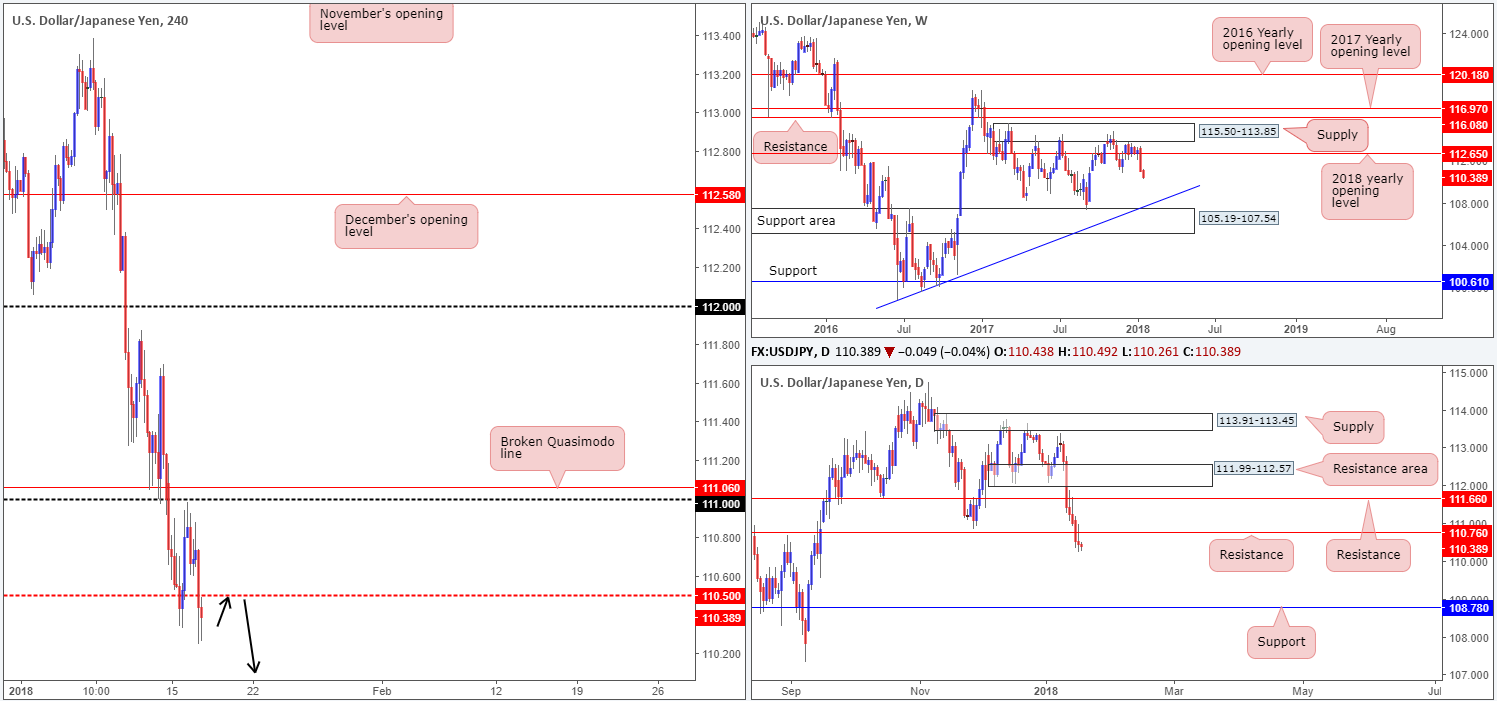
Using a top-down approach this morning, we can see that continued selling of the dollar against the yen may eventually see the weekly candles cross swords with a weekly support area at 105.19-107.54, and a converging weekly trendline taken from the low 98.78.
The daily timeframe further highlights the possibility of additional downside in this market, following a recent break/retest of daily support at 110.76. In the event that the bears remain in control, we could see price challenge daily support plotted at 108.78.
Looking across to the H4 candles, the pair topped a few pips ahead of the 111 handle on Tuesday after an earnest run higher from the 110.50 neighborhood. In recent hours, however, this number was engulfed and fresh lows of 110.24 were printed.
Market direction:
There’s a clear bearish tone present in this market right now. To try and take advantage of that, a short on any retest seen at the underside of 110.50 could be something to consider. For conservative traders, waiting for a full or near-full-bodied bearish H4 candle to form following the retest is also an option.
The next area of interest beneath 110.50 can be seen at the 110 handle (not seen on the screen). This is an ideal place to maybe lock in partial profits and reduce risk. The ultimate targets, though, are the higher-timeframe supports mentioned above!
Data points to consider: US industrial production m/m and capacity utilization rate at 2.15pm; FOMC member Mester speaks at 9.30pm GMT.
Areas worthy of attention:
Supports: 105.19-107.54; Weekly trendline support; 108.78; 110 handle.
Resistances: 110.76; 111 handle; 110.50.
USD/CAD:
The USD/CAD market remained somewhat stable on Tuesday, carving out a range between the H4 mid-level resistance at 1.2450 and the 1.24 handle.
Directly beneath this range is a daily 61.8% Fib support level at 1.2390. This is certainly not a level to overlook given how it rebounded price two weeks ago. Also note the daily indecision candle printed just ahead of this level yesterday.
According to the weekly timeframe, there’s space for the unit to trade as far south as a weekly demand at 1.1919-1.2074, after a solid retest was seen from the underside of the 2018 yearly opening level at 1.2579. Whether this selling is sustainable over the coming weeks, however, is difficult to judge.
Market direction:
Thanks to a somewhat quiet session yesterday, much of the following will echo thoughts put forward in Tuesday’s report.
In spite of weekly price suggesting further downside, the 1.24 handle on the H4 timeframe and aforementioned daily 61.8% Fib support will likely be tough nut to crack. Does this mean a buy could be in order? Not necessarily. A long would also place one in direct conflict with the 1.2450 number on the H4 timeframe, and against potential weekly flow.
As such, to our way of seeing things, neither a long nor short seems attractive at this time.
Data points to consider: US industrial production m/m and capacity utilization rate at 2.15pm; FOMC member Mester speaks at 9.30pm; BoC monetary policy report, BoC rate statement and overnight rate at 3pm; BoC press conference at 4.15pm GMT.

Areas worthy of attention:
Supports: 1.24 handle; 1.2390; 1.1919-1.2074.
Resistances: 1.2450; 1.25 handle.
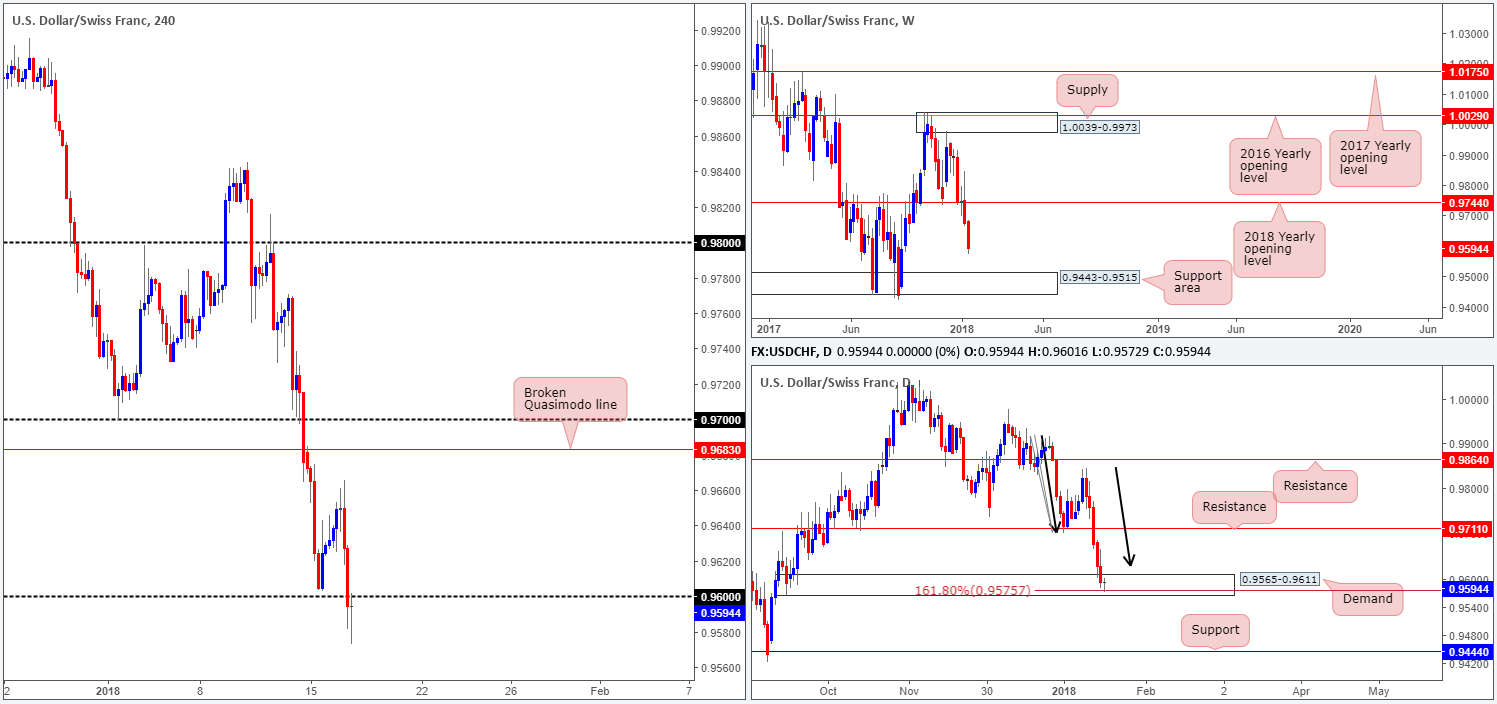
USD/CHF:
After failing to reach the H4 broken Quasimodo line at 0.9683 on Tuesday, the pair turned south and eventually thundered its way through the 0.96 handle seen on the H4 timeframe.
While the break of 0.96 has likely attracted a truckload of breakout sellers, one should exercise caution! Daily action shows price is currently reacting from a daily AB=CD (see black arrows) 161.8% Fib ext. point at 0.9575 seen within the lower limits of a daily demand base coming in at 0.9565-0.9611. The flip side to this, of course, is that weekly price shows little support in the market until we reach a weekly support area located around the 0.9443-0.9515 neighborhood.
Market direction:
While further selling could be a possibility, one has to be prepared for a potential relief rally back up to daily resistance at 0.9711. Personally, we feel there are just too many opposing structures to trade this market with confidence right now. Therefore, opting to stand on the sidelines may be the better path to take.
Data points to consider: US industrial production m/m and capacity utilization rate at 2.15pm; FOMC member Mester speaks at 9.30pm GMT.
Areas worthy of attention:
Supports: 0.9443-0.9515; 0.9565-0.9611; 0.9575.
Resistances: 0.96 handle; 0.9683; 0.9711.
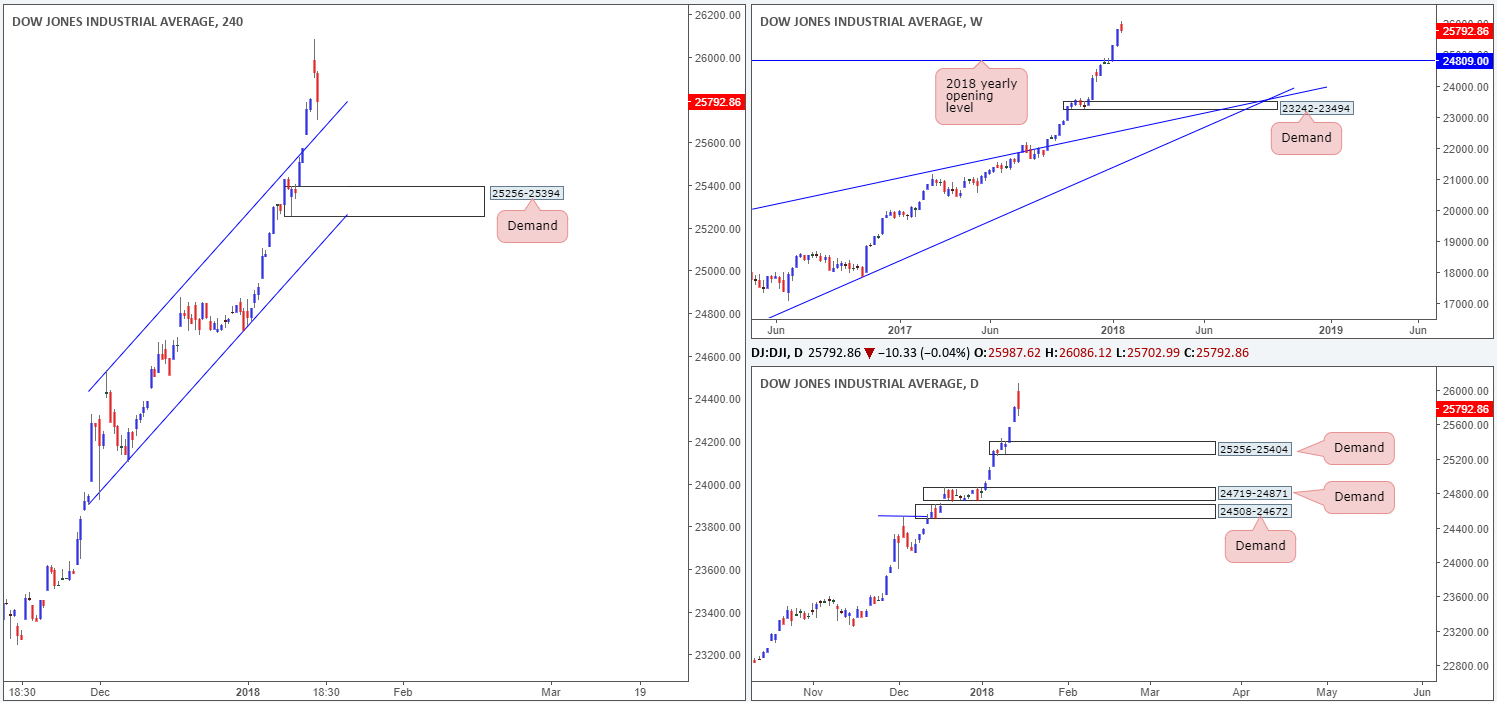
DOW 30:
US equities began Tuesday on a strong footing, extending gains to a record high of 26086. The move higher, however, was a short-lived one, as sentiment turned sour and forced the index to lows of 25702, ending the day down 0.04%.
Continued selling may lead to H4 price challenging the H4 channel resistance-turned support extended from the high 24534. A violation of this line, however, would likely clear the river south down to at least the H4 demand base sitting at 25256-25394. Also of particular interest is that this H4 demand is located within the lower limits of daily demand registered at 25256-25404.
Market direction:
As far as we see things, there are a few levels in the offing right now:
- Look to trade any retest seen off of the recently broken H4 channel resistance-turned support.
- Failing that, look for price to dip lower and test the H4 demand at 25256-25394. As this area is housed within the lower limits of the aforementioned daily demand, the odds of price responding from this zone are high, in our view.
Data points to consider: US industrial production m/m and capacity utilization rate at 2.15pm; FOMC member Mester speaks at 9.30pm GMT.
Areas worthy of attention:
Supports: H4 channel support; 25256-25394; 25256-25404.
Resistances: …
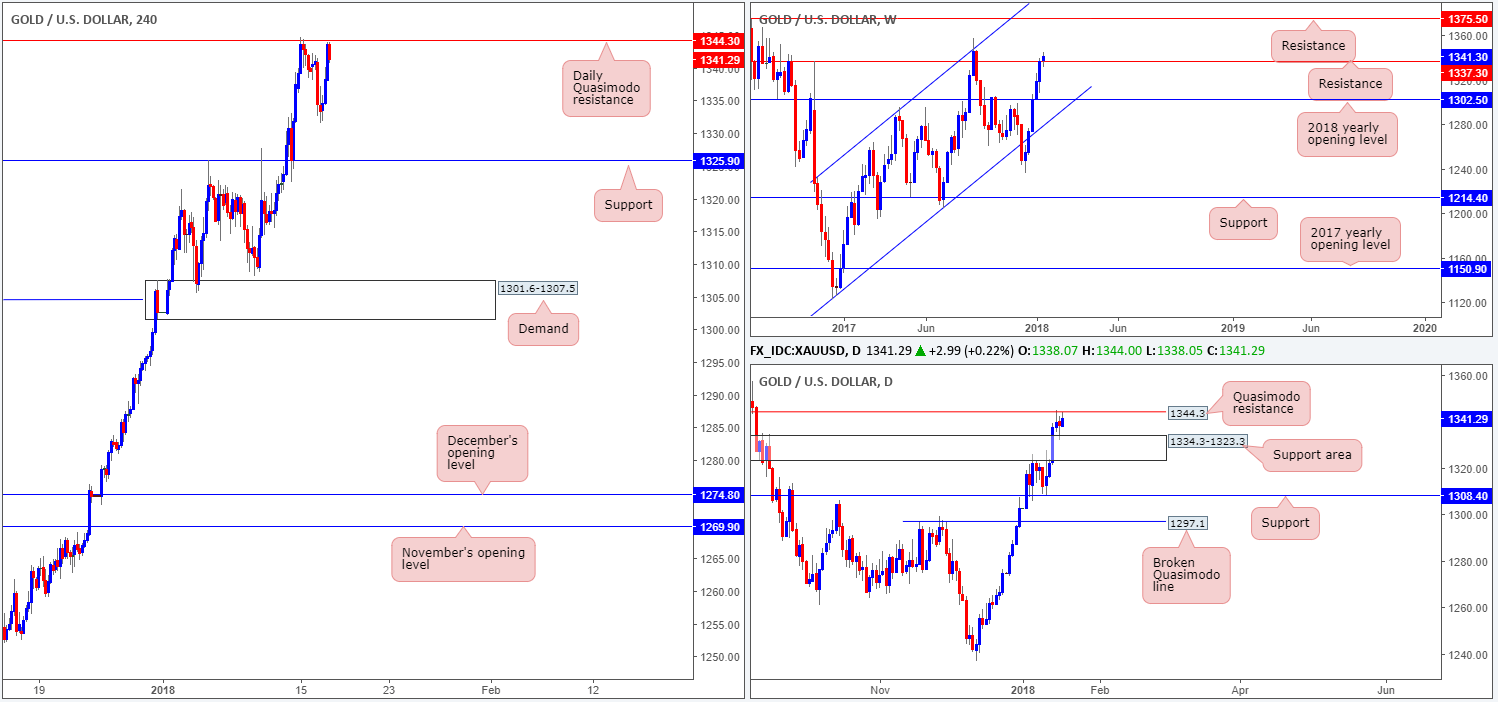
GOLD:
Downside pressure on the US dollar forced the yellow metal higher on Tuesday. The latest move, as you can see, has brought gold’s H4 price into striking range of a daily Quasimodo resistance level plotted at 1344.3. A concern for sellers here is the fact that a daily support area lurks just below at 1334.3-1323.3, and also that weekly price is seen probing beyond a weekly resistance level located at 1337.3.
Market direction:
Taking into account the above points and the fact the US dollar has been under pressure of late, selling this market has become a chancy trade, in our humble view.
In regard to buying, we would want to see a strong H4 close print above the current daily Quasimodo resistance, clearing out any residual sellers. A retest of this level, followed up with a full or near-full-bodied H4 bull candle would, technically speaking, be enough to warrant further upside to as far north as weekly resistance at 1375.5.
Areas worthy of attention:
Supports: 1334.3-1323.3.
Resistances: 1337.3; 1375.5; 1344.3.
This site has been designed for informational and educational purposes only and does not constitute an offer to sell nor a solicitation of an offer to buy any products which may be referenced upon the site. The services and information provided through this site are for personal, non-commercial, educational use and display. IC Markets does not provide personal trading advice through this site and does not represent that the products or services discussed are suitable for any trader. Traders are advised not to rely on any information contained in the site in the process of making a fully informed decision.
This site may include market analysis. All ideas, opinions, and/or forecasts, expressed or implied herein, information, charts or examples contained in the lessons, are for informational and educational purposes only and should not be construed as a recommendation to invest, trade, and/or speculate in the markets. Any trades, and/or speculations made in light of the ideas, opinions, and/or forecasts, expressed or implied herein, are committed at your own risk, financial or otherwise.
The use of the site is agreement that the site is for informational and educational purposes only and does not constitute advice in any form in the furtherance of any trade or trading decisions.
The accuracy, completeness and timeliness of the information contained on this site cannot be guaranteed. IC Markets does not warranty, guarantee or make any representations, or assume any liability with regard to financial results based on the use of the information in the site.
News, views, opinions, recommendations and other information obtained from sources outside of www.icmarkets.com.au, used in this site are believed to be reliable, but we cannot guarantee their accuracy or completeness. All such information is subject to change at any time without notice. IC Markets assumes no responsibility for the content of any linked site. The fact that such links may exist does not indicate approval or endorsement of any material contained on any linked site.
IC Markets is not liable for any harm caused by the transmission, through accessing the services or information on this site, of a computer virus, or other computer code or programming device that might be used to access, delete, damage, disable, disrupt or otherwise impede in any manner, the operation of the site or of any user’s software, hardware, data or property.


