A note on lower timeframe confirming price action…
Waiting for lower timeframe confirmation is our main tool to confirm strength within higher timeframe zones, and has really been the key to our trading success. It takes a little time to understand the subtle nuances, however, as each trade is never the same, but once you master the rhythm so to speak, you will be saved from countless unnecessary losing trades. The following is a list of what we look for:
- A break/retest of supply or demand dependent on which way you’re trading.
- A trendline break/retest.
- Buying/selling tails/wicks – essentially we look for a cluster of very obvious spikes off of lower timeframe support and resistance levels within the higher timeframe zone.
- Candlestick patterns. We tend to only stick with pin bars and engulfing bars as these have proven to be the most effective.
We search for lower timeframe confirmation between the M15 and H1 timeframes, since most of our higher-timeframe areas begin with the H4. Stops are usually placed 5-10 pips beyond confirming structures.
EUR/USD:
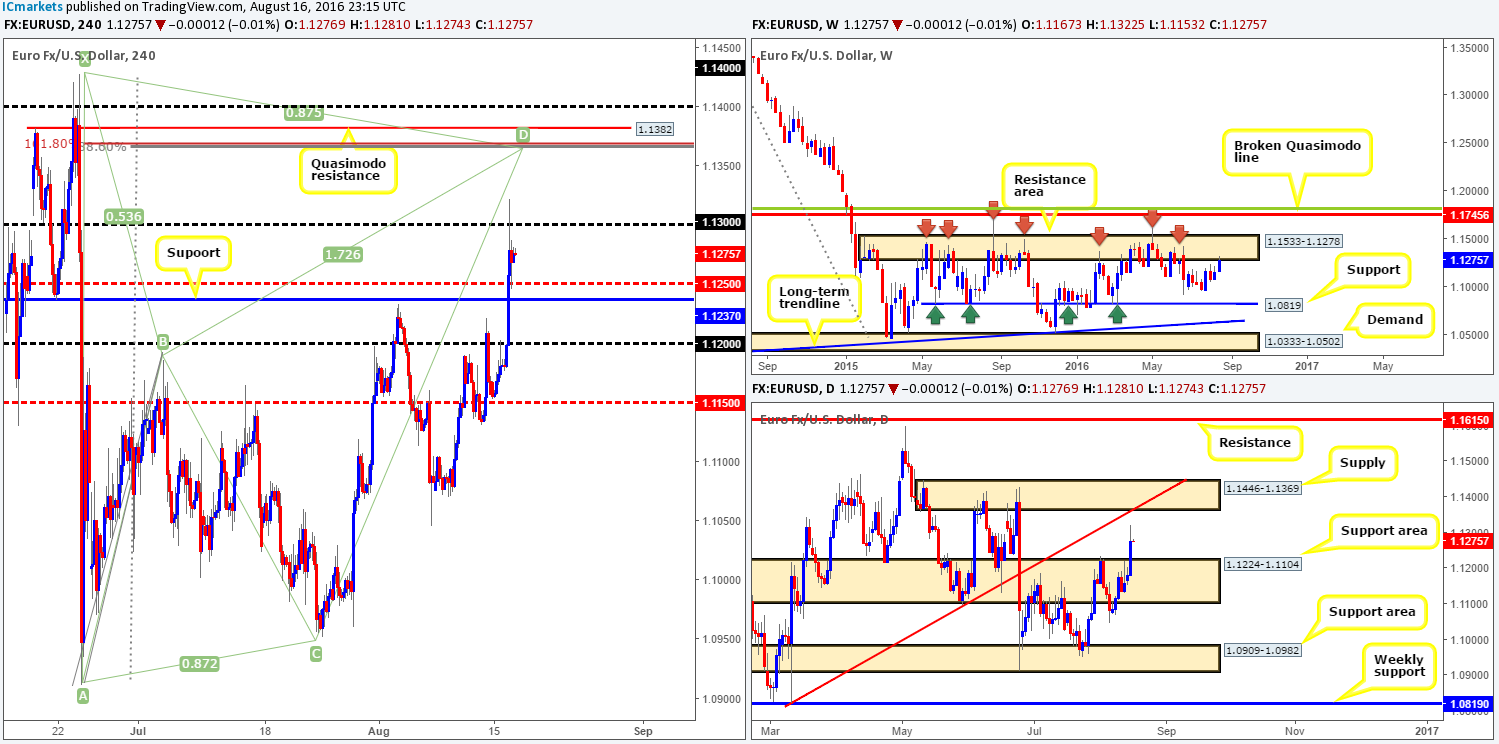
The EUR outperformed on Tuesday, reaching highs of 1.1322 by the day’s end. Broad US dollar weakness aided this recent move pushing the US dollar index to lows of 94.43. However, following a poor US CPI reading, the EUR rotated from session highs to touch base with the H4 mid-way support at 1.1250 going into the close. Now, given that price is effectively lodged between 1.13 and 1.1250 at the moment, where does our team stand in the bigger picture?
Over on the weekly chart, price recently connected with a major area of weekly resistance coming in at 1.1533-1.1278. This zone has managed to cap upside in this market since May 2015, so the sellers could make an appearance here! Looking down to the daily chart, nevertheless, there appears to be room for the pair to extend higher towards daily supply drawn from 1.1446-1.1369, which merges with a daily trendline resistance extended from the low 1.0821.
Our suggestions: Despite weekly action now kissing the underside of a weekly resistance area, we feel the unit may want to pop higher before rotating south. Ultimately, we have set a pending sell order at 1.1362, with a stop above the high 1.1427. Building a case for entry we have the following:
- H4 Quasimodo resistance at 1.1382.
- Nice-looking H4 harmonic bearish Bat pattern which shows completion around the 1.1367ish range (H4 88.6% Fib resistance/H4 161.8% Fib extension).
- Psychological resistance at 1.14.
- Daily supply area at 1.1446-1.1369 which encapsulates the H4 Quasimodo sell line.
- Daily trendline resistance which fuses beautifully with the H4 Quasimodo sell line.
- And finally let’s not forget that all of the above is housed within the aforementioned weekly resistance area!
Levels to watch/live orders:
- Buys: Flat (Stop loss: N/A).
- Sells: 1.1362 [Pending order] (Stop loss: 1.1432).
GBP/USD:
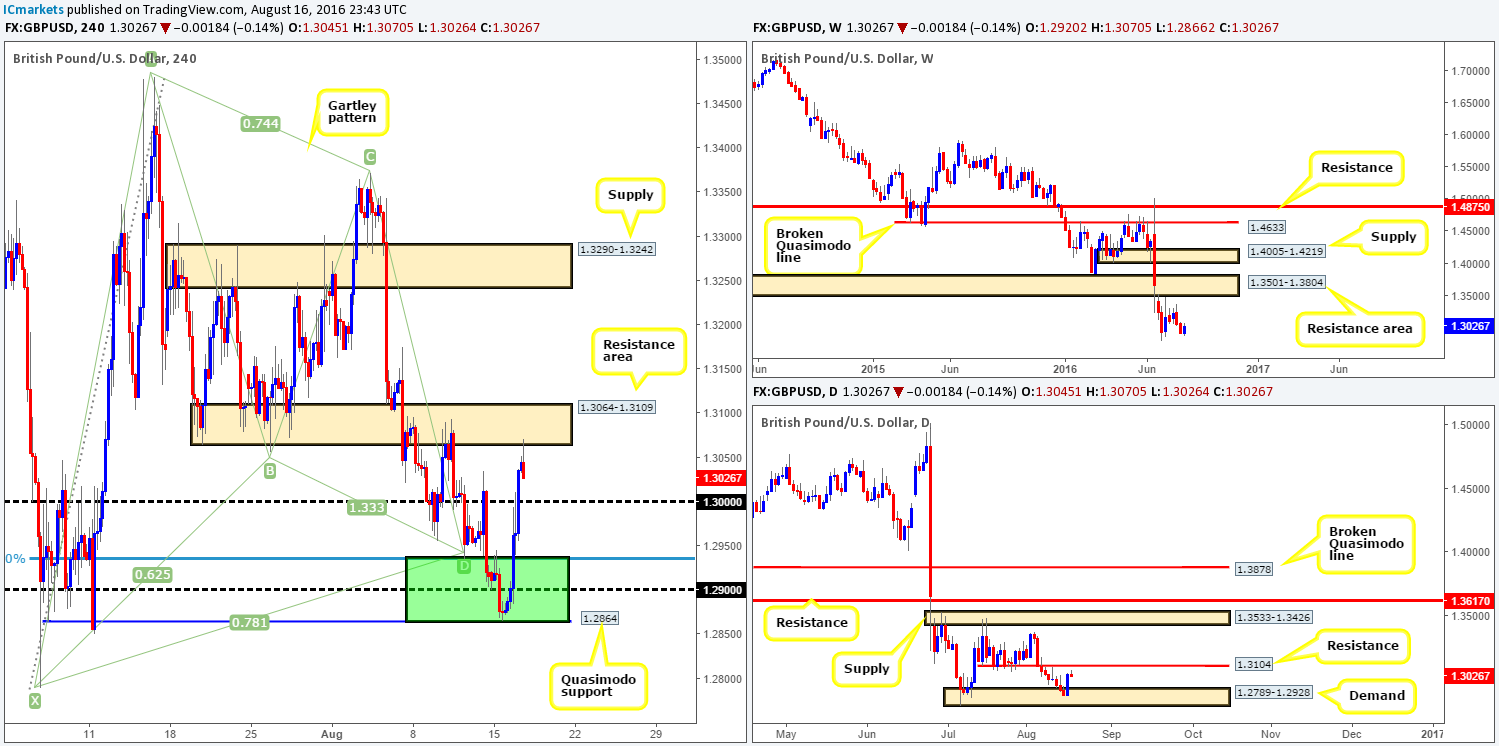
Similar to its bigger brother the EUR/USD, the GBP/USD also rallied on broad US dollar weakness yesterday along with a better than expected UK CPI print. For those who read our previous report on this pair you may recall our team felt a bounce higher from the 1.2864/1.29 (Quasimodo support/round number) region was likely on the cards, due to price residing within a daily demand at 1.2789-1.2928 which united with a larger H4 harmonic Gartley reversal zone fixed between 1.2864/1.2935 (green zone). In regards to entry, we mentioned to watch for a close above 1.29 followed by a retest. If you look down to the M30, you’ll see this played out perfectly. Well done to any of our readers who managed to net this move as price recently connected with the second and final take-profit target at 1.3064-1.3109: a H4 resistance area.
As we have mentioned in previous reports, we only expected a bounce from the above noted buy zone, and this is what we got. With that, what’s likely in store for this market today and possibly into the week?
Well, we’re expecting 1.30 to be retested today. This is a key number for us since a break below this level could prompt further selling down to the 1.29ish region and beyond, as let’s not forget that the weekly timeframe shows little support until around the 1.20 region (visit 1986). Therefore, the best approach, in our view, going into today’s sessions will be to watch how price responds to 1.30. A break below here followed by a retest and a lower timeframe sell signal (see the top of this report) is, in our opinion, enough to condone a short entry with a an initial target objective at 1.29.
Levels to watch/live orders:
- Buys: Flat (Stop loss: N/A).
- Sells: Watch for price to close below the 1.30 handle and look to trade any retest seen thereafter (lower timeframe confirmation required).
AUD/USD:
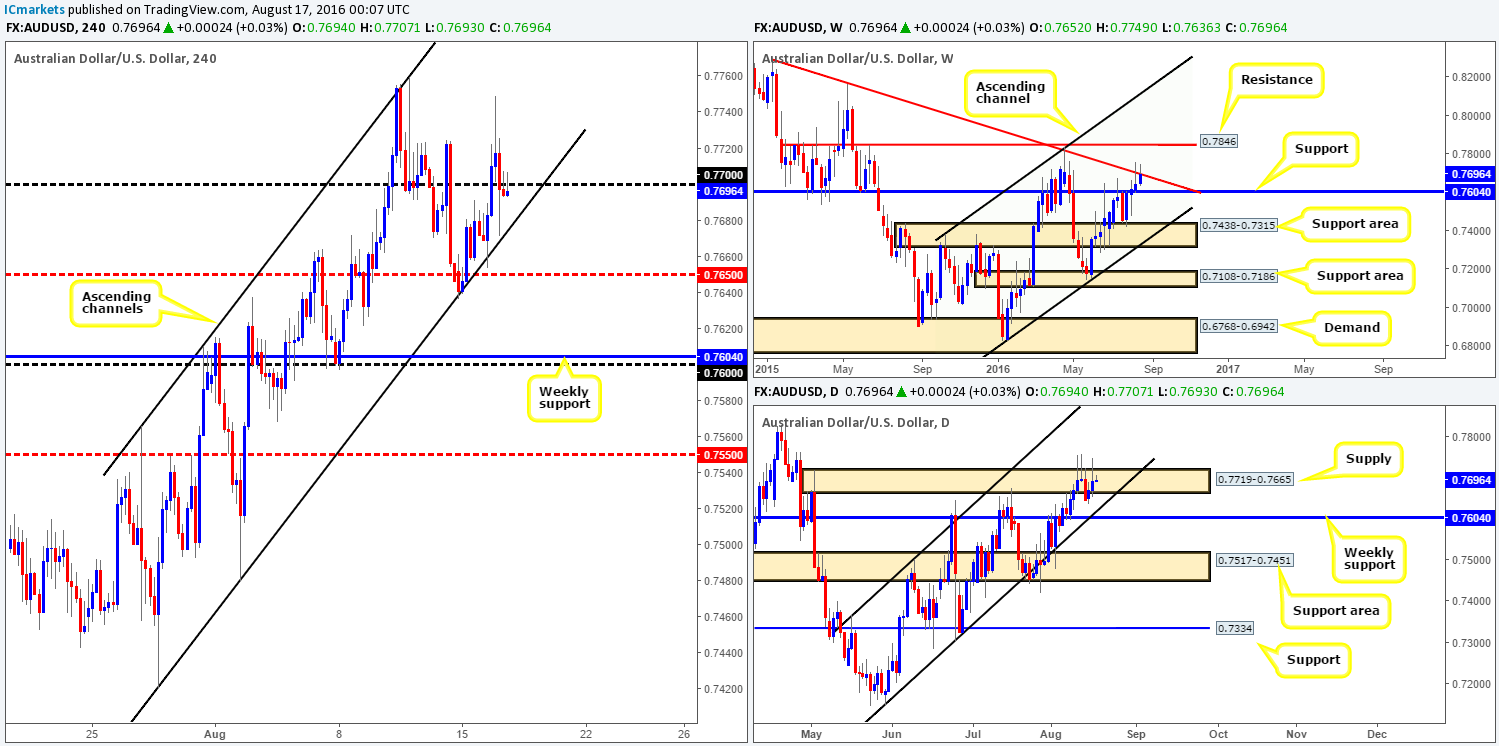
Boosted by a weak dollar, the commodity-linked currency punched to highs of 0.7749 yesterday. However, as the US opened their trading doors, the pair took a turn for the worse and aggressively plunged to lows of 0.7671 on the day. As we write, we can see that price remains confined within a H4 ascending channel (0.7420/0.7565), where the unit is currently finding resistance from around the underside of the 0.77 handle.
In that the weekly trendline resistance (extended from the high 0.8895) continues to hold this market lower, as well as daily supply at 0.7719-0.7665, it’s difficult for us to adopt a bullish approach right now.
Our suggestions: What we’re looking for today is a push lower from the 0.77 band and break below the current H4 channel support/H4 mid-way support 0.7650. A decisive push south would likely open the doors for price to challenge the 0.76 handle – essentially the weekly support at 0.7604 (the next downside target on the higher timeframes).To trade this possible intraday move, watch for price to retest the 0.7650 area following a close lower. Despite this trade being supported by higher-timeframe flows, we’d still recommend waiting for lower timeframe confirmation before pulling the trigger (see the top of this report), since fakeouts around psychological boundaries are common view.
Levels to watch/live orders:
- Buys: Flat (Stop loss: N/A).
- Sells: Watch for price to close below the H4 mid-way support 0.7650/H4 channel support (0.7420) and look to trade any retest seen thereafter (lower timeframe confirmation required).
USD/JPY:
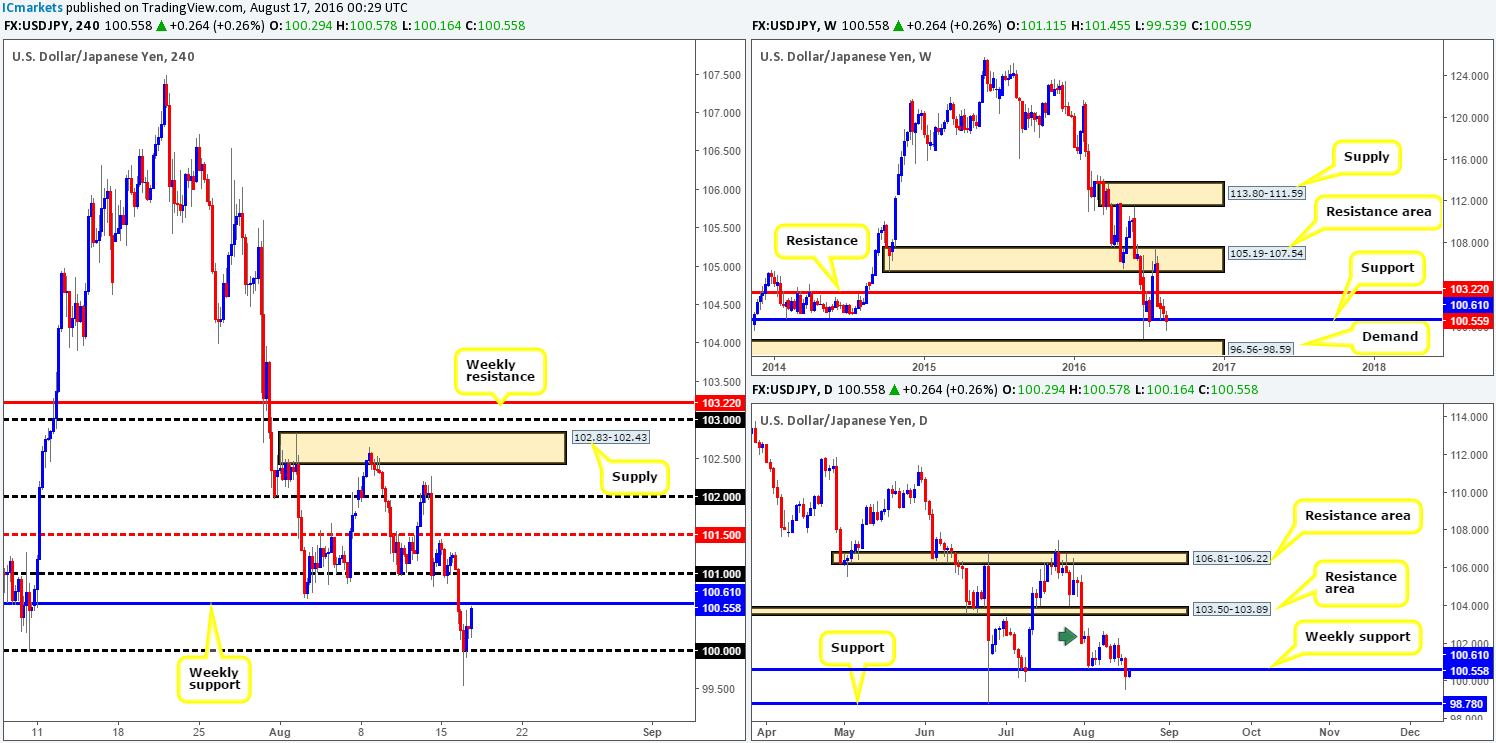
Coming in from the top this morning, weekly movement shows that price recently pushed below weekly support at 100.61. However, before we all scream ‘sell sell’, it may be worth waiting for the weekly candle to close shop before presuming that this support is consumed. Down on the daily chart, we can see that price is currently testing the underside of the above said weekly support. Should this line establish itself as resistance today, there’s a good chance that the pair may head lower to shake hands with daily support coming in at 98.78.
Over on the H4 chart, the H4 candles surpassed not only the aforementioned weekly support but also the key figure 100 (following the release of July’s US CPI figures). Despite this rather aggressive breach, 100 remains in a firm position.
Our suggestions: It is a tricky market to trade at the moment. On the one hand, a short from the underside of the current weekly support could work out nicely. Nevertheless, there’s always a chance that the push lower on the weekly chart is simply a fakeout below the weekly support. Therefore, given this uncertainty, opting to stand on the sidelines here today might be the best path to take.
Levels to watch/live orders:
- Buys: Flat (Stop loss: N/A).
- Sells: Flat (Stop loss: N/A).
USD/CAD:
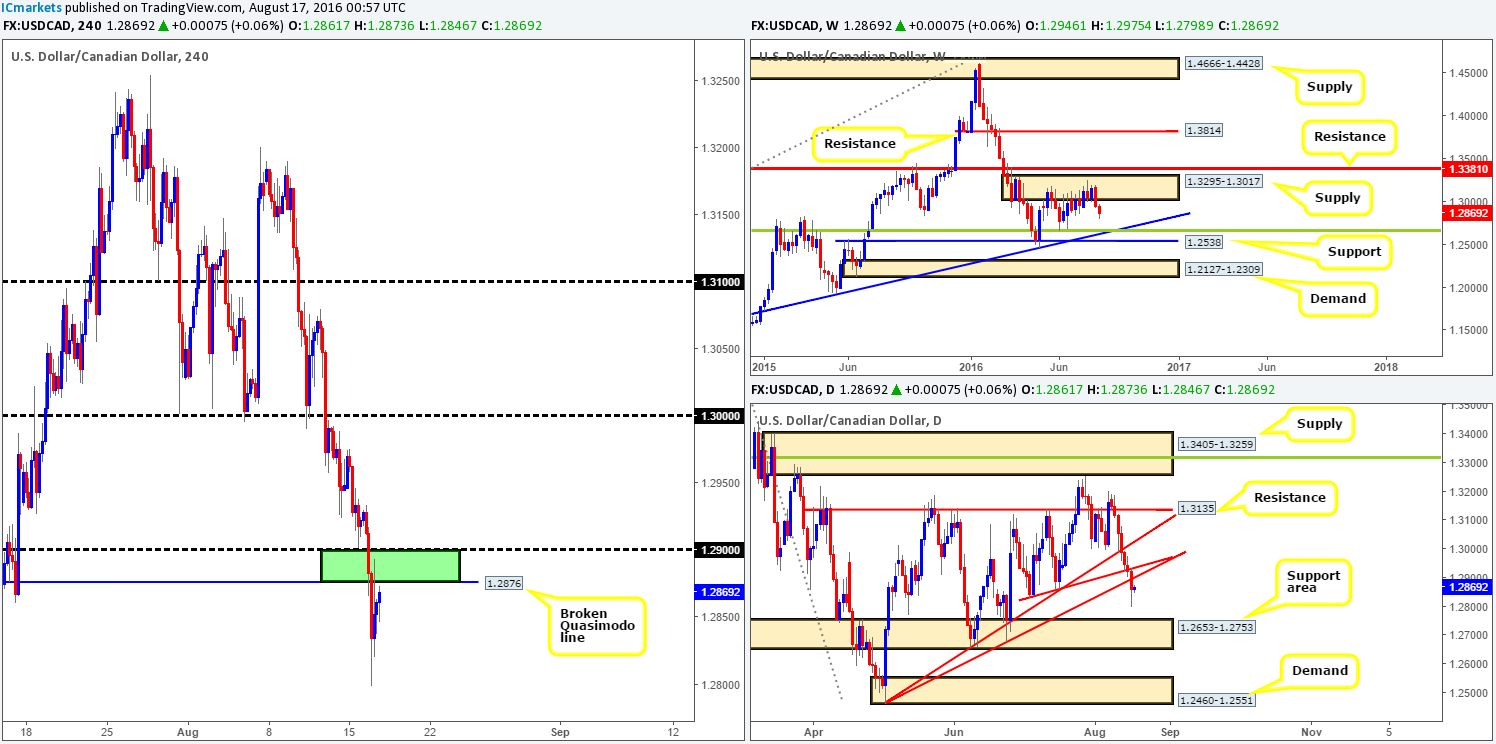
Weighed on heavily by a weaker dollar yesterday, the pair spiraled south, taking out the 1.29 handle as well as a H4 Quasimodo support level at 1.2876. Overnight in the US session, however, price rotated from the 1.28 barrier and, as you can see, reclaimed some of the day’s losses.
Technically speaking, the recent selling should not really come as much of a surprise. Since last week, price has been selling off from weekly supply coming in at 1.3295-1.3017. What’s more, there is space seen on this timeframe for the market to continue driving lower down to a weekly trendline support extended from the high 1.1278 (intersects beautifully with a weekly Fib support line at 1.2649). What yesterday’s selling also accomplished was a close below the daily trendline support extended from the low 1.2460, potentially opening up the path south for a touch of the daily support area drawn from 1.2653-1.2753.
Our suggestions: Watch for confirmed (see the top of this report) short trades between 1.29 and the H4 broken Quasimodo line at 1.2876 today (lower timeframe confirmation is required simply to avoid any fakeout seen through 1.29). This area beautifully intersects with the recently broken daily trendline support. Furthermore, with H4 support seen around the 45.97ish range on oil and the fact that weekly price suggests further selling might be in order (see above); our team believes 1.29/1.2876 is certainly a valid sell zone.
Levels to watch/live orders
- Buys: Flat (Stop loss: N/A).
- Sells: 1.2876/1.29 region [Tentative – confirmation required] (Stop loss: dependent on where one confirms this area).
USD/CHF:
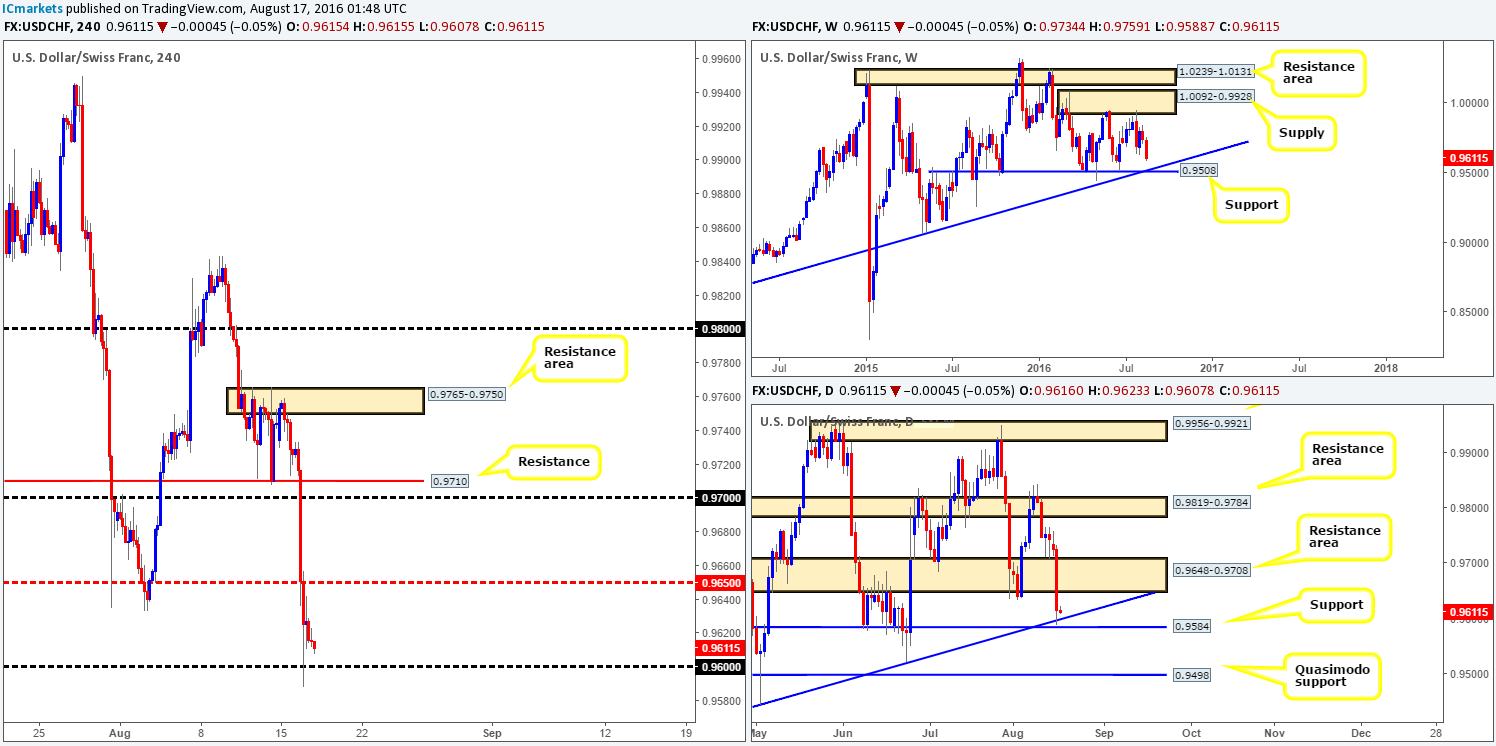
Kicking off with a look at the weekly chart this morning shows us that price is now trading within touching distance of a weekly support level at 0.9508 (merges with a weekly trendline support extended from the low 0.8703). This level is certainly not one to be ignored given its history! However, before the Swissy comes to grips with above levels, daily price has to take out both the daily trendline support extended from the low 0.9443 and also the daily support line at 0.9584.
Stepping across to the H4 chart, yesterday’s sell off chomped through several H4 technical supports and only really began to slow down upon connecting with the 0.96 handle. Technically, there is a good chance of a bounce from the 0.96 region today given its connection with the daily support at 0.9584 (see above). However, we’d only be looking for an intraday bounce back up to the H4 mid-way resistance 0.9650, as this represents the underside of the daily resistance area at 0.9648-0.9708.
The real attraction for this pair, however, is seen around the 0.95 range! Not only does this number boast a daily Quasimodo support at 0.9498 but there is also the weekly support mentioned above at 0.9508 (coupled with weekly trendline support [0.8703]).
Our suggestions: Watch for an intraday bounce from 0.96 today. In view of weekly price (see above), we’d recommend waiting for lower timeframe confirmation to prove buying interest resides here before pulling the trigger (see the top of this report), keeping a single target of 0.9650.
In regard to buying from 0.95, our team is confident enough to place a pending buy order here with stops set below the daily Quasimodo apex low at 0.9440. However, since we’re already looking to sell the EUR, buying this pair is similar to doubling up on risk, so we may pass on this one in favor of the EUR short trade.
Levels to watch/live orders:
- Buys: 0.96 region [Tentative – confirmation required] (Stop loss: dependent on where one confirms this area). 0.95 [Pending order possible] (Stop loss: 0.9440).
- Sells: Flat (Stop loss: N/A).
DOW 30:
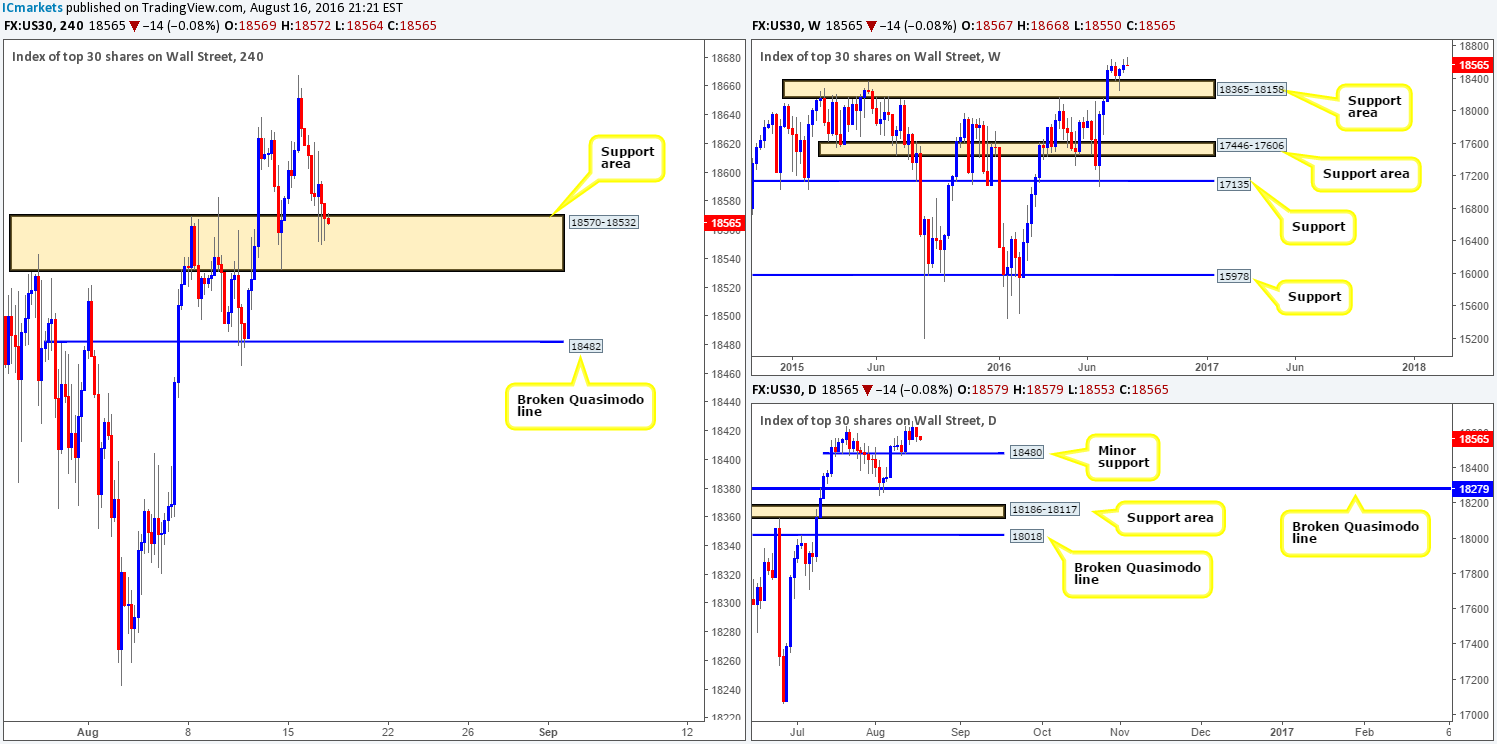
In recent sessions we saw the US stock market pullback from all-time highs of 18668 and test a H4 support area registered at 18570-18532. So far bids are holding firm around this area, but the current H4 candle closes are a little concerning.
With the above information in mind, our team still has their eyes set on the current H4 support area for buys as well as the H4 broken Quasimodo line at 18482. The reason behind choosing these levels simply comes down to the higher-timeframe structures. With price chalking up a picture-perfect weekly pin bar off a weekly support area coming in at 18365-18158 two weeks ago, our team firmly believes that higher prices is likely on the cards. On top of this, there’s a nearby minor daily support seen around the 18480 range, which, as you can see, merges nicely with the aforementioned H4 broken Quasimodo line.
Our suggestions: Watch both of the above said H4 levels (in bold) for lower timeframe buying opportunities (see the top of this report for entry techniques). Should we manage to lock down a trade from either area today, partial profits may be liquidated (this depends on the H4 approach), but ultimately we’ll be looking for price to punch to fresh highs before looking to close out the full position.
Levels to watch/live orders:
- Buys: 18570-18532 [Tentative – confirmation required] (Stop loss: dependent on where one confirms this area).18482 [Tentative – confirmation preferred but not required] (Stop loss: 18438ish region looks best).
- Sells: Flat (Stop loss: N/A)
GOLD:
Following a steep sell off in the US dollar index yesterday, the price of gold appreciated and, as expected, stabbed into offers around the daily resistance level coming in at 1354.6. Taking into account only the H4 chart, we feel that the yellow metal is likely headed southbound back down to the H4 mid-range Quasimodo line at 1332.3.
Should our above analysis be correct, this begs the question, is the 1332.3 mark a viable buy zone? In short, we do not think so. The reason for why simply comes down to where price is coming from: daily resistance at 1354.6. Therefore, if gold declines in value, we’re going to be watching for a close below the above said H4 broken Quasimodo line, for a retest trade, targeting H4 demand at 1315.6-1319.6. We would recommend waiting for lower timeframe confirmation to form (see the top of this report) prior to pulling the trigger simply to avoid any fakeout seen on the retest.
Should price reach this H4 demand base, all of our short positions are to be liquidated which will then see us go about looking to possibly enter long at market (dependent on the approach and time of day) from this area. However, do be prepared for price to drive below this zone before buyers step in! The reason as to why is because along with the H4 demand and it’s supporting higher-timeframe demands (weekly support area at 1307.4-1280.0/daily demand at 1305.3-1322.8), we also have a merging H4 harmonic Gartley reversal zone seen between the H4 Fib 78.6% support at 1322.7 and the X point of the harmonic pattern at 1310.7.

Levels to watch/live orders:
- Buys: 1315.6-1319.6 [Dependent on the approach and time of day a market long is possible] (Stop loss: below the X point of the H4 harmonic formation: 1309.1, which is, as you can see, set just beyond the H4 support at 1310.3).
- Sells: Watch for price to close below the H4 mid-range Quasimodo support at 1332.3 and look to trade any retest seen thereafter (lower timeframe confirmation required).