EUR/USD:
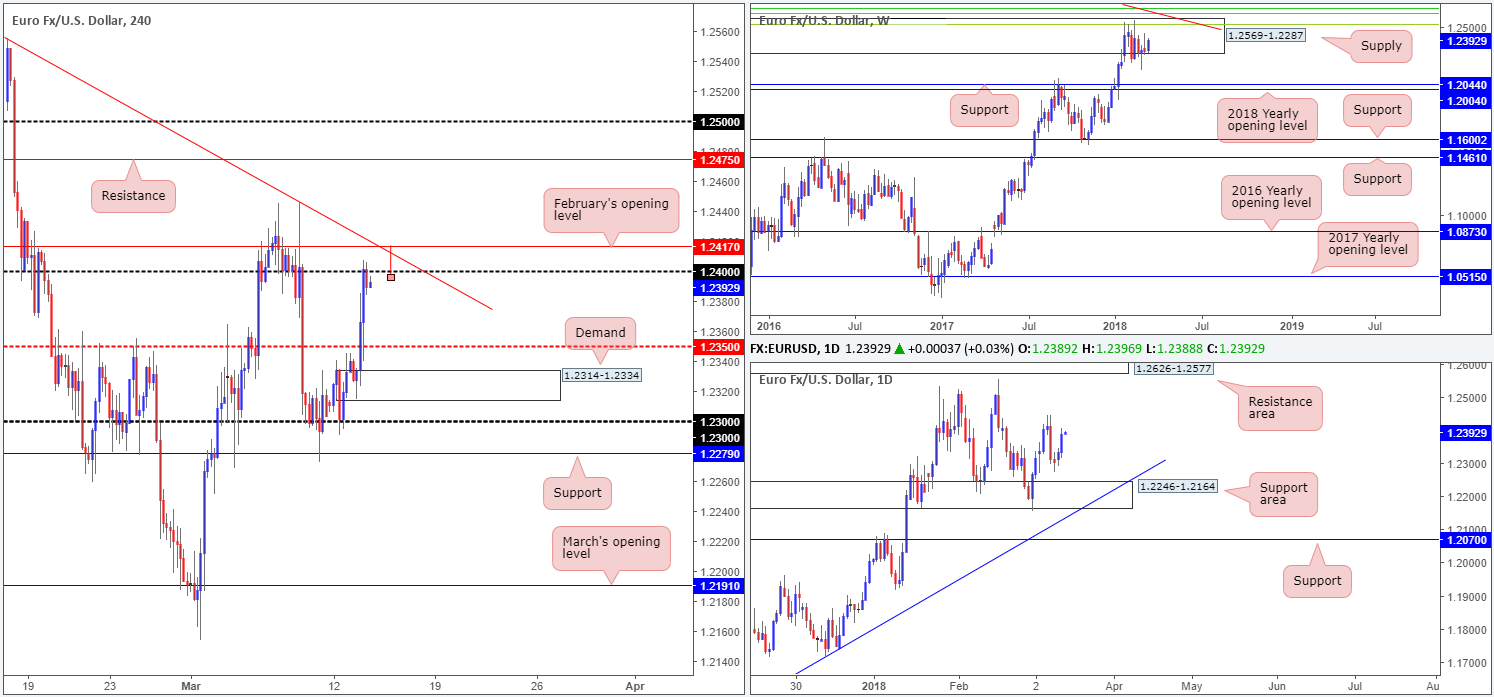
During the course of Monday’s sessions, the single currency caught an early bid on the back of possible exemptions of Eurozone countries on tariffs. Further buying came about following US CPI data, which broke the H4 mid-level resistance 1.2350 and eventually challenged the 1.24 handle going into the close.
Upside remains capped on the weekly timeframe by a major-league weekly supply zone coming in at 1.2569-1.2287. Should sellers crank it up a gear, downside targets fall in around the weekly support band at 1.2044, followed closely by the 2018 yearly opening level at 1.2004. Looking down to the daily timeframe, the only areas of interest at the moment can be seen at a daily support zone drawn from 1.2246-1.2164 and a daily resistance area at 1.2626-1.2577 (positioned above the current weekly supply).
Potential trading zones:
1.24 is a level of interest this morning. Although the number is holding firm, there is a healthy chance we may see a minor breach to the upside here. The reason, other than running stops planted above, is due to a nearby H4 trendline resistance taken from the high 1.2555 and February’s opening level at 1.2417.
An ideal scenario for shorts here would be a H4 bearish pin-bar formation that pierces through 1.24 and taps the nearby aforementioned H4 structure (see chart). Targets from this point fall in at 1.2350, followed closely by H4 demand pegged at 1.2314-1.2334.
Data points to consider: ECB President speaks at 8am; US retail sales m/m and PPI m/m at 12.30pm GMT.
Areas worthy of attention:
Supports: 1.2350; 1.2314-1.2334; 1.2246-1.2164; 1.2004/1.2044.
Resistances: 1.24 handle; 1.2417; H4 trendline resistance; 1.2626-1.2577; 1.2569-1.2287.
GBP/USD:
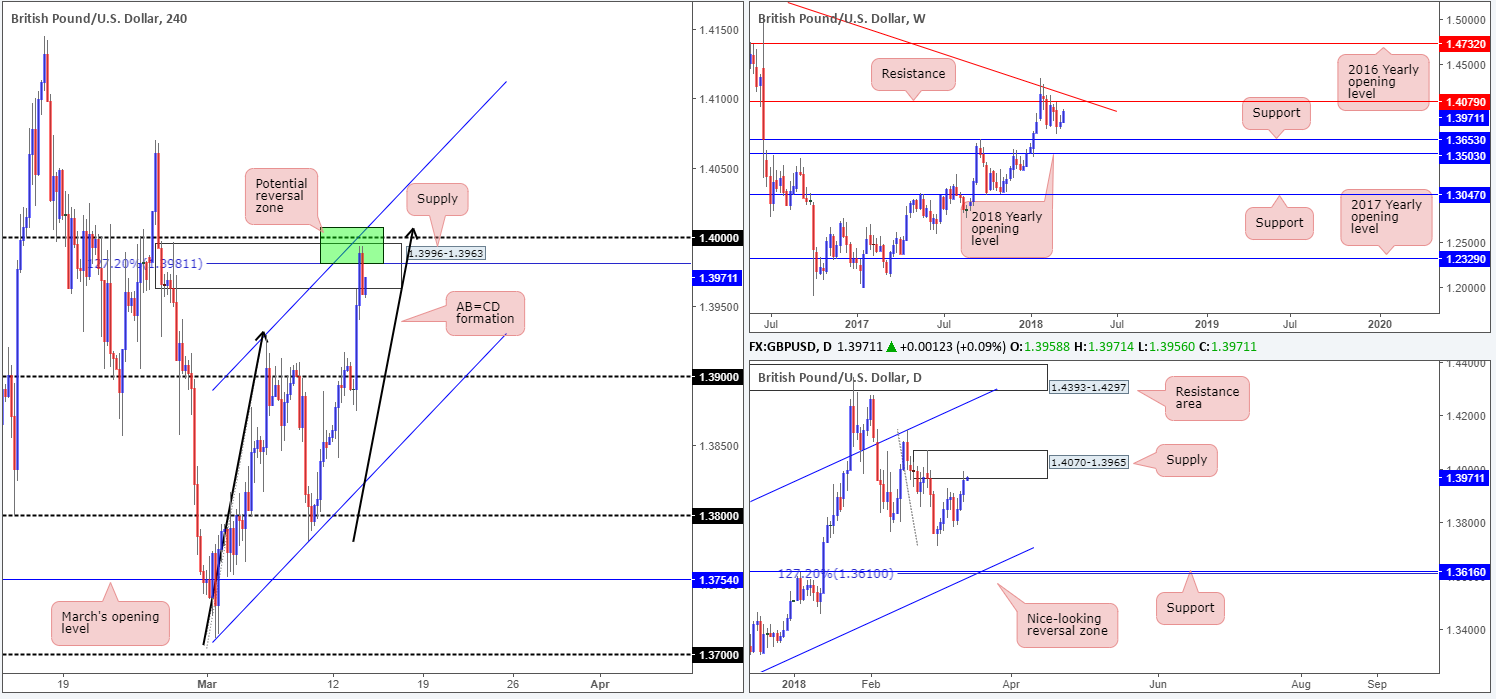
There were no real big surprises in the Spring Statement on Tuesday. The OBR estimated continuing improvement in the labor market, and sees real wages rising eventually, though it only sees inflation returning to target in 2019. A major reason behind the pound’s rise yesterday was due to a waning dollar, which saw the unit come within striking distance of the 1.40 level.
As noted in Tuesday’s report, the 1.4008/1.3981 H4 area (green zone) is a high-probability reversal zone. Besides 1.40 being a widely watched number, seen nearby is a fresh H4 supply area at 1.3996-1.3963, a H4 channel resistance taken from the high 1.3929 and a H4 AB=CD (black arrows) 127.2% Fib ext. point at 1.3981. Also notable from a technical perspective is the fact that the aforesaid H4 zone is seen housed within the walls of a daily supply base coming in at 1.4070-1.3965. As you can see, the bears have so far defended this area.
Potential trading zones:
All eyes remain on 1.4008/1.3981 today. Before looking to short this zone, however, traders may want to consider waiting for 1.40 to be brought into the picture (expect a marginal fakeout beyond this number due to stops lurking above and the aforementioned H4 channel resistance). From this point, we do not see much stopping the unit from being pulled back down to the 1.39 neighborhood.
Data points to consider: US retail sales m/m and PPI m/m at 12.30pm GMT.
Areas worthy of attention:
Supports: 1.39 handle.
Resistances: 1.40 handle; 1.4008/1.3981; 1.4070-1.3965.
AUD/USD:
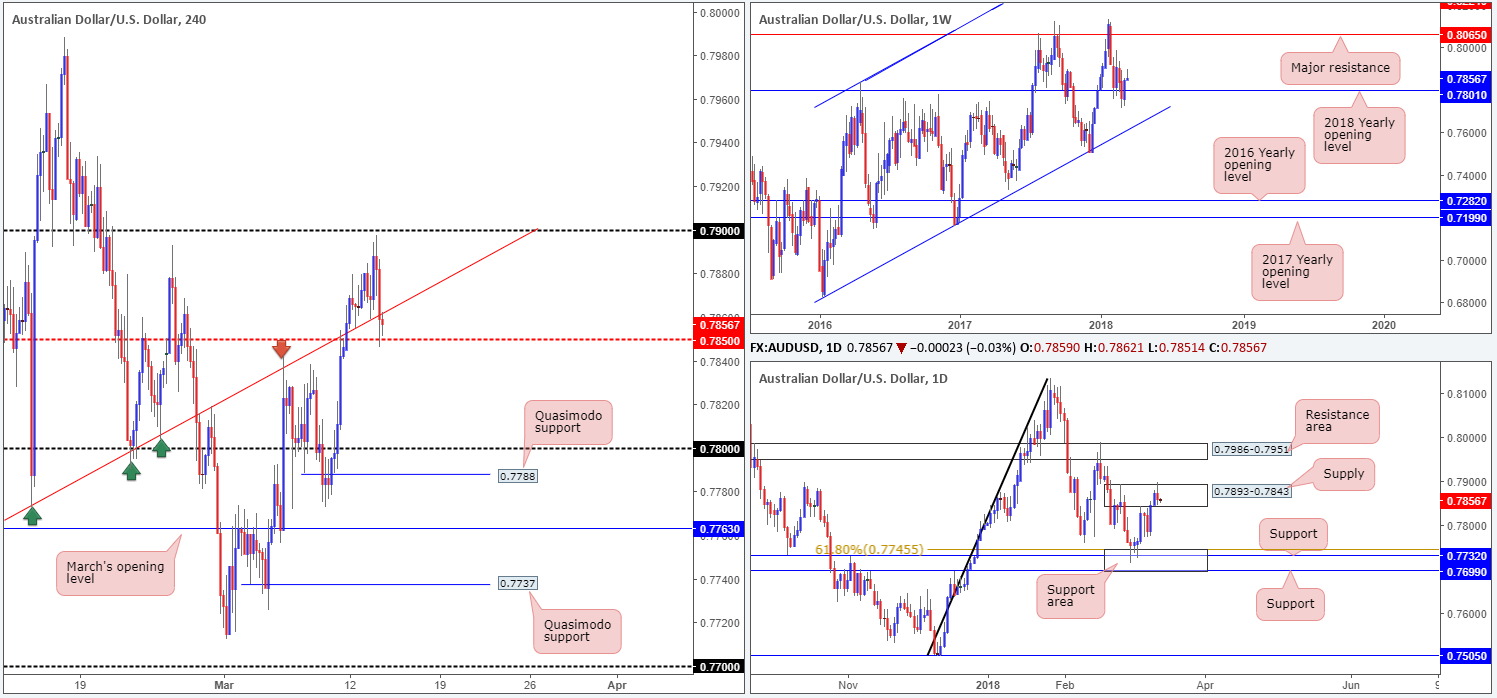
Leaving the 0.79 handle unchallenged, the H4 candles drove through a H4 trendline support etched from the low 0.7758 and retested a H4 mid-level support at 0.7850 amid Tuesday’s segment. A violation of this barrier could lead to a move being seen down to 0.78, which is shadowed closely by a H4 Quasimodo support level at 0.7788.
Over on the bigger picture, daily flow remains loitering within the walls of a daily supply zone coming in at 0.7893-0.7843, despite a marginal breach to the upside. Weekly price, on the other hand, is seen trading above the 2018 yearly opening level (a support) on the weekly timeframe at 0.7801.
Potential trading zones:
Ultimately, we’re looking for the recently broken H4 trendline support to hold as resistance and force the unit sub 0.7850. A H4 close beyond this number coupled with a strong retest would, according to the technicals, be enough to validate shorts down to 0.78/0.7788.
Data points to consider: Chinese industrial production y/y and fixed asset investment ytd/y at 2am; US retail sales m/m and PPI m/m at 12.30pm GMT.
Areas worthy of attention:
Supports: 0.7850; 0.7801; 0.78 handle; 0.7788.
Resistances: 0.7893-0.7843; 0.79 handle.
USD/JPY:
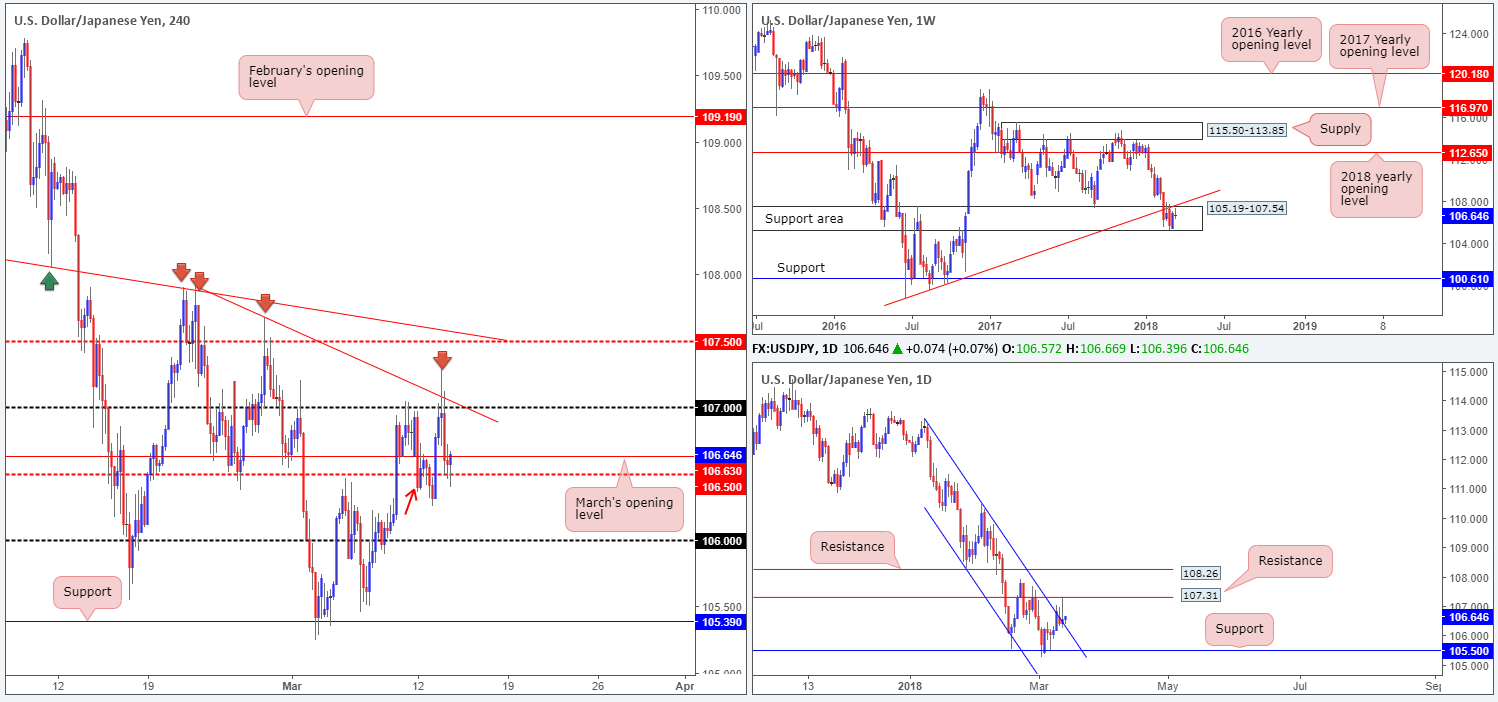
In recent sessions, the Japanese yen was a beneficiary of dollar weakness, following a failed attempt to breach the 107 handle and nearby H4 trendline resistance (taken from the high 107.90). Alongside US equities, the pair turned lower and eventually broke through March’s opening level at 106.63 and tested the H4 mid-level support at 106.50. Beyond this mid-way point, we see a minor H4 Quasimodo support around the 106.35 range (see the red arrow), followed then by the 106 handle.
On the daily timeframe, price action is seen nudging its way beyond a daily channel resistance line taken from the high 113.38, after coming within a few pips of testing daily resistance at 107.31. On the other side of the field, weekly movement remains within a weekly support area at 105.19-107.54 but continues to reflect a bearish tone below the nearby weekly trendline support-turned resistance etched from the low 98.78.
Potential trading zones:
As of current price, we do not much to hang our hat on. H4 structure is restricted to the upside by 106.63 and the 107 handle. To the downside, we have to contend with possible buying being seen from 106.35, and then the nearby 106 handle.
Data points to consider: US retail sales m/m and PPI m/m at 12.30pm GMT.
Areas worthy of attention:
Supports: 106 handle; 106.50; 106.35; 105.19-107.54.
Resistances: 106.63; daily channel resistance; weekly trendline resistance; 107.31; 107 handle; H4 trendline resistance.
USD/CAD:
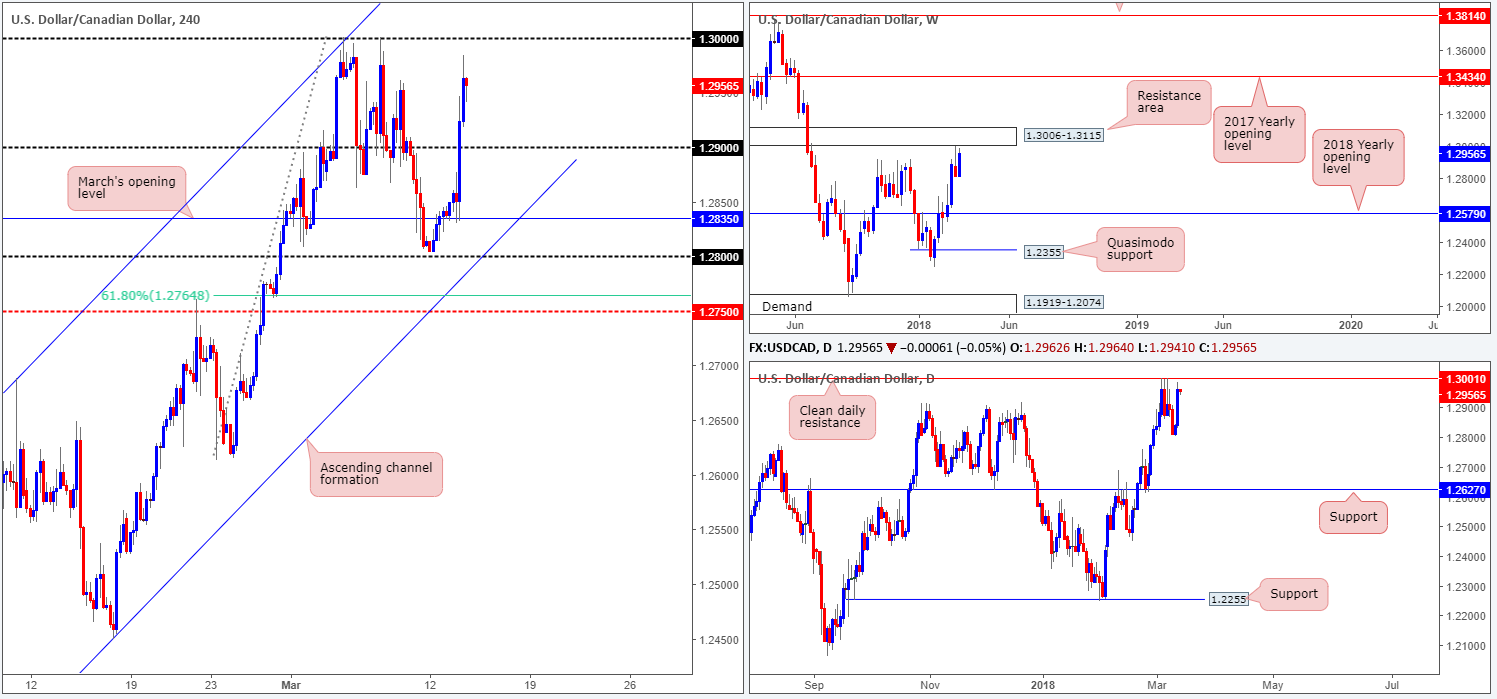
Following dovish comments from BoC Gov. Poloz on Tuesday, the US dollar aggressively advanced against its Canadian counterpart. The pair chewed through offers at 1.29 and wrapped up the session topping just short of the large psychological level 1.30.
1.30 will likely be a widely watched number today – even more so considering that it also represents a daily resistance at 1.3001, and is seen located just a few pips short of a weekly resistance area at 1.3006-1.3115.
Potential trading zones:
Should H4 price challenge 1.30 today and chalk up a H4 full or near-full-bodied bearish candle, a selloff from here is certainly possible. Downside targets from this angle, given that we’re dealing with higher-timeframe areas, fall in at 1.29, followed by March’s opening level at 1.2835.
Data points to consider: US retail sales m/m and PPI m/m at 12.30pm GMT.
Areas worthy of attention:
Supports: 1.29 handle; 1.2835.
Resistances: 1.30 handle; 1.3006-1.3115; 1.3001.
USD/CHF:
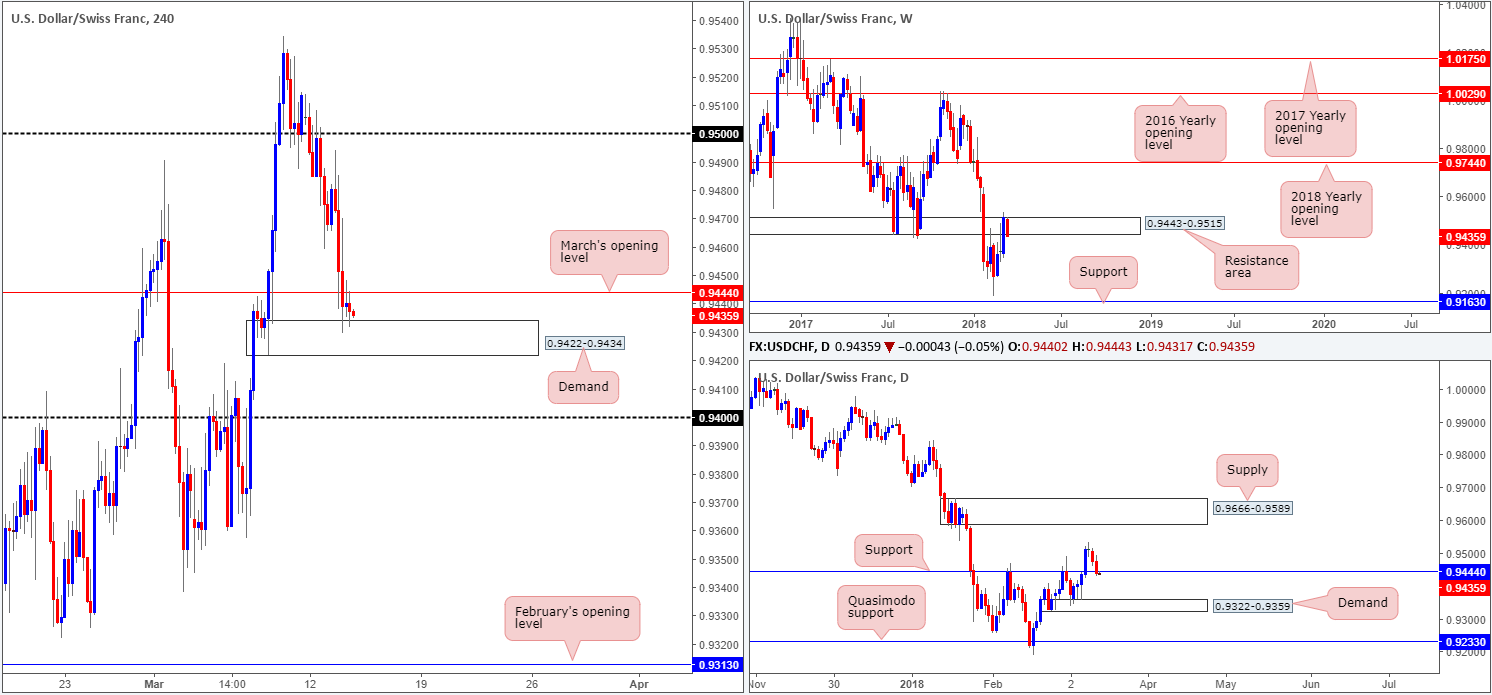
The US dollar fell sharply across the board on Tuesday following the release of US inflation figures. This eventually saw the H4 candles breach March’s opening level at 0.9444 and shake hands with a H4 demand base located at 0.9422-0.9434. With the unit now effectively sandwiched between these two barriers, where do we stand on the bigger picture?
Thanks to yesterday’s push lower, daily price marginally closed beyond daily support at 0.9444. In the event that this level is respected as resistance, the next port of call on this scale falls in at a daily demand drawn from 0.9322-0.9359. The story on the weekly timeframe shows that weekly price is attempting to defend a weekly resistance area at 0.9443-0.9515. Continued selling from this point has the weekly support level at 0.9163 to target.
Potential trading zones:
While the current H4 demand boasts a strong base, higher-timeframe direction indicates that we may see further downside materialize. A violation of the H4 demand could set the stage for a test of 0.94. Should a push lower take place here followed up with a retest, intraday sellers may want to begin looking for viable selling opportunities. If we get beyond 0.94; the next downside target can be seen at the top edge of daily demand mentioned above at 0.9359.
Data points to consider: US retail sales m/m and PPI m/m at 12.30pm GMT.
Areas worthy of attention:
Supports: 0.9422-0.9434; 0.94; 0.9322-0.9359; 0.9163.
Resistances: 0.9444; 0.9443-0.9515.
DOW 30:
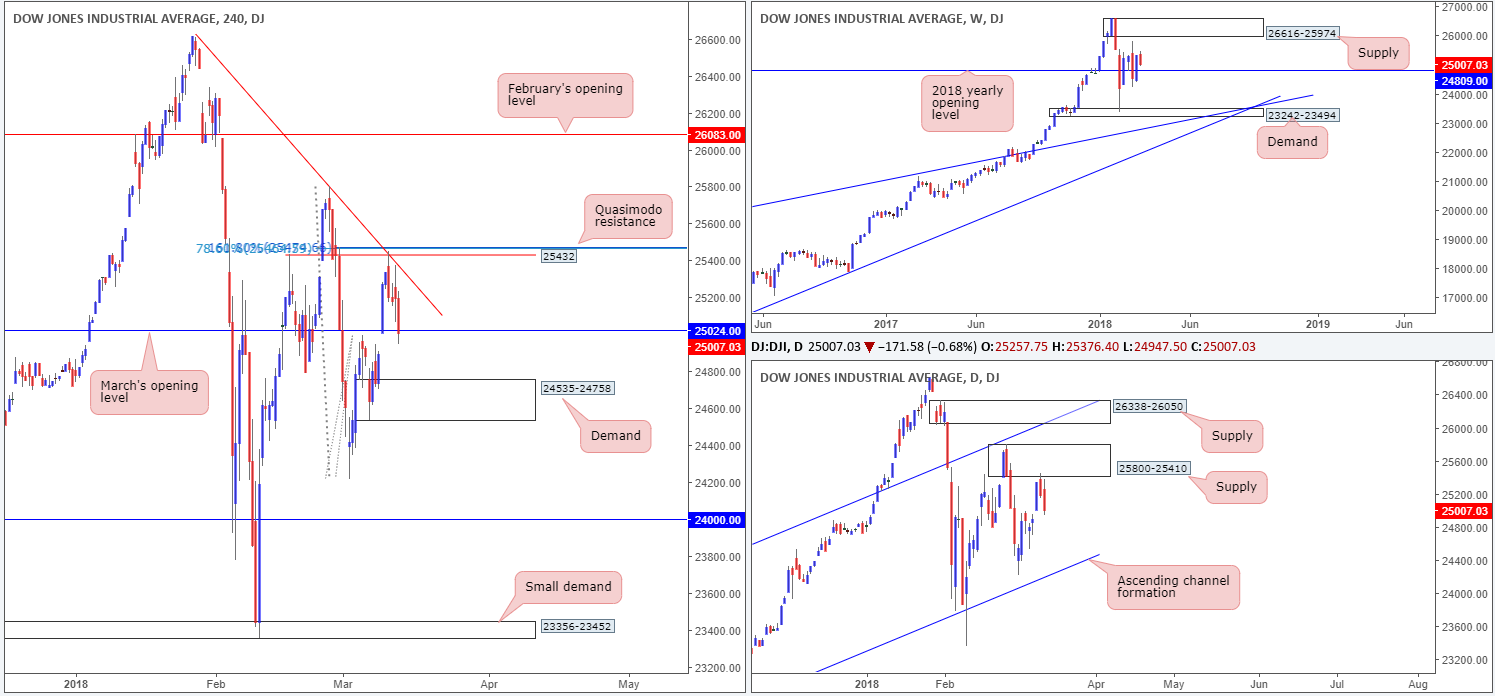
After Tuesday’s US CPI figures, which came in line with expectations, the DJIA extended Monday’s decline from a H4 Quasimodo resistance at 25432.With the help of a daily supply zone located at 25800-25410, the move forced H4 price down to March’s opening level at 25024, in the shape of a near-full-bodied H4 bearish candle. Beyond this line, we can see a H4 demand base drawn from 24535-24758.
Potential trading zones:
The only area that really stands out at the moment is the H4 demand mentioned above at 24535-24758. Although we’re not particularly impressed by the demand’s structure, we do like the fact that the 2018 yearly opening level seen on the weekly timeframe (support) at 24809 is planted just above it. Therefore, this could be an area to consider trading for an intraday bounce.
Data points to consider: US retail sales m/m and PPI m/m at 12.30pm GMT.
Areas worthy of attention:
Supports: 25024; 24535-24758; 24809.
Resistances: 25432; 25800-25410.
GOLD:
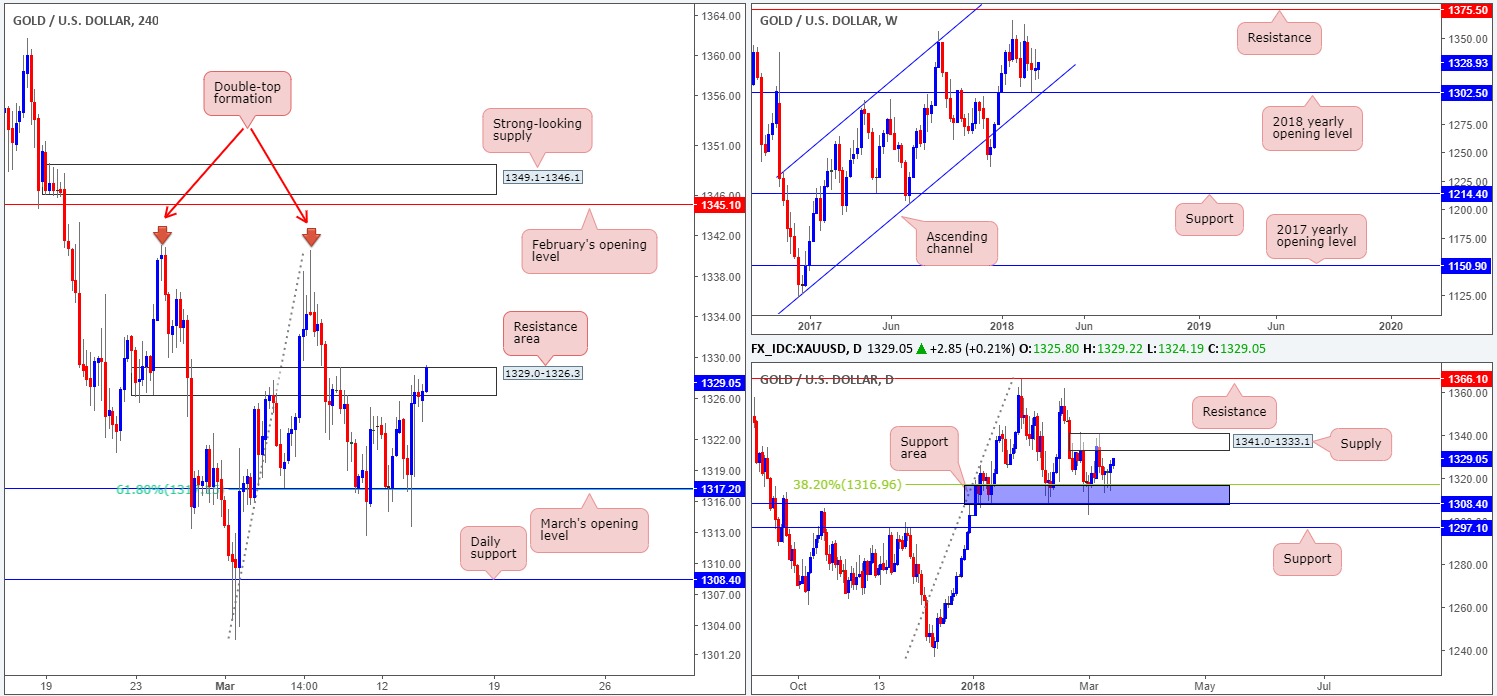
Following a downward push in the US dollar index on Tuesday, the yellow metal, once again, found active bids around March’s opening level seen on the H4 timeframe at 1317.2. Besides this level interacting with a 61.8% H4 Fib support, the nearby daily support zone marked in blue at 1308.4/1316.9 also provided an additional layer of support (note the three back-to-back daily buying tails).
As is clear from the H4 timeframe, the buyers and sellers are currently seen battling for position within the confines of a H4 resistance area at 1329.0-1326.3 (bulls seem to have an edge at the moment). A break of this zone clears upside to 1340.2ish: a double-top H4 resistance, positioned just short of February’s opening level at 1345.1. Here’s the kicker, though, for anyone looking to try and long this move. A break above the noted H4 resistance zone will, almost immediately, place the daily supply area at 1341.0-1333.1 in the firing range (the next upside target on the daily scale).
Potential trading zones:
Traders will want to exercise caution buying any form of breakout beyond the aforesaid H4 resistance zone, given how closely positioned the daily supply base is!
In regard to selling, traders may want to consider avoiding the current H4 resistance base. This is simply because the daily supply is likely to act as a magnet and pull the unit higher.
Therefore, on account of the above structure, opting to remain on the sidelines should be taken into account.
Areas worthy of attention:
Supports: 1317.2; 1308.4/1316.9.
Resistances: 1341.0-1333.1; 1329.0-1326.3; 1340.2.
This site has been designed for informational and educational purposes only and does not constitute an offer to sell nor a solicitation of an offer to buy any products which may be referenced upon the site. The services and information provided through this site are for personal, non-commercial, educational use and display. IC Markets does not provide personal trading advice through this site and does not represent that the products or services discussed are suitable for any trader. Traders are advised not to rely on any information contained in the site in the process of making a fully informed decision.
This site may include market analysis. All ideas, opinions, and/or forecasts, expressed or implied herein, information, charts or examples contained in the lessons, are for informational and educational purposes only and should not be construed as a recommendation to invest, trade, and/or speculate in the markets. Any trades, and/or speculations made in light of the ideas, opinions, and/or forecasts, expressed or implied herein, are committed at your own risk, financial or otherwise.
The use of the site is agreement that the site is for informational and educational purposes only and does not constitute advice in any form in the furtherance of any trade or trading decisions.
The accuracy, completeness and timeliness of the information contained on this site cannot be guaranteed. IC Markets does not warranty, guarantee or make any representations, or assume any liability with regard to financial results based on the use of the information in the site.
News, views, opinions, recommendations and other information obtained from sources outside of www.icmarkets.com.au, used in this site are believed to be reliable, but we cannot guarantee their accuracy or completeness. All such information is subject to change at any time without notice. IC Markets assumes no responsibility for the content of any linked site. The fact that such links may exist does not indicate approval or endorsement of any material contained on any linked site.
IC Markets is not liable for any harm caused by the transmission, through accessing the services or information on this site, of a computer virus, or other computer code or programming device that might be used to access, delete, damage, disable, disrupt or otherwise impede in any manner, the operation of the site or of any user’s software, hardware, data or property.