Wednesday 11th October: Technical outlook and review.
Waiting for lower timeframe confirmation is our main tool to confirm strength within higher timeframe zones, and has really been the key to our trading success. It takes a little time to understand the subtle nuances, however, as each trade is never the same, but once you master the rhythm so to speak, you will be saved from countless unnecessary losing trades. The following is a list of what we look for:
· A break/retest of supply or demand dependent on which way you’re trading.
· A trendline break/retest.
· Buying/selling tails/wicks – essentially we look for a cluster of very obvious spikes off of lower timeframe support and resistance levels within the higher timeframe zone.
We typically search for lower-timeframe confirmation between the M15 and H1 timeframes, since most of our higher-timeframe areas begin with the H4. Stops are usually placed 1-3 pips beyond confirming structures.
EUR/USD:
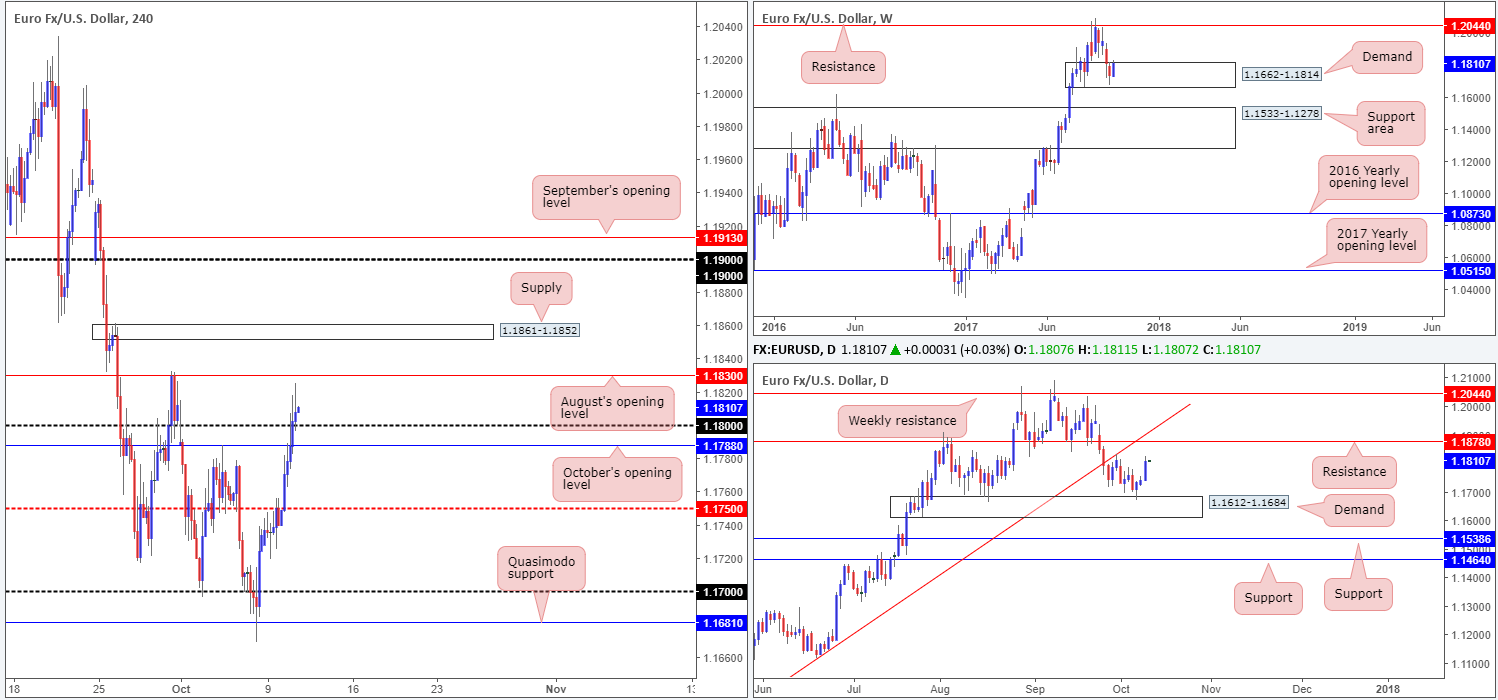
In recent trading, the single currency extended higher for a third consecutive session, pulling H4 price above October’s opening level at 1.1780 and the 1.18 handle. The euro rose as high as 1.1825 after Catalonia’s president struck a conciliatory tone in a speech about the region’s independence referendum (Bloomberg).
Given that weekly action remains trading within the walls of a demand at 1.1662-1.1814, and daily price shows room to advance north up to as far as resistance coming in at 1.1878, further buying may be on the cards. Despite this, buying on the H4 timeframe is challenging. Not only do we have August’s opening level at 1.1830 lurking overhead, we also have fresh supply marked at 1.1861-1.1852 to contend with.
Suggestions: In view of the overhead structures seen on the H4 timeframe, taking a long position in this market based on higher-timeframe structure is not something we would support. It is just not worth the risk, in our humble opinion.
Data points to consider: FOMC member Kaplan speaks at 1am; US JOLTS report at 3pm; FOMC meeting minutes at 7pm GMT+1.
Levels to watch/live orders:
- Buys: Flat (stop loss: N/A).
- Sells: Flat (stop loss: N/A).
GBP/USD:
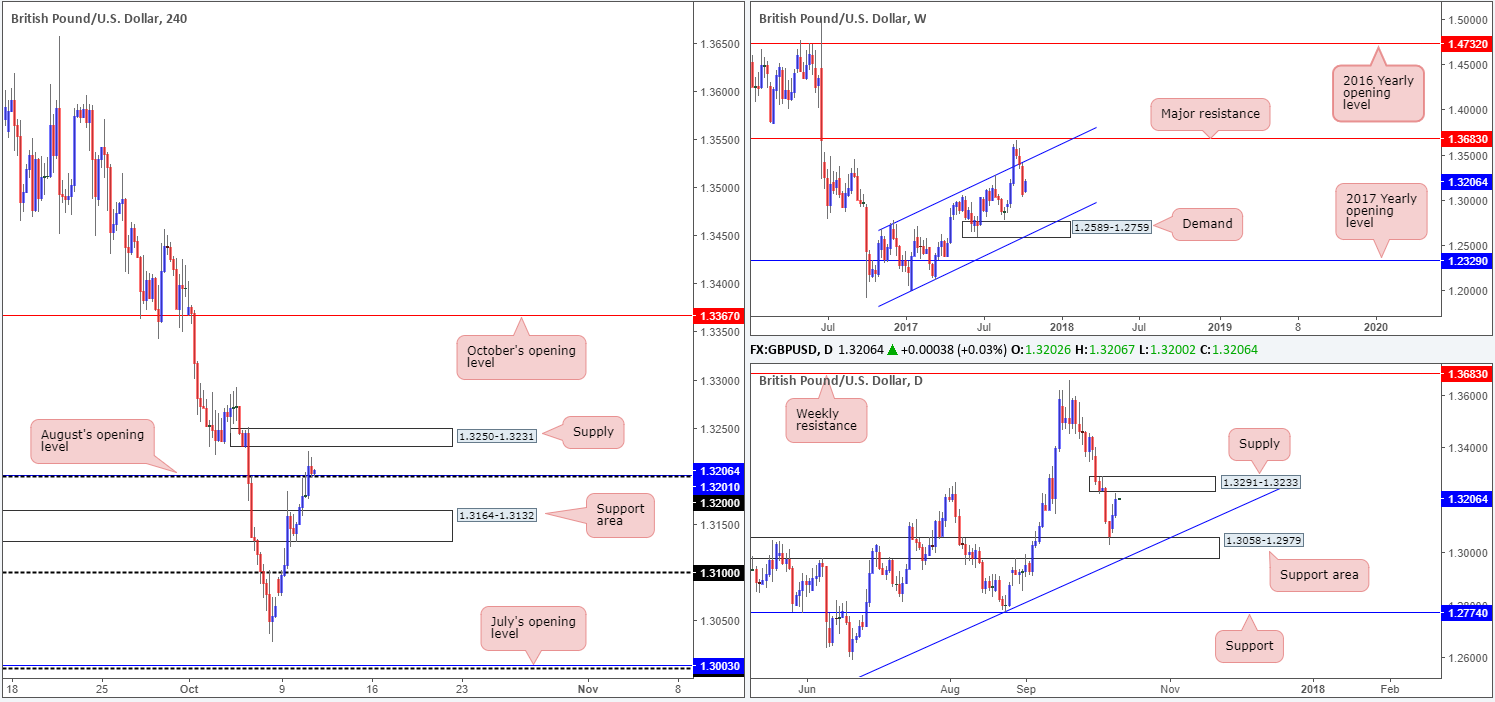
The British pound climbed higher for a second consecutive day on Tuesday, reaching highs of 1.3225. The H4 resistance area at 1.3164-1.3132 (now acting support zone) was taken out in early trading, allowing the unit to breach and eventually close above the 1.32 handle/August’s opening level at 1.3201. As we write, the latter is being retested as support.
The majority of lower-timeframe buyers are likely looking to long this move. This is a risky play in our book. Not only is there nearby H4 fresh supply penciled in at 1.3250-1.3231, there is also a daily supply zone at 1.3291-1.3233 encapsulating the H4 area! On top of this, weekly price recently re-entered an ascending channel formation (1.1986/1.2673), potentially opening up downside to as low as the demand area positioned at 1.2589-1.2759, which happens to merge with the noted channel support.
Suggestions: On account of the above information, we would strongly advise against buying this market right now. In cases such as these, we typically wait for H4 price to dip back below the round number/support and then look to sell. However, considering that there is also a nearby support area positioned at 1.3164-1.3132, we’ll pass and remain on the sidelines.
Data points to consider: FOMC member Kaplan speaks at 1am; US JOLTS report at 3pm; FOMC meeting minutes at 7pm GMT+1.
Levels to watch/live orders:
- Buys: Flat (stop loss: N/A).
- Sells: Flat (stop loss: N/A).
AUD/USD:
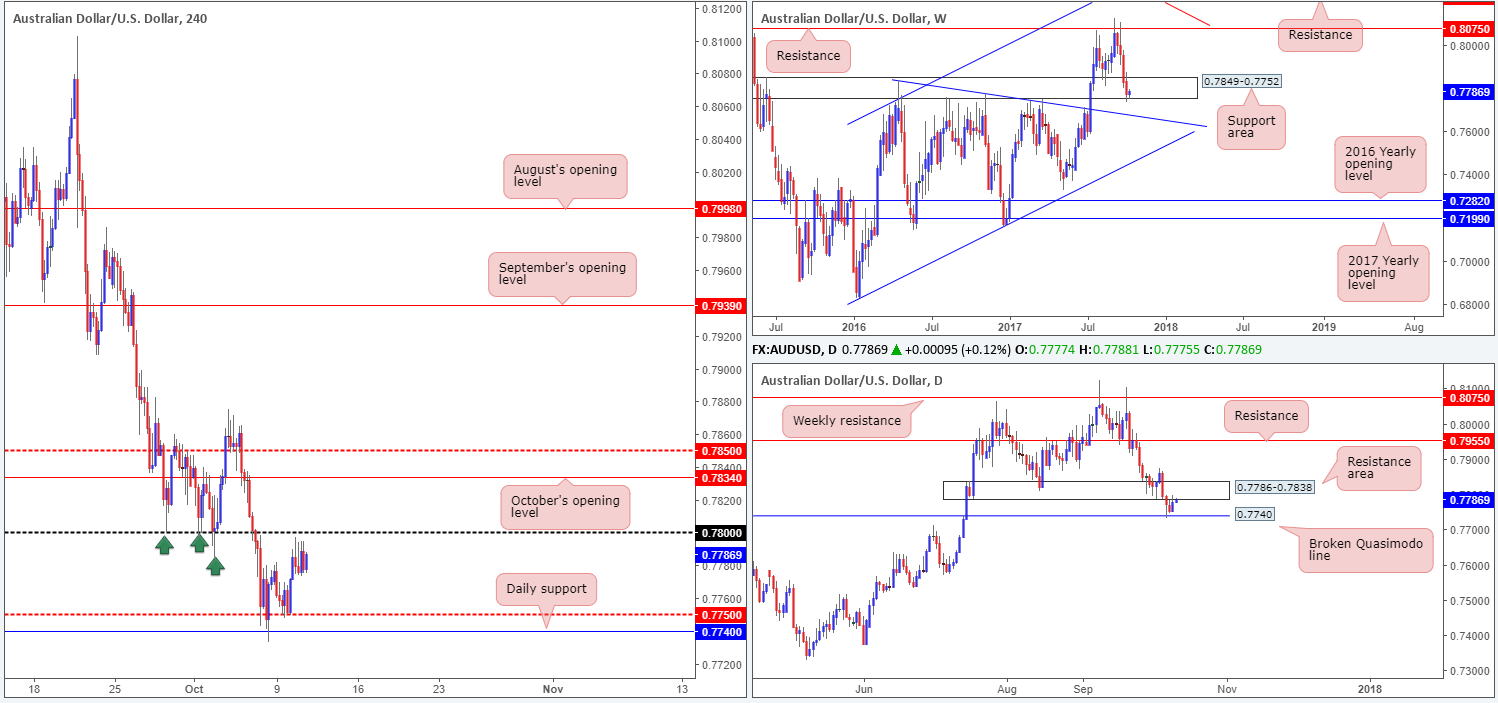
The AUD/USD rallied from the H4 mid-level support at 0.7750 in early trading on Tuesday, pulling the commodity currency up to highs of 0.7797. It was from this point on, however, that the H4 candles entered into a tight consolidation between 0.7797/0.7774.
Looking over to the weekly timeframe, buyers look to be regaining consciousness around the lower edge of a support area at 0.7849-0.7752. Should the bulls continue to push higher from here, the next upside target does not come into view until we reach resistance pegged at 0.8075. Reinforcing weekly bulls is the daily broken Quasimodo line at 0.7740. Unfortunately though, hanging over this area like a threatening rain cloud is a resistance base coming in at 0.7786-0.7838.
Suggestions: 0.78 will likely provide some resistance to the market today should it be tested, given the strong support it offered earlier this month (see green arrows). A break above this number, nevertheless, would open up the path north to October’s opening level at 0.7834, followed closely by the H4 mid-level resistance at 0.7850.
Based on the weekly timeframe showing some promise from a support area, and daily/H4 price trading beneath resistances, neither a long nor short seems attractive at the moment.
Data points to consider: FOMC member Kaplan speaks at 1am; US JOLTS report at 3pm; FOMC meeting minutes at 7pm GMT+1.
Levels to watch/live orders:
- Buys: Flat (stop loss: N/A).
- Sells: Flat (stop loss: N/A).
USD/JPY:
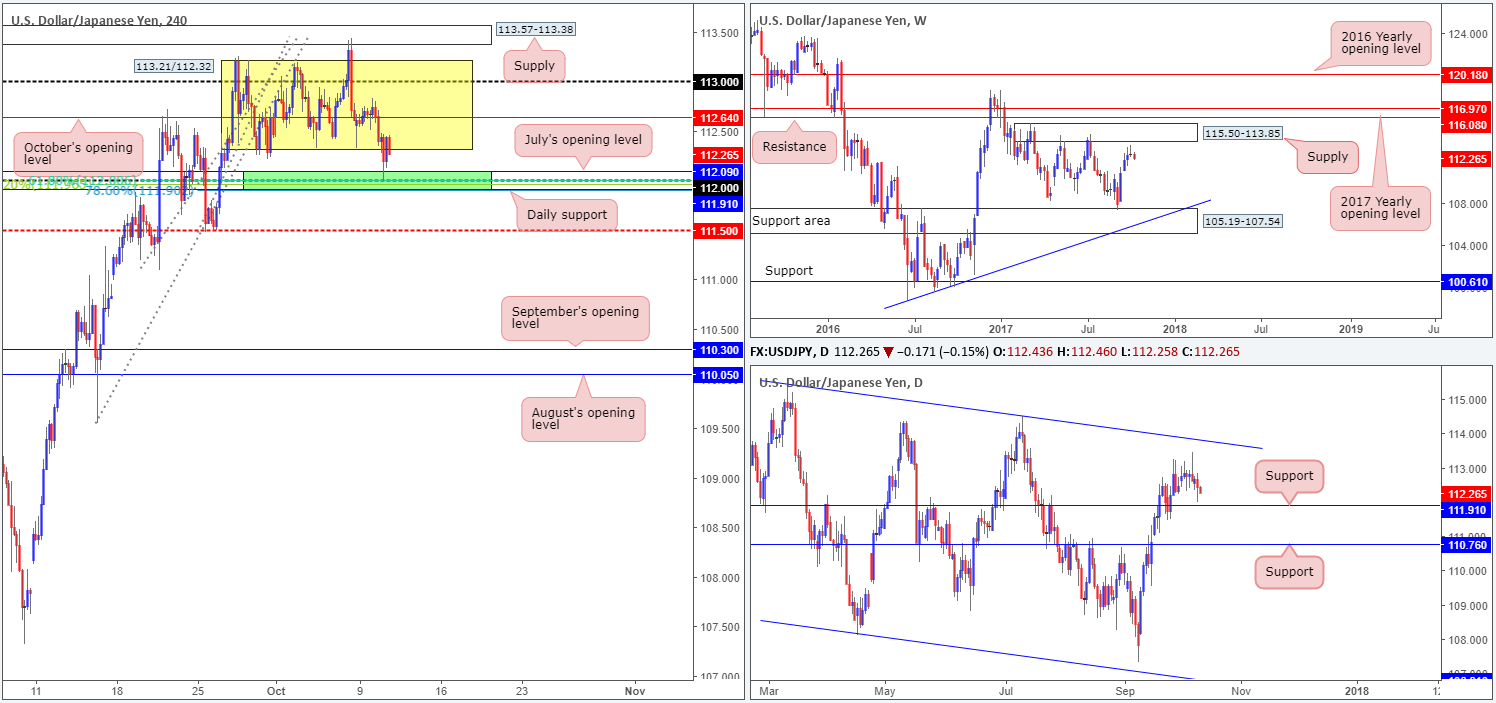
For those who have been following our reports over the past week you may recall we have been banging the drum about longs from the 112 handle for quite a while now. Here’s why:
· Positioned directly above daily support at 111.91.
· Located just below July’s opening level at 112.09.
· Sited nearby a Fibonacci cluster comprised of a 38.2% support at 111.96 taken from the low 109.54, a 61.8% support at 112 from the low 111.09 and a 78.6% support at 111.90 drawn from the low 111.47.
· The stop-loss orders planted below the range edge at 112.32 (see yellow box). When these stops are triggered they (along with breakout sellers’ orders) become sell orders and thus help provide traders with deep pockets the liquidity required to buy.
In addition to the above, we saw space for both the weekly and daily candles to continue marching north. Upside targets can be seen at weekly supply drawn from 115.50-113.85 and the daily trendline resistance etched from the high 115.50 (merges nicely with the noted weekly supply).
Suggestions: Well done to any of our readers who happened to jump aboard this move. The first take-profit target can be seen at October’s opening level at 112.64, followed by the 113 handle.
Data points to consider: FOMC member Kaplan speaks at 1am; US JOLTS report at 3pm; FOMC meeting minutes at 7pm GMT+1.
Levels to watch/live orders:
- Buys: Flat (stop loss: N/A).
- Sells: Flat (stop loss: N/A).
USD/CAD:
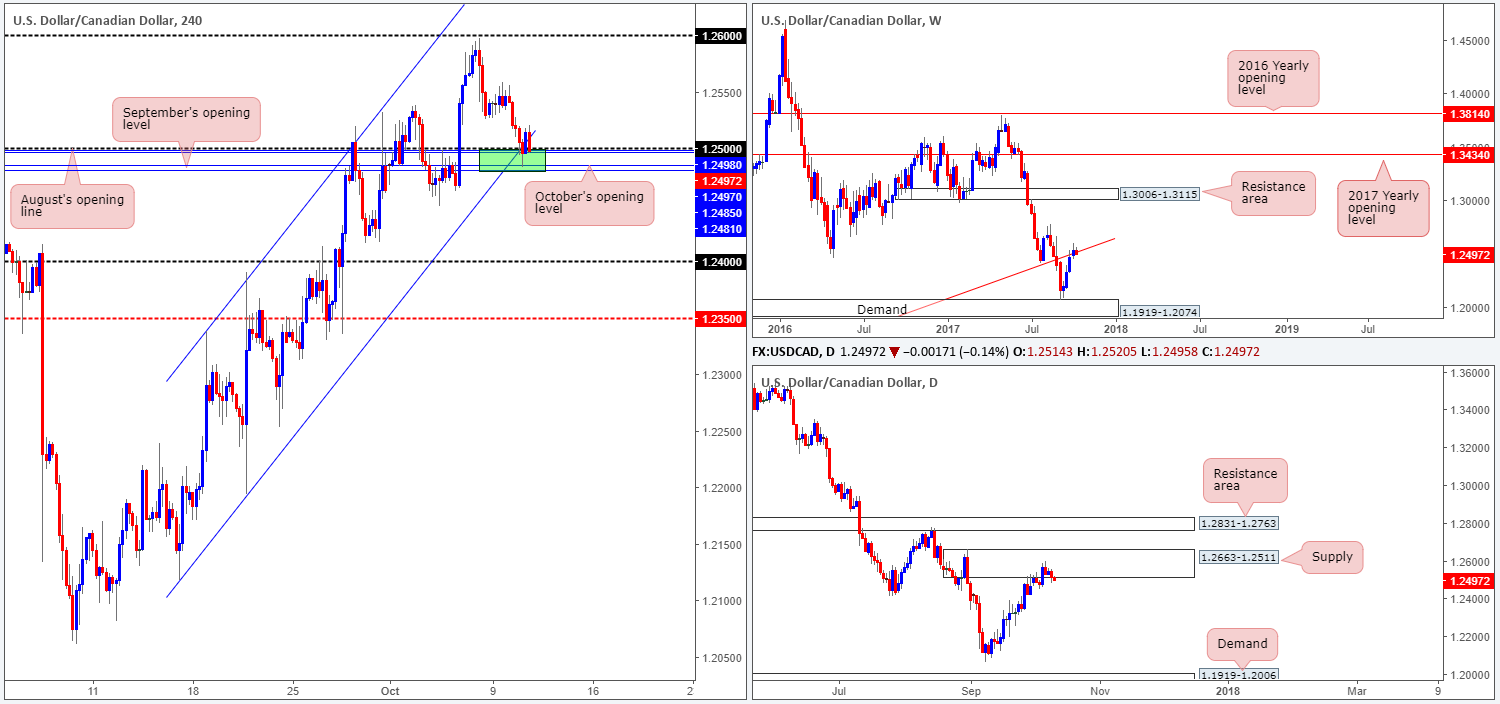
The 1.25 handle elbowed its way into the spotlight on Tuesday and has so far held ground. As highlighted in yesterday’s report, 1.25 does have the potential to bounce price. Not only does 1.25 converge with a H4 channel support etched from the low 1.2194, it also boasts August (1.2498), September (1.2481) and October’s (1.2485) monthly opening levels (see H4 green zone). The reason behind believing that 1.25 is only worthy of a bounce simply comes down to where we are currently trading from on the bigger picture.
Weekly price is seen trading around a trendline resistance taken from the low 0.9633. A push lower from this angle could see the USD/CAD drop as far south as demand coming in at 1.1919-1.2074. The daily candles are also seen testing a strong-looking supply drawn from 1.2663-1.2511.
Suggestions: Although H4 price recently printed a near-full-bodied bullish candle from the green H4 buy zone, the following candle quickly turned sour, indicating a lack of enthusiasm from the bulls. With this being the case, we will avoid taking a long in this market at this time. However, we will continue to watch how lower-timeframe price action behaves around 1.25 for a potential intraday bounce (see the top of this report for ideas on how to use the lower timeframes as a means of entry).
Data points to consider: FOMC member Kaplan speaks at 1am; US JOLTS report at 3pm; FOMC meeting minutes at 7pm GMT+1.
Levels to watch/live orders:
- Buys: 1.25 region ([waiting for a lower-timeframe buy signal to form is advised before pulling the trigger] stop loss: dependent on where one confirms this area).
- Sells: Flat (stop loss: N/A).
USD/CHF:
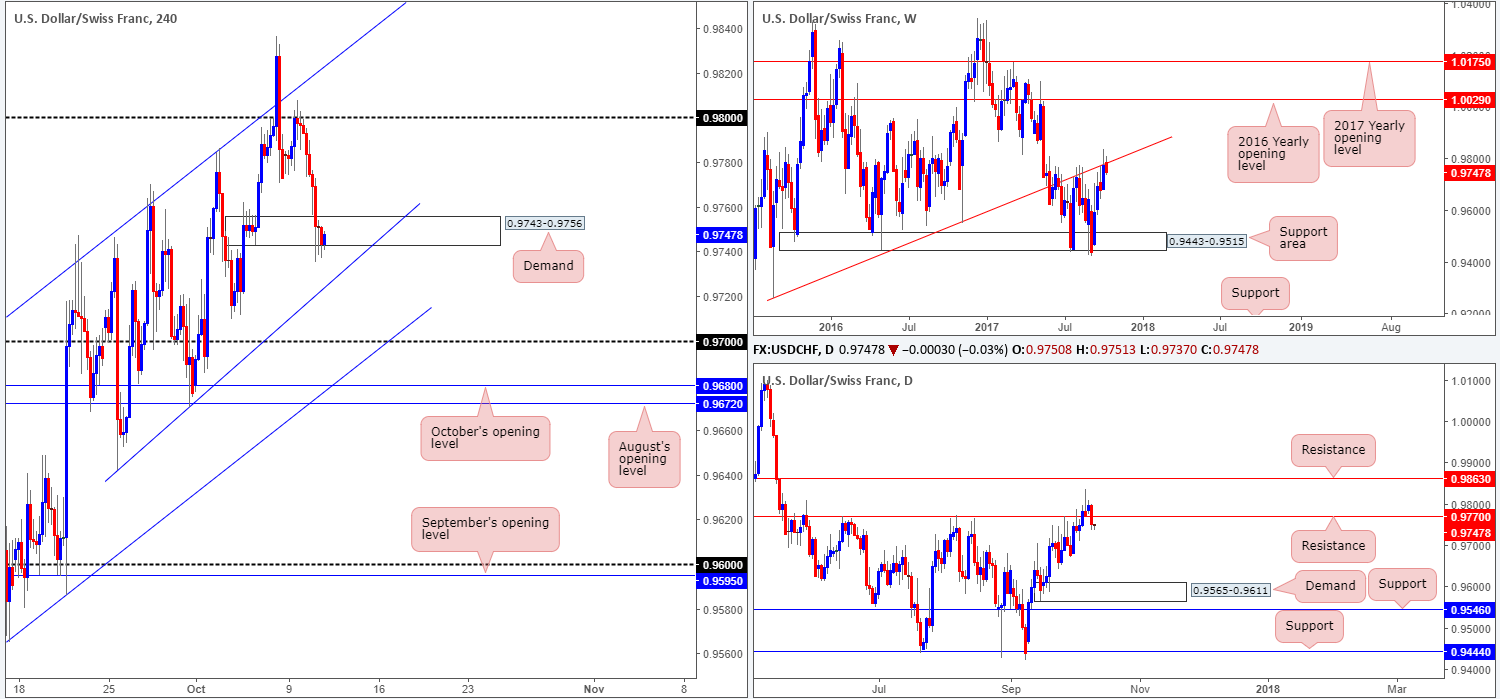
Using a top-down approach this morning, it’s clear to see that the bears are beginning to make an appearance at the underside of the weekly trendline resistance taken from the low 0.9257. Downside momentum from this weekly angle was, technically speaking, likely the main catalyst behind Tuesday’s breach of daily support at 0.9770 (now acting resistance). Beyond this level, we do not really see much active demand in view until we reach daily demand registered at 0.9565-0.9611.
H4 demand at 0.9743-0.9756, as you can see, suffered multiple blows on Tuesday but is still managing to remain in the fight. Stop-loss orders fixed below this area have likely been triggered, which could, judging how the H4 candles have responded thus far, eventually lead to a move being seen down to nearby H4 trendline support etched from the low 0.9641.
Suggestions: In light of where the market is trading from on the higher timeframes, our desk is biased to the downside for the time being. In spite of this, selling on the H4 scale is somewhat difficult. Not only because of the current H4 demand, but also due to the nearby trendline support mentioned above. So, in much the same way as the majority of the majors this morning, we will be taking to the sidelines and reassessing price action going into tomorrow’s open.
Data points to consider: FOMC member Kaplan speaks at 1am; US JOLTS report at 3pm; FOMC meeting minutes at 7pm GMT+1.
Levels to watch/live orders:
- Buys: Flat (stop loss: N/A).
- Sells: Flat (stop loss: N/A).
DOW 30:
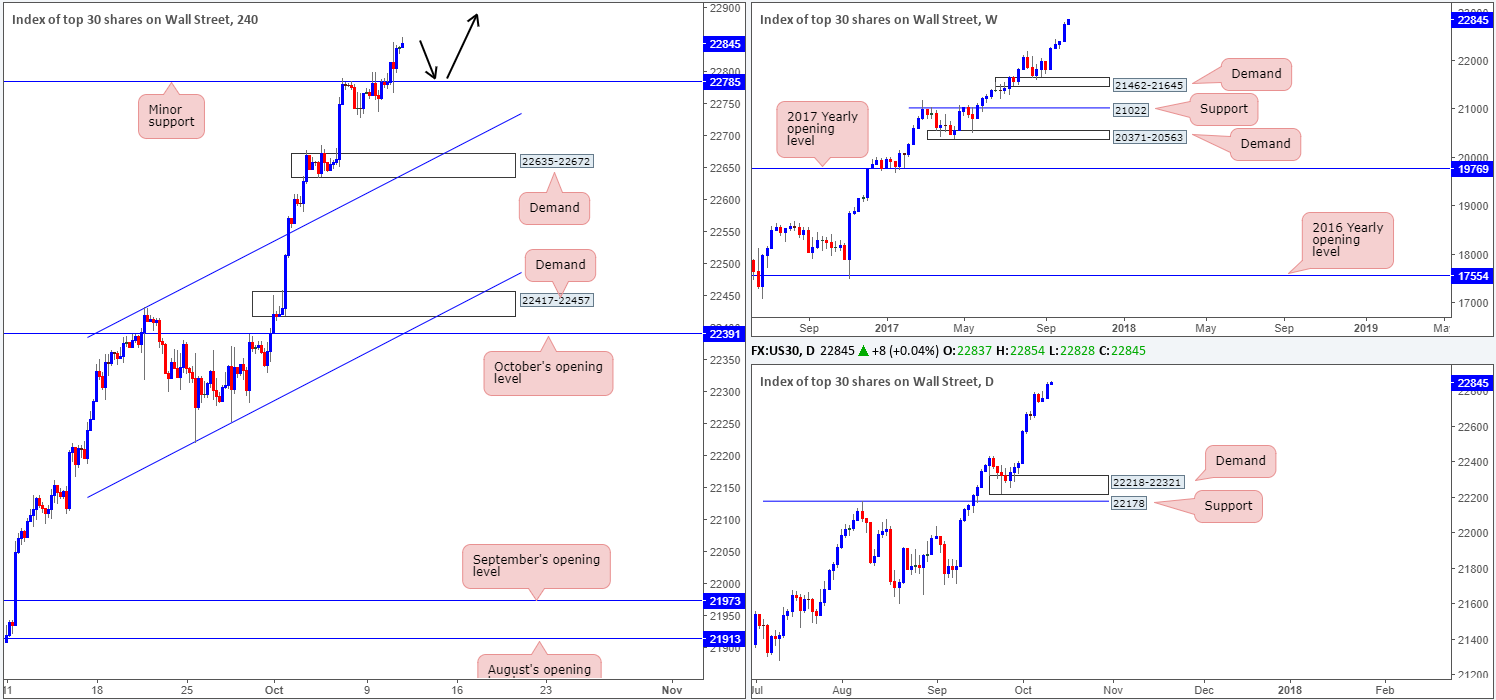
Wall Street continued to press north on Tuesday, consequently tapping fresh record highs of 22846. In spite of the geopolitical concerns surrounding the US and North Korea and Trump’s administration tax reform, the index managed to chalk up a near-full-bodied daily bull candle!
Suggestions: Owing to the strong uptrend this market is in right now, we have our eye on minor H4 support at 22785 today for potential longs. Should H4 price pullback and challenge the said barrier, we would, assuming that the unit formed a full or near-full-bodied bull candle, look to buy this market in the hope of price advancing to fresh highs (see black arrows).
Data points to consider: FOMC member Kaplan speaks at 1am; US JOLTS report at 3pm; FOMC meeting minutes at 7pm GMT+1.
Levels to watch/live orders:
- Buys: 22785 region ([waiting for a reasonably sized H4 bullish candle to form – preferably a full, or near-full-bodied candle – is advised] stop loss: ideally beyond the candle’s tail).
- Sells: Flat (stop loss: N/A).


