EUR/USD:
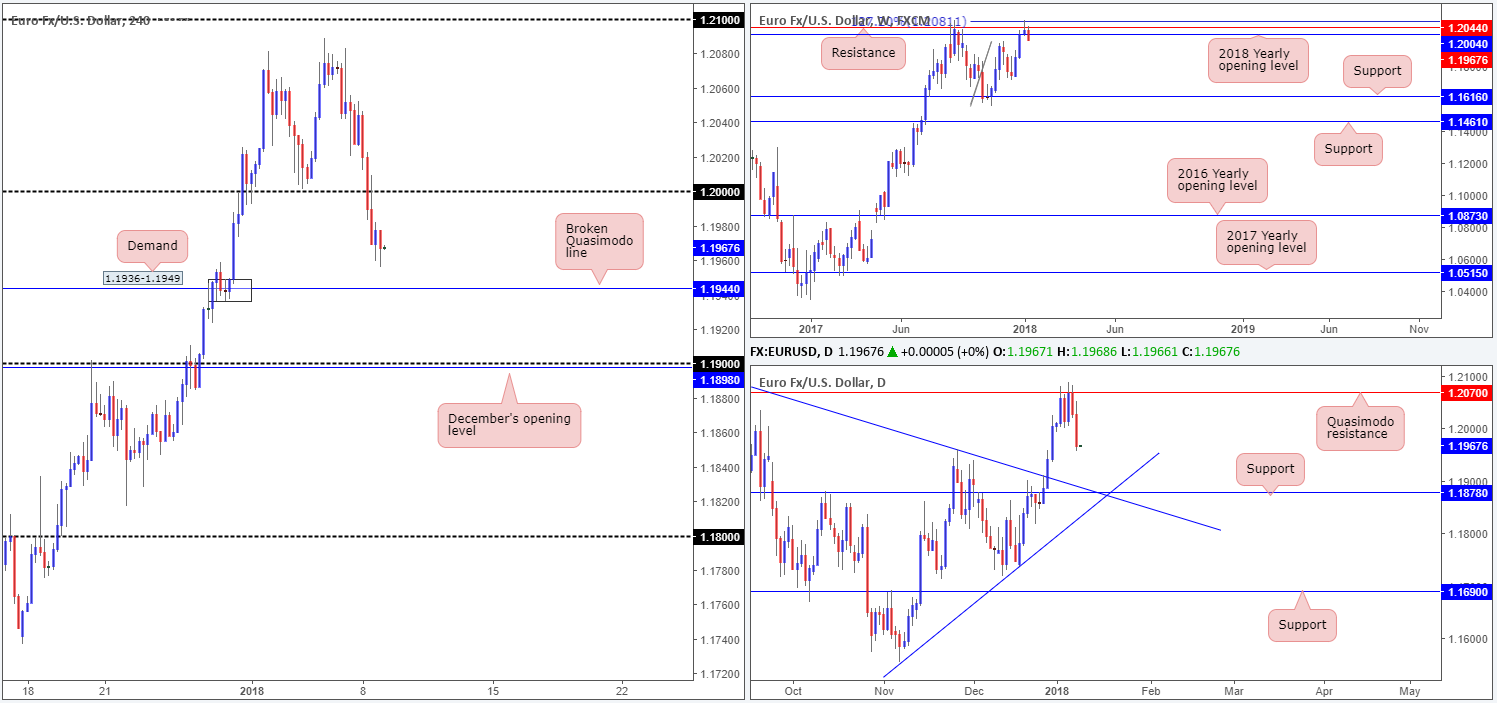
The single currency came under substantial pressure on Monday, as the US dollar index established firm ground above the 92.00 mark. Largely ignoring upbeat European retail sales data m/m (increased by 1.5% vs. expected 1.4%), the H4 candles swallowed the large psychological handle 1.20 and struck a session low of 1.1956 on the day.
In Monday’s report, we highlighted a possible sell on a break and retest (H4 basis) of 1.20. As you can see, shortly after a H4 close below 1.20 was registered, price action retested the underside of this number and continued to press lower. Well done to any of our readers who managed to pin down a setup from here! The next downside target on the H4 timeframe can be seen at a H4 broken Quasimodo line drawn from 1.1944, which happens to be accompanied by a H4 demand base at 1.1936-1.1949.
Higher-timeframe structure, as noted in yesterday’s analysis, continues to reflect a bearish position. Last week’s trade chalked up a weekly bearish selling wick around a weekly resistance level at 1.2044 and a 127.2% weekly Fib ext. point at 1.2081. This saw weekly price breach the 2018 yearly opening level seen on the weekly timeframe at 1.2004 yesterday.
In conjunction with weekly structure, the daily candles extended Friday’s rejection from the daily Quasimodo resistance level at 1.2070, seen a few pips beneath the aforesaid weekly Fib extension. Should sellers continue to dominate, the next port of call on the daily scale can be seen at 1.1878 which boasts strong daily trendline confluence.
Market direction:
H4 structure implies that potential buyers may enter the market from the aforesaid broken Quasimodo line. The flipside to this, however, is weekly and daily price show further selling could be seen as far south as the daily support level mentioned above at 1.1878.
For those who are short from beneath 1.20, reducing risk to breakeven at 1.1944 and taking partial profits may be something to consider. A H4 close below 1.1944 would, in our view, confirm a bearish bias down to the 1.19 handle, followed closely by December’s opening level (H4) at 1.1898 and the noted daily support. This area makes for a nice-looking second take-profit target.
Data points to consider: No high-impacting news events on the docket.
Areas worthy of attention:
Supports: 1.1936-1.1949; 1.1944; 1.19 handle; 1.1898; 1.1878.
Resistances: 1.20 handle; 1.2081; 1.2044; 1.2004; 1.2070.
GBP/USD:
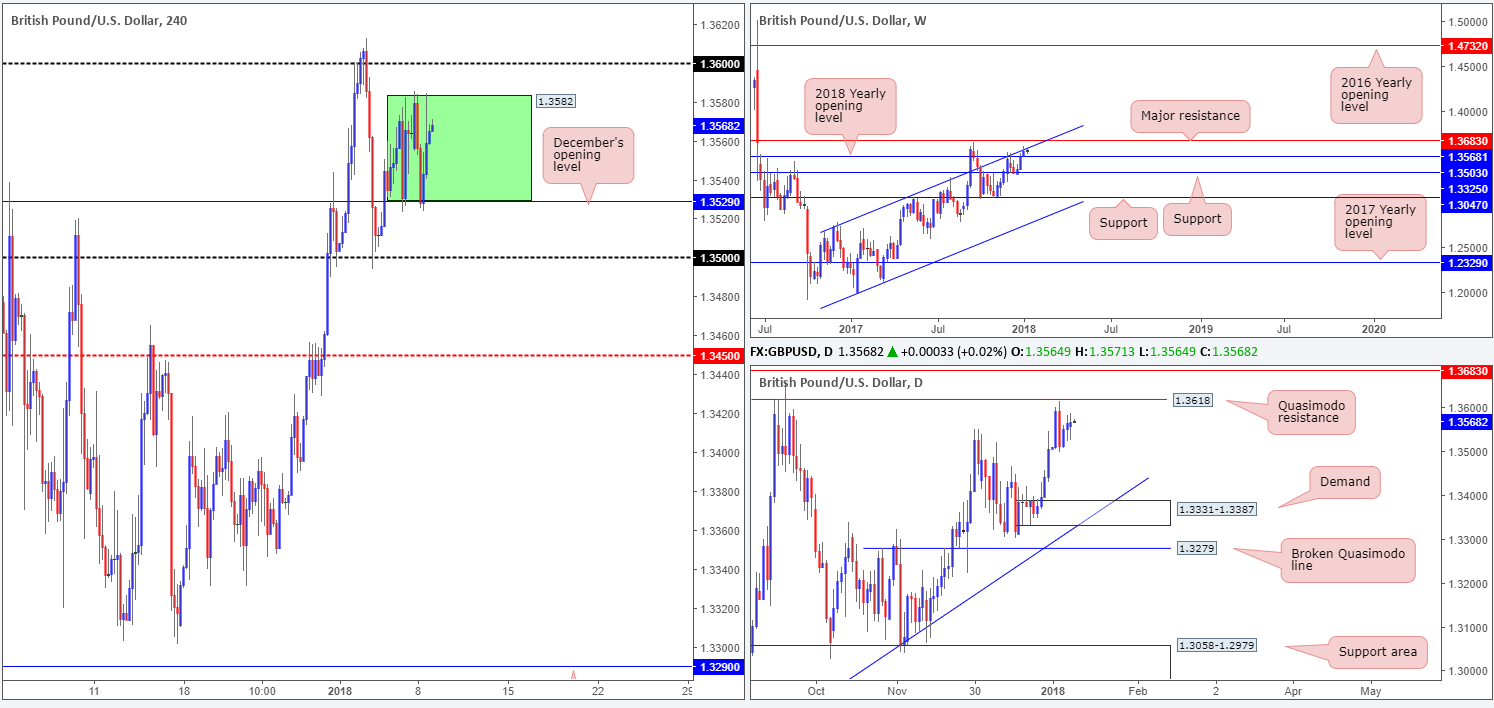
In recent news, British PM Theresa May declared the appointment of David Lidington as the Minister for the Cabinet Office. On the charts, London trading saw H4 price establish firm ground around December’s opening level at 1.3529, and ultimately extend to highs of 1.3584. Despite this, the British pound remains confined between the noted monthly opening level and the 1.3582 area (green zone).
A quick look at the higher timeframes shows that there is strong resistance in sight. The GBP/USD advanced for a third consecutive session during the course of last of last week’s trading. This lifted the pair to a weekly high of 1.3612 and enabled the unit shake hands with a weekly channel resistance extended from the high 1.2673. In the case that this channel is engulfed, the path north should be clear up to a nearby weekly resistance plotted at 1.3683. A rejection of the channel, however, could possibly be hindered by the 2018 yearly opening level seen on the weekly timeframe at 1.3503.
Turning our focus to the daily timeframe, we can see that a daily Quasimodo resistance at 1.3618 can be seen providing additional mettle for the aforementioned weekly channel resistance. Further selling on this scale could see price approach the daily demand printed at 1.3331-1.3387, which happens to merge with a daily trendline support taken from the low 1.2108.
Market direction:
Technically speaking, this is remains a somewhat restricted market at the moment. To the upside, we have a weekly channel resistance and a daily Quasimodo resistance level at 1.3618. To the downside, December’s opening level on the H4 timeframe is likely the first port of call, followed closely by the 2018 yearly opening line and the 1.35 handle.
On account of the above, and considering that little change was seen on Monday, neither a long nor short seems attractive right now.
Data points to consider: No high-impacting news events on the docket.
Areas worthy of attention:
Supports: 1.3529; 1.3503; 1.35 handle; 1.3331-1.3387; daily trendline support.
Resistances: Weekly channel resistance; 1.3683; 1.3618; 1.3582.
AUD/USD:
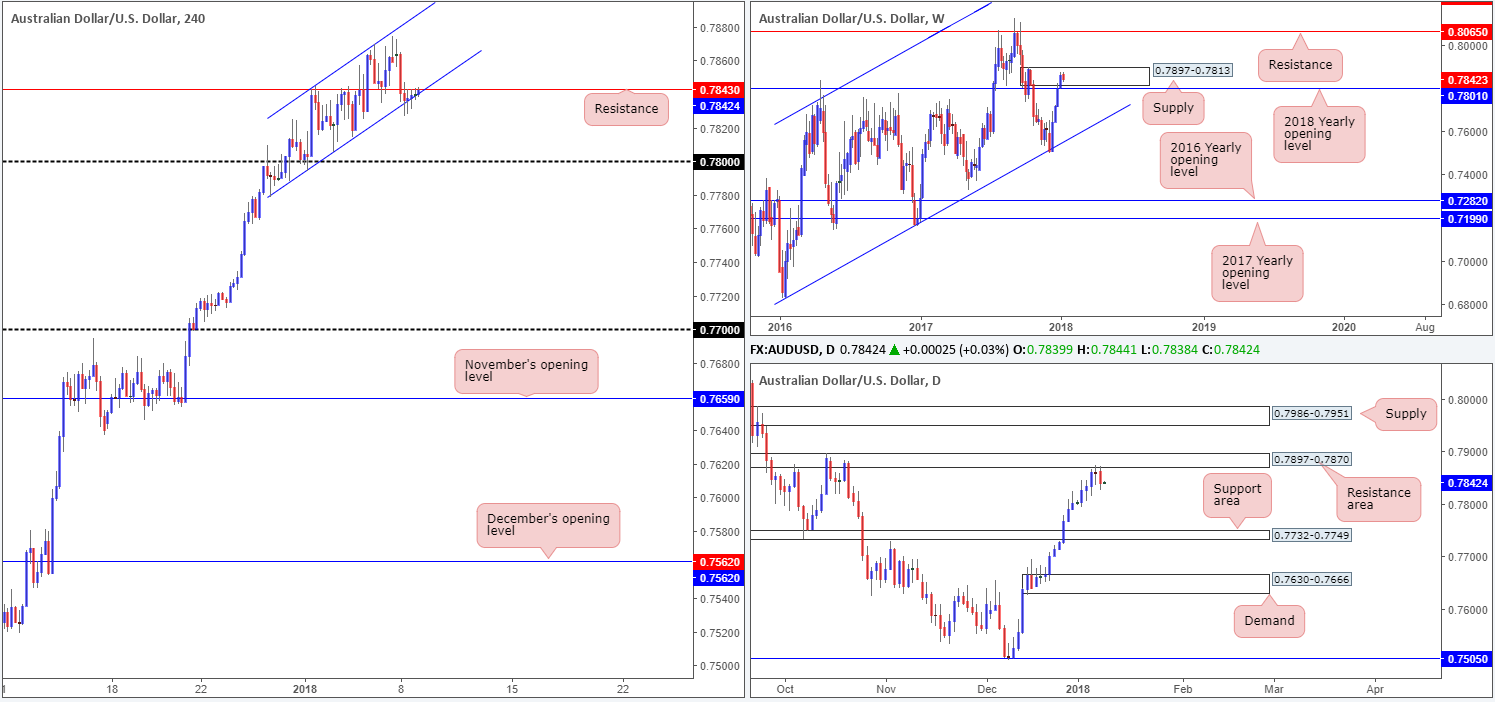
Kicking off from the top this morning, we can see that weekly price is beginning to show signs of weakness within weekly supply seen at 0.7897-0.7813. In spite of this, break beyond the 2018 yearly opening level at 0.7801, in our technical view, will need to be seen before a bearish bias is confirmed. In the event that the bulls continue to push, a break of this area could lead to price challenging the weekly resistance level drawn from 0.8065.
A closer look at price action on the daily timeframe reveals that the unit formed a reasonably strong-looking daily bearish candle after touching gloves with a daily resistance area seen at 0.7897-0.7870. Not only is this zone positioned within the upper limits of the weekly supply zone highlighted above, we can also see that downside is reasonably clear until the daily support area seen at 0.7732-0.7749.
The pair was well-offered in early trading on Monday, eventually forcing the H4 candles beneath H4 support at 0.7844. This, we believe, was largely due to the Australian government forecasting a 20% iron ore price drop in 2018. Although the H4 candles managed to breach the noted support, the unit was unable to take out the nearby H4 channel support taken from the low 0.7778.
Market direction:
Given the recent break of H4 support which is now being retested as resistance, along with the current weekly supply and daily resistance area, a push through the aforementioned H4 channel support is potentially on the cards. Waiting for a close below and retest of the noted channel line may be the better path to take. The first take-profit target can be seen at the 0.78 handle, which happens to merge with the 2018 yearly opening level seen on the weekly timeframe at 0.7801. For that reason, one should expect some buying to be seen here and therefore would do well to act accordingly (reducing risk to breakeven etc.).
Data points to consider: No high-impacting news events on the docket.
Areas worthy of attention:
Supports: 0.7801; 0.7732-0.7749; H4 channel support; 0.78 handle.
Resistances: 0.7897-0.7813; 0.8065; 0.7897-0.7870; H4 channel resistance; 0.7843.
USD/JPY:
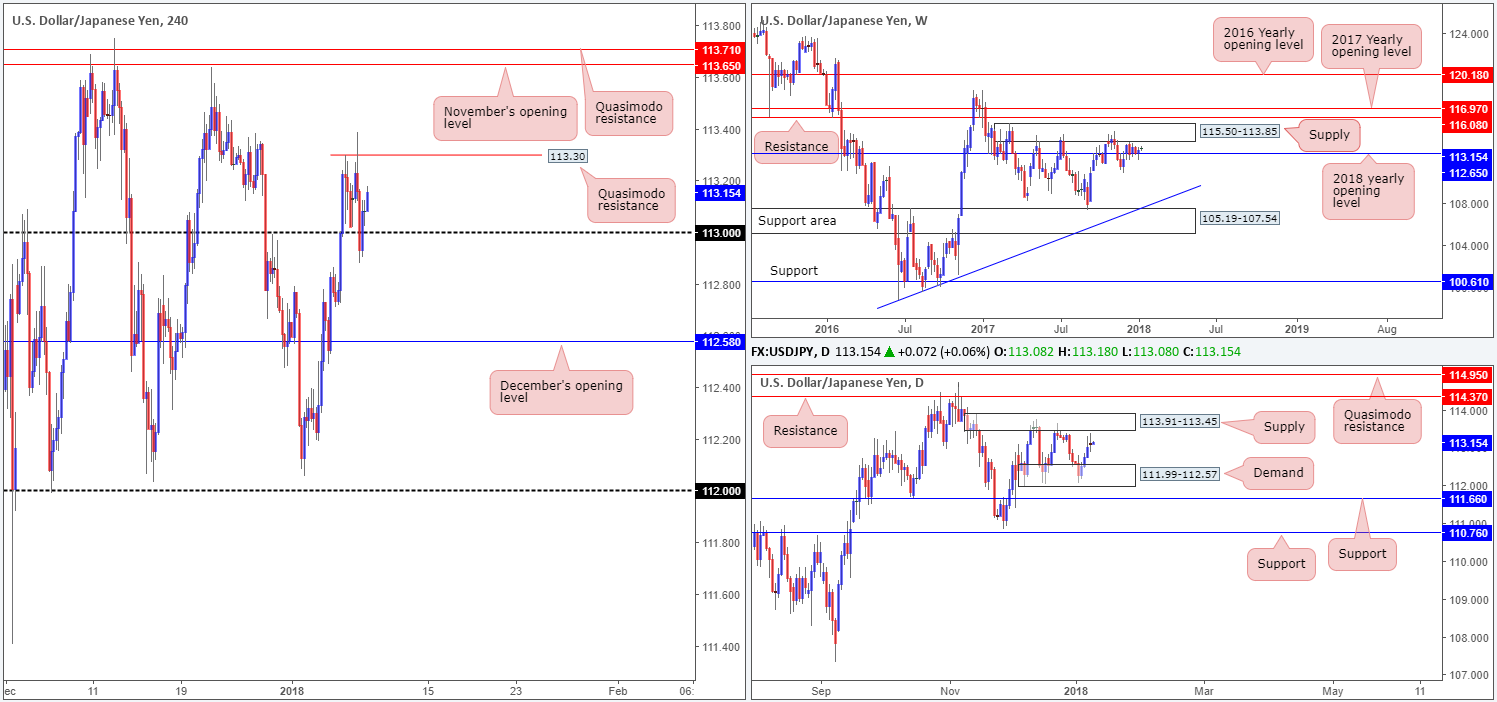
As is evident from the weekly timeframe, the USD/JPY recently found support above the 2018 yearly opening level at 112.65. Upside from here, however, is somewhat limited as there’s a notable weekly supply seen just above at 115.50-113.85. Down on the daily timeframe, price has been range bound since early December 2017 between daily supply coming in at 113.91-113.45 and a daily demand pegged at 111.99-112.57. Also worthy of note is Monday’s indecision candle.
Across on the H4 timeframe, the 113 handle held firm as we entered into Monday’s US segment, despite suffering a break to lows of 112.88. Local resistance can be seen at 113.30 in the form of a Quasimodo level. Beyond this line, we do not see much on the radar until November’s opening level at 113.65.
Market direction:
With limited direction seen on the bigger picture right now, and little technical confluence seen on the H4 timeframe, this may be a market best left on the back burner for the time being.
Data points to consider: No high-impacting news events on the docket.
Areas worthy of attention:
Supports: 113 handle; 112.65; 111.99-112.57.
Resistances: 113.30; 113.65; 115.50-113.85; 113.91-113.45.
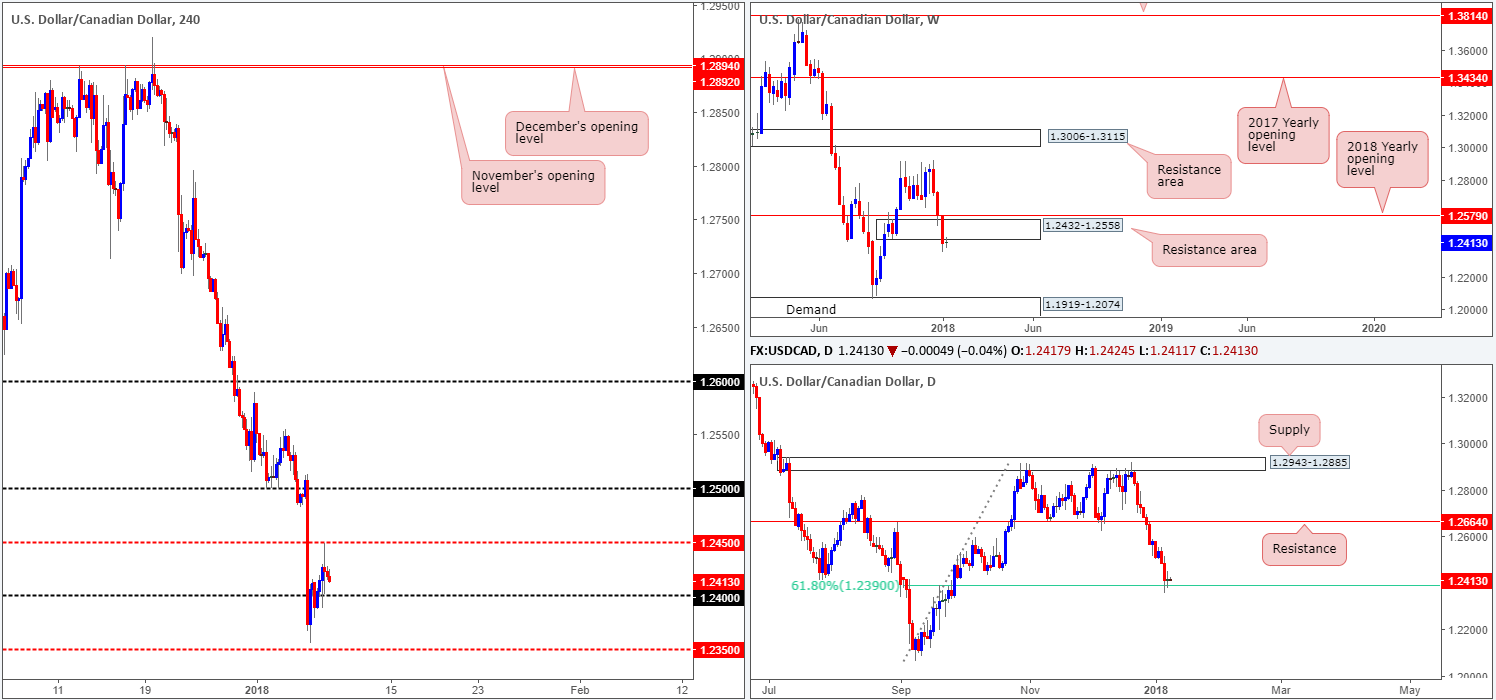
USD/CAD:
Using a top-down approach, the weekly candles reveal that demand drawn from 1.2432-1.2558 was engulfed last week, and is presently being retested as a resistance zone. In the event that the underside of this area establishes firm resistance, further downside to weekly demand at 1.1919-1.2074 is possible on this scale.
Contrary to weekly structure, however, daily price is seen launching a support from around the 1.2390 area: a 61.8% daily Fib support. As of yet though, there has been little bullish intent registered from this zone – yesterday’s action printed a clear-cut indecision candle.
As you can see, broad-based dollar strength allowed H4 price to reclaim the 1.24 handle on Monday and spike north to 1.2448, allowing the pair to start recovering last week’s aggressive loss.
Market direction:
Entering into a long position is not a trade we would label high probability for a number of reasons. Not only would it entail buying into strong selling momentum, it would also involve buying into the underside of a potential weekly resistance area. While we would agree that the bears do appear to have the upper hand right now, it would also be a risky move to sell, in our opinion. With the 1.24 handle seen prowling nearby and support forming off of the daily 61.8% Fib support mentioned above at 1.2390, we would not be comfortable taking a short at this time.
Therefore, opting to remain on the sidelines may very well be the better path to take today.
Data points to consider: No high-impacting news events on the docket.
Areas worthy of attention:
Supports: 1.24 handle; 1.2390; 1.1919-1.2074.
Resistances: 1.2450; 1.2432-1.2558.
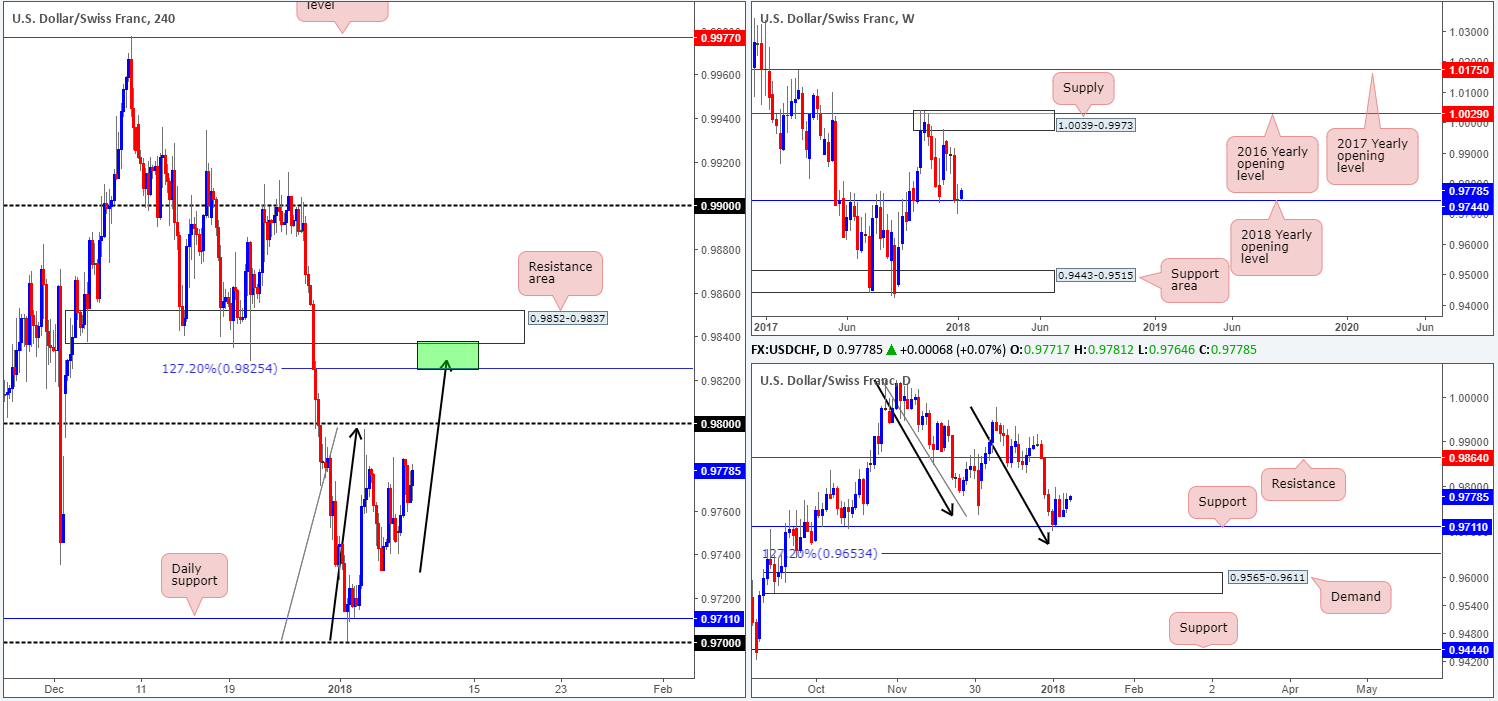
USD/CHF:
The US dollar started the week on a positive note, establishing support above the 92.00 neighborhood. The USD/CHF is also finding support from the 2018 yearly opening level seen on the weekly timeframe at 0.9744. According to the weekly scale, upside is reasonably free until the weekly supply zone painted at 1.0039-0.9973. In addition to this, daily support at 0.9711 is holding beautifully at the moment, with the prospect of reaching daily resistance at 0.9864.
Over on the H4 timeframe, the 0.98 handle is seen just ahead of current price. A violation of this level would place a H4 AB=CD (see black arrows) 127.2% completion point in view at 0.9825. Supporting this area is a H4 resistance zone coming in just above it at 0.9852-0.9837 (possible sell zone marked with a green rectangle).
Market direction:
The only grumble with selling at the noted green H4 zone is the fact that there is little higher-timeframe resistance bolstering the area. Directly above the H4 resistance area sits the aforementioned daily resistance level, which could potentially encourage a fakeout, so trade carefully. An ideal trade scenario, technically speaking, would be for H4 price to chalk up a selling wick that penetrates the upper edge of the said H4 resistance and connects with the daily resistance. However, do keep in mind that although the trade would then have daily resistance backing it, weekly price still shows room to extend beyond this region!
Data points to consider: No high-impacting news events on the docket.
Areas worthy of attention:
Supports: 0.9744; 0.9711.
Resistances: 0.98 handle; 0.9825; 0.9852-0.9837; 0.9864; 1.0039-0.9973.
DOW 30:
2018 has so far been a positive one for the DJIA, up 2.33%. Registering a fresh record high of 25311 on Monday, the index would need to crack through both the AB=CD 161.8% H4 Fib ext. at 25339 and H4 channel resistance extended from the high 24535 to continue punching higher. Before this happens, nevertheless, traders need to be prepared for the possibility of a pullback to a minor H4 demand base coming in at 25068-25105. Beyond this area, there’s little stopping the market from dropping down to challenge the daily demand at 24719-24871, which houses the 2018 yearly opening level at 24809.
Market direction:
Although the trend remains strong, this is not a buyers’ market right now, in our view. Once/if H4 price engulfs both the H4 channel resistance and the H4 AB=CD formation, then we do not see much stopping prices from moving higher, at least from a technical standpoint.
Buying on a dip seen down to the current minor H4 demand is also a possibility. However, there is a strong chance that this area could fail given that daily action may want to test the demand seen below it at 24719-24871.
Data points to consider: No high-impacting news events on the docket.

Areas worthy of attention:
Supports: 25068-25105; 24719-24871; 24809.
Resistances: 25339; H4 channel resistance.
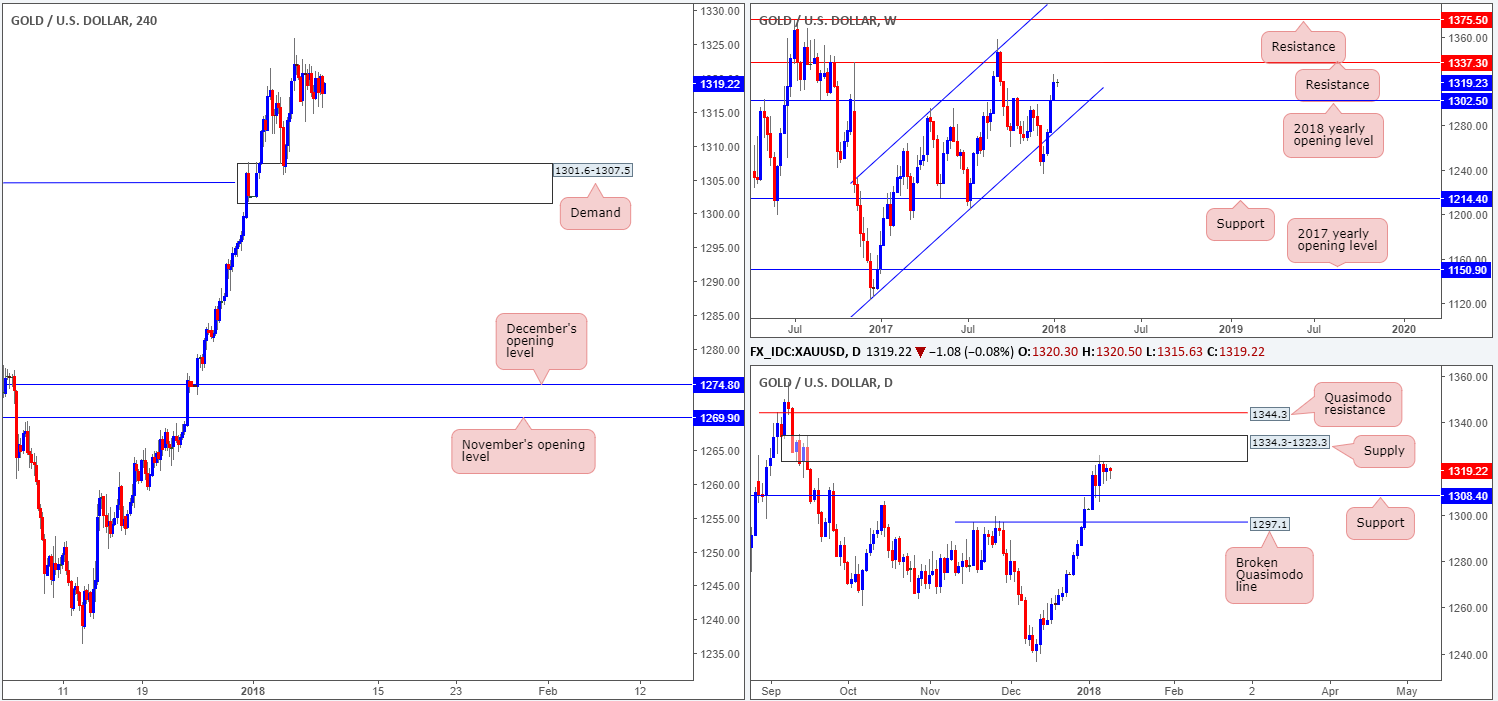
GOLD:
Gold prices, once again, took on more of a subdued tone on Monday, despite the US dollar printing a healthy advance. Ranging a little over $7, the yellow metal remains capped around the underside of a daily supply at 1334.3-1323.3, and has been since the 4th January. Why are the bears finding it difficult to pursue lower prices from here? Could it be the fact that weekly price displays room to advance as far north as the weekly resistance level coming in at 1337.3, or the threat of daily support lurking nearby at 1308.4?
Market direction:
The H4 demand area seen at 1301.6-1307.5 warrants attention, due to it being formed on the break of a H4 Quasimodo resistance logged at 1304.4 as well as housing both the daily support mentioned above at 1308.4, and the 2018 yearly opening level marked on the weekly timeframe at 1302.5. With weekly price showing promise at least until 1337.3, a long from the noted H4 demand could be an option. Yes, by entering into a buy trade from here, you’d effectively be buying from daily sellers. However, given the fact that the H4 zone is reinforced by a daily support, the odds of a rotation from the H4 demand area is high, in our opinion. In regard to near-term take-profit targets, it is difficult to judge since H4 price has yet to complete its approach.
Areas worthy of attention:
Supports: 1301.6-1307.5; 1302.5; 1308.4.
Resistances: 1337.3; 1334.3-1323.3.


