EUR/USD:
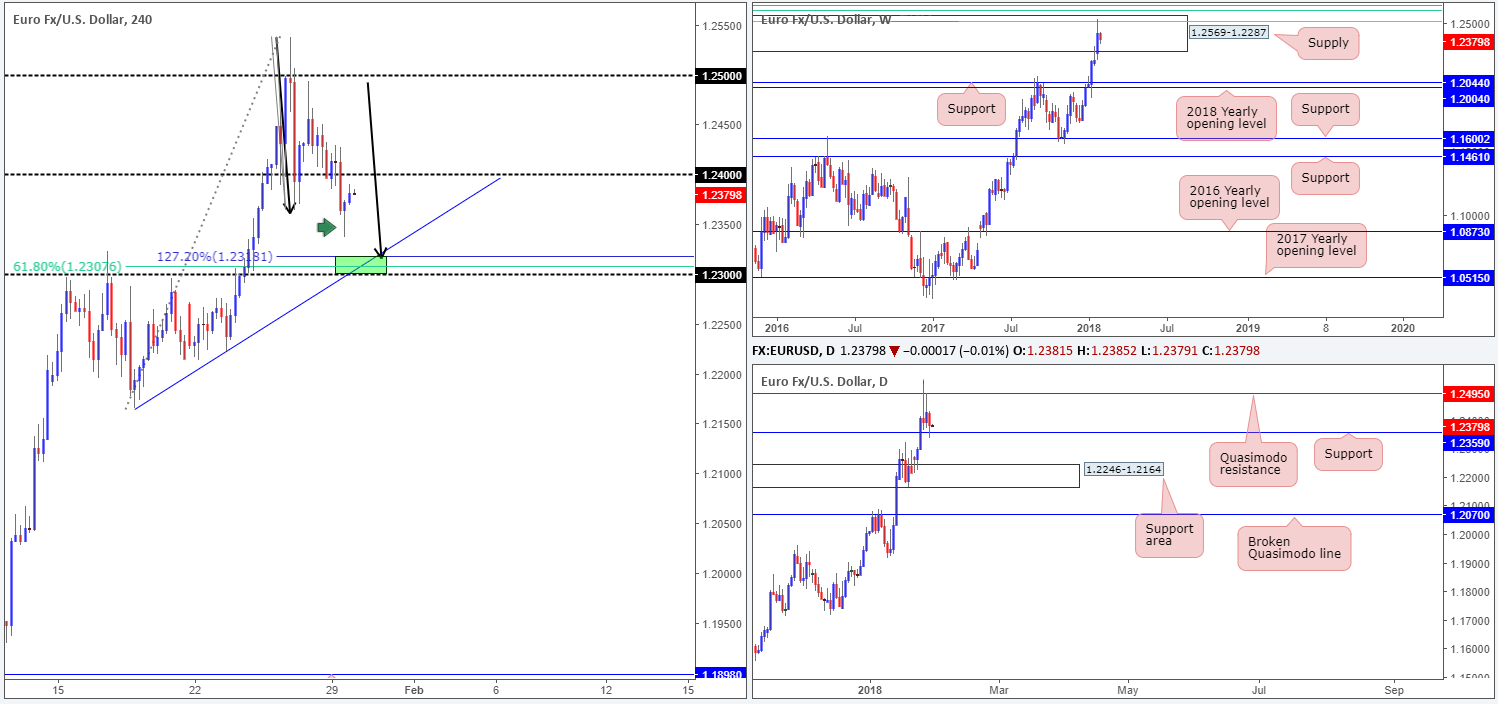
Looking at the weekly timeframe, it can clearly be seen that sellers are establishing some ground within the walls of a weekly supply at 1.2569-1.2287. What’s also prominent here is the Fibonacci cluster seen circling around the top edge of this zone (green lines):
- 61.8% Fib resistance at 1.2604 taken from the high 1.3993.
- 50.0% Fib resistance at 1.2644 taken from the high 1.4940.
- 38.2% Fib resistance at 1.2519 taken from the high 1.6038.
Moving things down a notch, daily action shows us that price recently came into contact with a daily support band at 1.2359, after fading a daily Quasimodo resistance located at 1.2495. A violation of 1.2359 could lead to a move being seen down to a daily support area coming in at 1.2246-1.2164.
Over on the H4 timeframe, the 1.24 handle suffered a breach during yesterday’s London (morning) segment, clearing the path south down to the aforementioned daily support. Note here that H4 price formed a rather nice-looking H4 buying tail (green arrow) off the noted daily support.
Market direction:
Despite daily support elbowing its way into the spotlight yesterday, we feel the unit wants lower prices. This is largely due to the weekly supply area currently in play.
Therefore, selling opportunities may be a possibly on any retest seen at 1.24 today. A bounce lower from this angle has the 1.23 handle to target. This move will also complete a H4 AB=CD pattern (black arrows) that terminates around the 127.2% Fib ext. point at 1.2318, which, as you can see, converges closely with a H4 61.8% Fib support at 1.2307 and a H4 trendline support drawn from the low 1.2165. Thus, not only is 1.23 a valid target for shorts, it’s also a reasonably structured area to hunt for a bounce north. How much of a bounce, though, is difficult to judge since let’s remember that this area is positioned within weekly supply!
Data points to consider: German prelim CPI m/m; Spanish flash GDP q/q at 8am; Euro prelim flash GDP q/q at 10am; US CB consumer confidence at 3pm GMT.
Areas worthy of attention:
Supports: 1.23 handle; 1.2318; 1.2307; H4 trendline support; 1.2359; 1.2246-1.2164.
Resistances: 1.2569-1.2287; Weekly Fib cluster (see above); 1.2495; 1.24 handle.
GBP/USD:
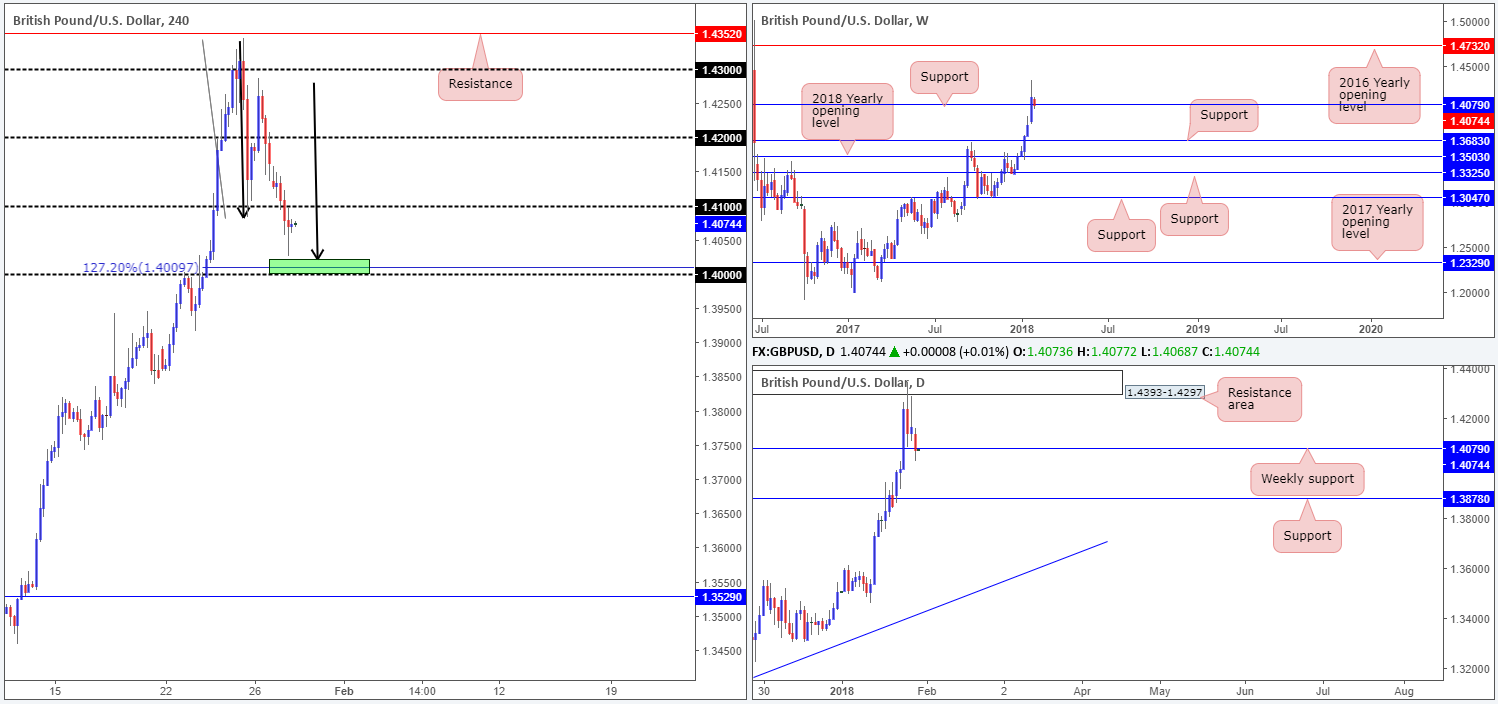
The British pound, as you can see, continued to press lower on Monday, consequently forcing higher-timeframe price marginally back below weekly support seen at 1.4079. Providing that sellers maintain a position beneath this number, the next downside target on the bigger picture can be seen at 1.3878: a daily support level.
Across on the H4 timeframe, we can see that the recent bout of selling erased the 1.41 handle and reached a session low of 1.4025. As is evident from the chart, price also missed the top edge of a potential buy zone (marked in green) which comprised of a H4 AB=CD formation (black arrows) that terminates around the 127.2% Fib ext. point at 1.4009, and the large psychological number 1.40.
Market direction:
While the 1.40 region is still a valid buy zone we believe, the daily close beyond weekly support, albeit marginal, could be considered a bearish cue. Furthermore, a mild fakeout is likely to be seen through 1.40 as this is common around psychological bands. Therefore (as highlighted in Monday’s report), try to avoid entering based on a pending order. Instead, wait and assess the H4 candle reaction from 1.40 before pulling the trigger. A solid full or near-full-bodied H4 bull candle from here would, in our view, be enough to suggest buyer intent.
Data points to consider: UK net lending to individuals m/m at 9.30am; BoE Gov. Carney speaks at 3.30pm; US CB consumer confidence at 3pm GMT.
Areas worthy of attention:
Supports: 1.4079; 1.4009; 1.40 handle.
Resistances: 1.4393-1.4297; 1.41 handle.
AUD/USD:
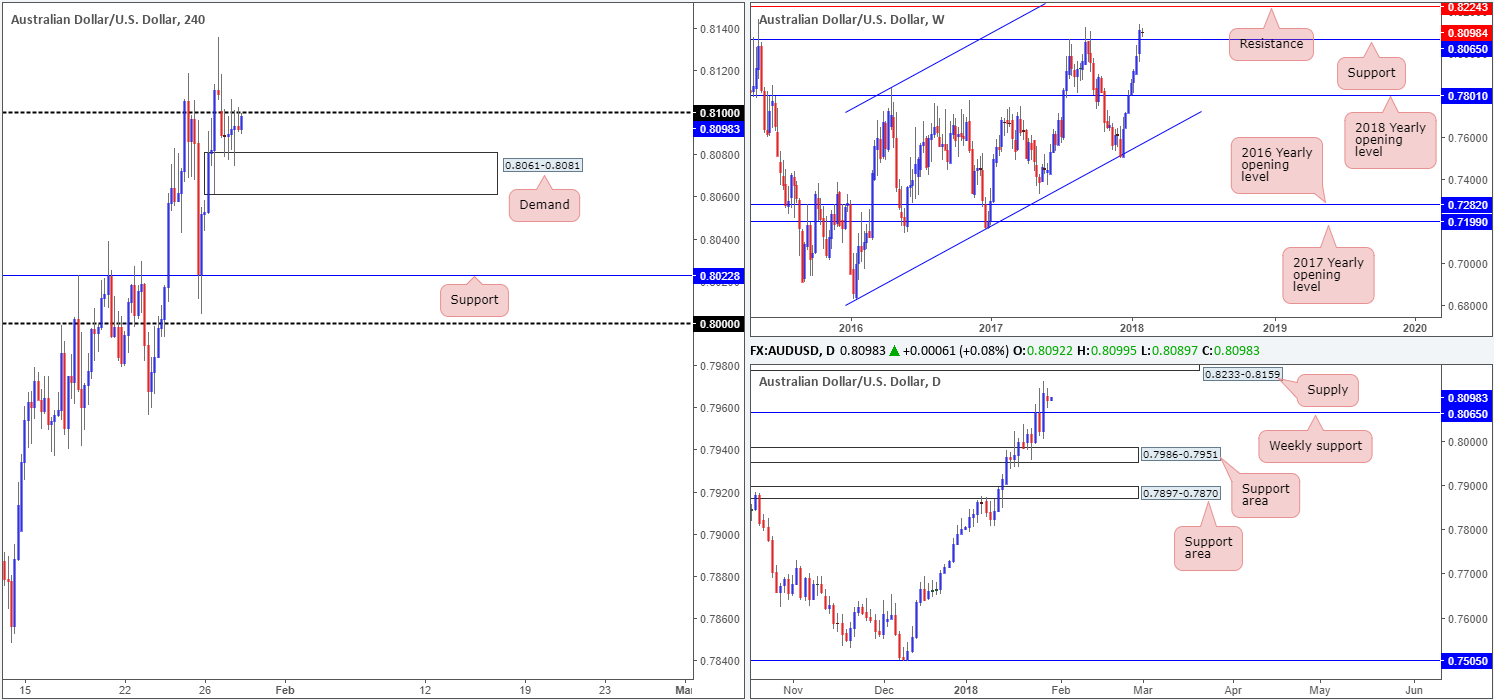
The AUD/USD market took on more of a subdued tone on Monday, loitering not far from its multi-year high clocked on Friday.
As you can see, H4 movement printed back-to-back indecision candles between a H4 demand area at 0.8061-0.8081 and the 0.81 handle on Monday. The important thing to note here, however, is that within the lower limits of the H4 demand a weekly support level drawn from 0.8065 is seen.
Last week’s action saw weekly price break through weekly resistance at 0.8065 (now acting support) and possibly open the stage for a continuation move up to weekly resistance penciled in at 0.8224. Zooming in for a closer look on the daily timeframe, we can see that the break of weekly resistance mentioned above at 0.8065 has placed a daily supply zone formed back in early Jan 2015 (proved valid in May 2015) at 0.8233-0.8159 (houses the weekly resistance at 0.8224 within) on the hit list.
Market direction:
Although this market is certainly due a correction, selling is not something we would label a high-probability move right now. Not only does one have the H4 demand to contend with, there’s also the weekly support mentioned above at 0.8065.
While a sell is out of the question, in our opinion, a buy is also somewhat tricky given how close the daily supply at 0.8233-0.8159 (houses the weekly resistance at 0.8224 within) is positioned!
Data points to consider: US CB consumer confidence at 3pm GMT.
Areas worthy of attention:
Supports: 0.8061-0.8081; 0.8065.
Resistances: 0.8224; 0.8233-0.8159.
USD/JPY:
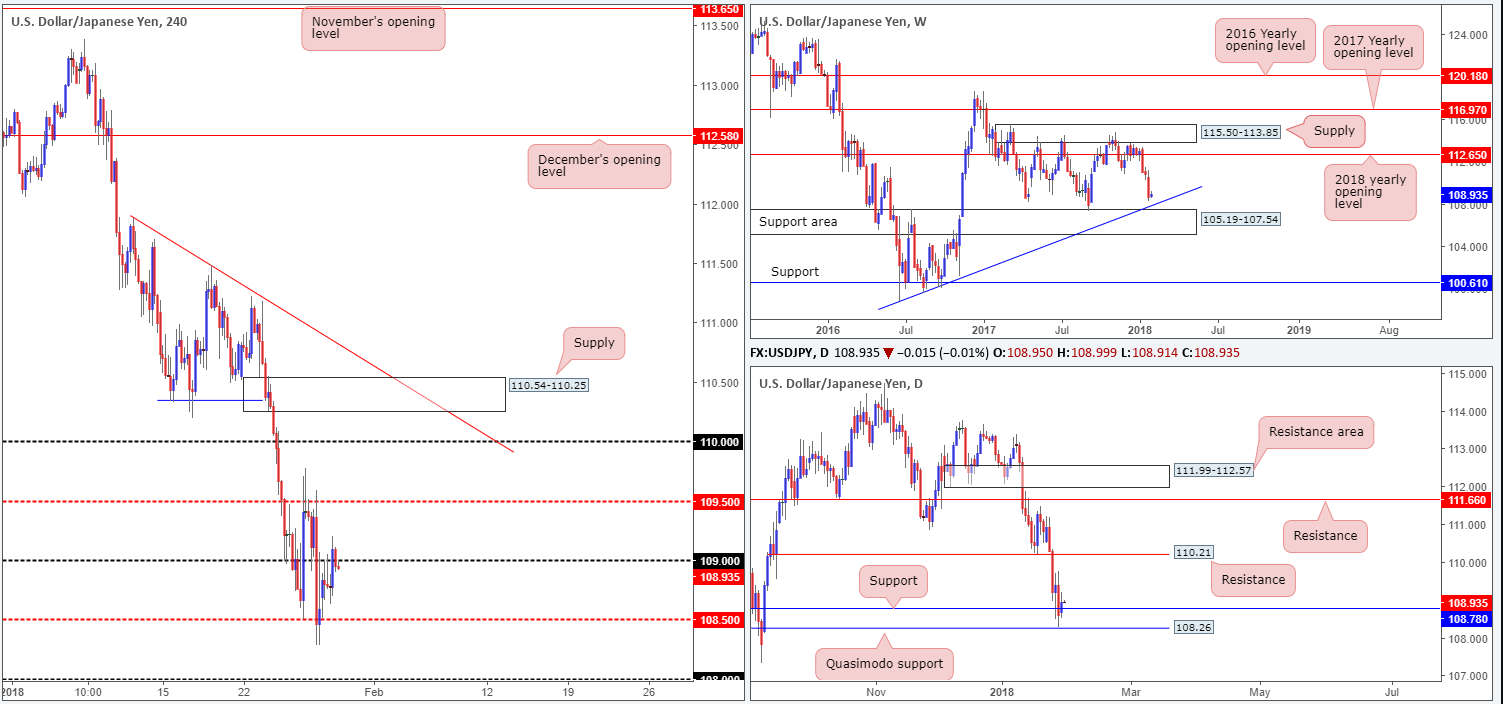
During the course of Monday’s segment, the USD/JPY managed to edge higher and print a daily close above daily resistance at 108.78 (now acting support). We highlighted in yesterday’s report that in order to confirm a bullish reversal from the daily Quasimodo support seen at 108.26, a DECISIVE daily close above 108.78 would be required. While a close has been seen, it is not convincing enough, in our book.
In addition to the above, H4 price failed to sustain gains above the 109 handle and weekly price shows space to stretch down to a weekly trendline support taken from the low 98.78, followed closely by a weekly support area at 105.19-107.54.
Market direction:
Despite the bullish close above daily resistance, we feel there’s still a bearish vibe present in this market. With that being said, however, selling appears just as challenging as buying! Selling into the current daily support and then the daily Quasimodo, followed by the top edge of a weekly support area/weekly trendline support, is not a trade with high odds, in our opinion, despite a down trending market.
In view of the above structure, opting to stand on the sidelines could be the better path to take today.
Data points to consider: US CB consumer confidence at 3pm GMT.
Areas worthy of attention:
Supports: 108.50; 108.26; 108.78; Weekly trendline support; 105.19-107.54.
Resistances: 109 handle.
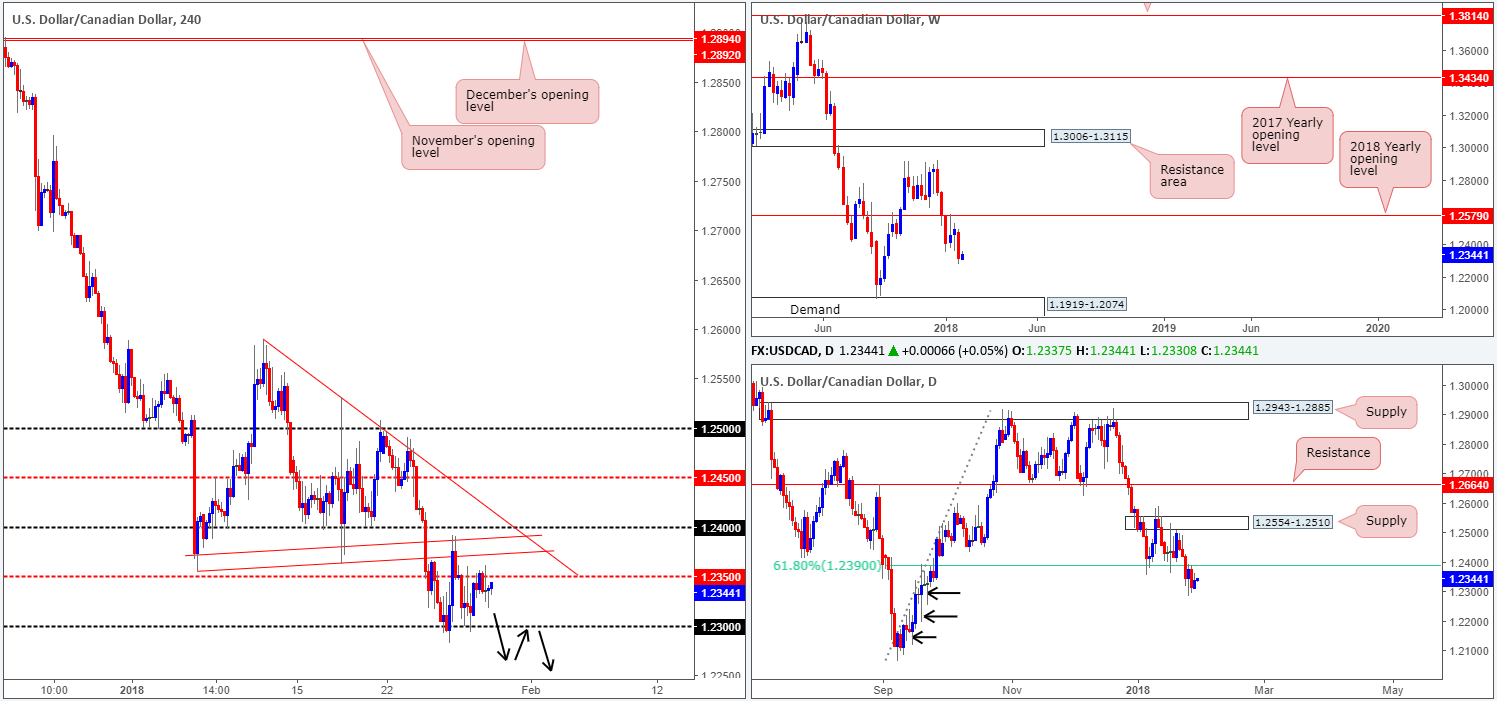
USD/CAD:
Price took on more of a sober tone on Monday, as the unit lingered beneath a H4 mid-level resistance at 1.2350. In light of this somewhat lackluster performance, much of the following report will echo thoughts put forward in yesterday’s analysis…
After spending two weeks consolidating below the 2018 yearly opening level on the weekly timeframe at 1.2579, the sellers finally cranked it up a gear and moved lower last week. With little weekly support in sight until we reach the weekly demand base at 1.1919-1.2074, further selling in the coming weeks is a real possibility.
Daily price, as you can see, remains below 1.2390: a daily 61.8% Fib support-turned resistance. Below 1.2390 there’s little support worthy of mention, in our opinion. Note the clear daily buying tails marked with black arrows at 1.2253, 1.2194 and 1.2118. These, to us, resemble consumption of unfilled buy orders.
Market direction:
To the upside, above 1.2350, movement is somewhat restricted, given a H4 trendline resistance extended from the low 1.2355 and the 1.24 handle. Should 1.2350 hold ground today, on the other hand, we may see the 1.23 handle brought into the fray. The next downside objective beyond this number can be seen at 1.2236: a H4 Quasimodo support.
Our bias, at least medium/long term, remains short. This is largely because of where price is located on the bigger picture. A H4 close beneath 1.23 would, in our view, further confirm this bearish bias and open up the possibility for a short trade. However, we would not label a breakout as a high-probability setup as they have a tendency to recoil. Instead, consider waiting for the H4 close to form and look to then trade any (successful) retest of 1.23 thereafter (as per the black arrows), targeting the noted H4 Quasimodo support at 1.2236 as an initial take-profit zone.
Data points to consider: US CB consumer confidence at 3pm GMT.
Areas worthy of attention:
Supports: 1.23 handle; 1.2236; 1.1919-1.2074.
Resistances: 1.2350; 1.24 handle; H4 trendline resistance; 1.2390.
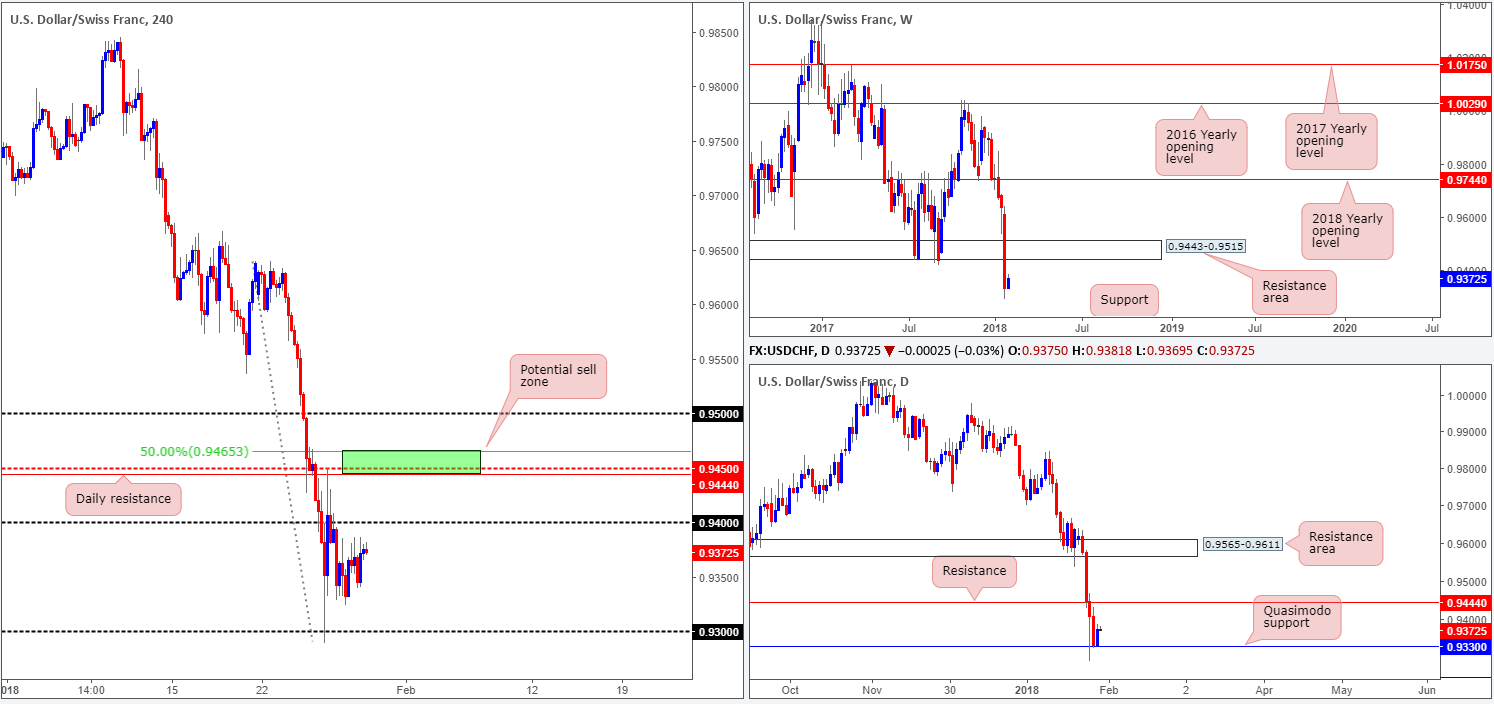
USD/CHF:
Despite a huge influx of selling last week, the Swissie managed to print a daily recovery candle from a daily Quasimodo barrier at 0.9330 on Monday. This could encourage short sellers to begin covering their positions, and eventually bring daily price up to a daily resistance level drawn from 0.9444 (note that this level also represents the underside of a weekly resistance area at 0.9443-0.9515). In order for the USD/CHF to probe higher, though, offers around the 0.94 handle seen on the H4 timeframe will need to be consumed.
Market direction:
Instead of looking to buy this market above 0.94, waiting for price to strike 0.9465/0.9444 on the H4 timeframe (green zone) might be a better option. This area not only holds the underside of a weekly resistance base at 0.9443, it is also comprised of a daily resistance at 0.9444, a H4 mid-level resistance at 0.9450 and a H4 50.0% resistance value at 0.9465 taken from the high 0.9640. This area, in our technical opinion, is worthy of consideration for potential sell trades. Waiting for additional candle confirmation is also something to consider, since this will help avoid any whipsaw seen through the area up to the 0.95 region.
Data points to consider: US CB consumer confidence at 3pm; KOF economic barometer at 8am GMT.
Areas worthy of attention:
Supports: 0.93 handle; 0.9330; 0.9233; 0.9163.
Resistances: 0.94 handle; 0.9444; 0.9450; 0.9465; 0.9443-0.9515.
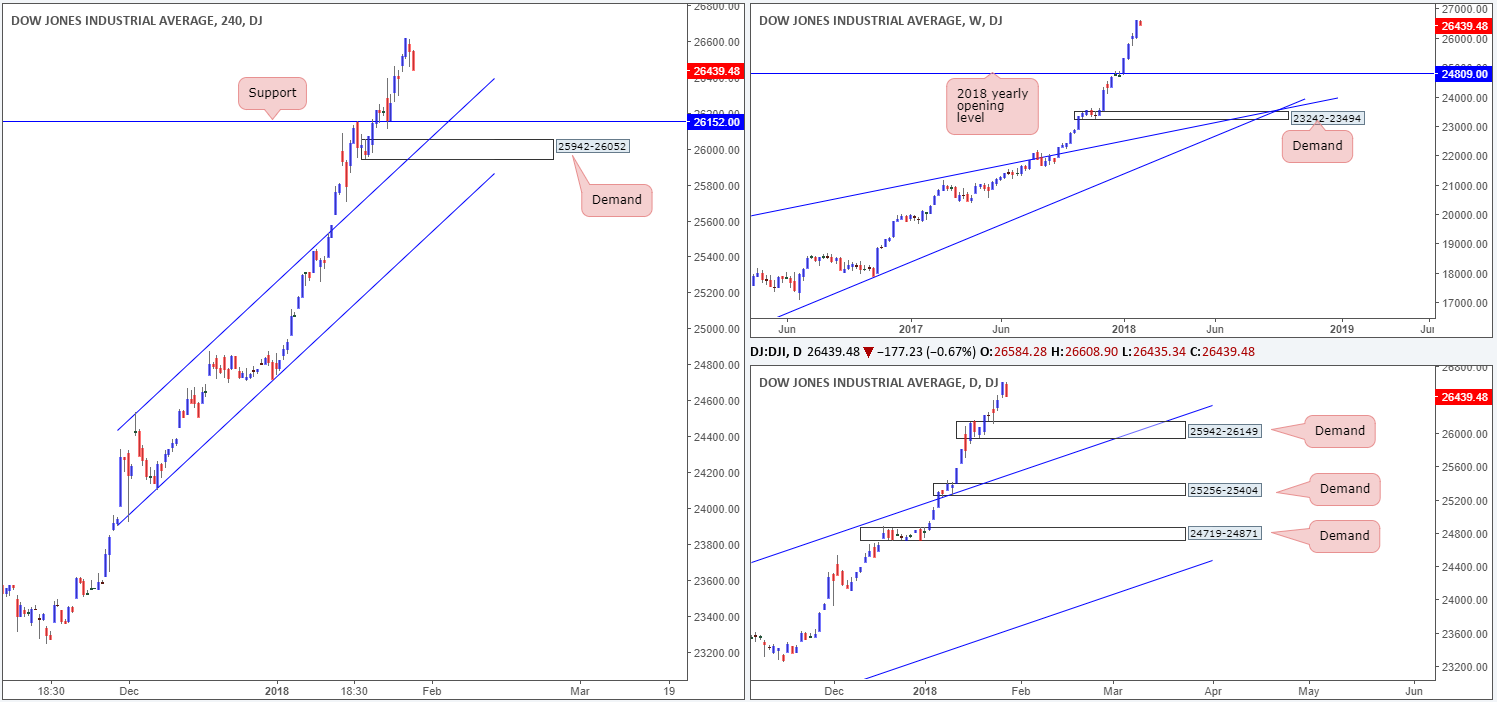
DOW 30:
In recent trading, Wall Street reclaimed Friday’s gains and formed a near-full-bodied daily bearish candle in the process.
Technical readings on the H4 timeframe indicate that further selling could be on the cards today/this week until we shake hands with H4 support at 26152 (converges nicely with a H4 channel resistance-turned support taken from the high 24535 and is located just ahead of a H4 demand at 25942-26052). What’s also interesting here is that these areas are further reinforced by a daily demand area drawn from 25942-26149 (the next downside support target on the daily timeframe).
Market direction:
Due to the strength of yesterday’s close, further downside could be in store before buyers look to bid this market higher.
Near term, we have our eye on the aforementioned H4 support/H4 demand. These areas – coupled with a surrounding daily demand mentioned above at 25942-26149 – will likely provide a stable platform to entice buyers back into the market.
Data points to consider: US CB consumer confidence at 3pm GMT.
Areas worthy of attention:
Supports: 26152; 25942-26052; H4 channel support; 25942-26149.
Resistances: …
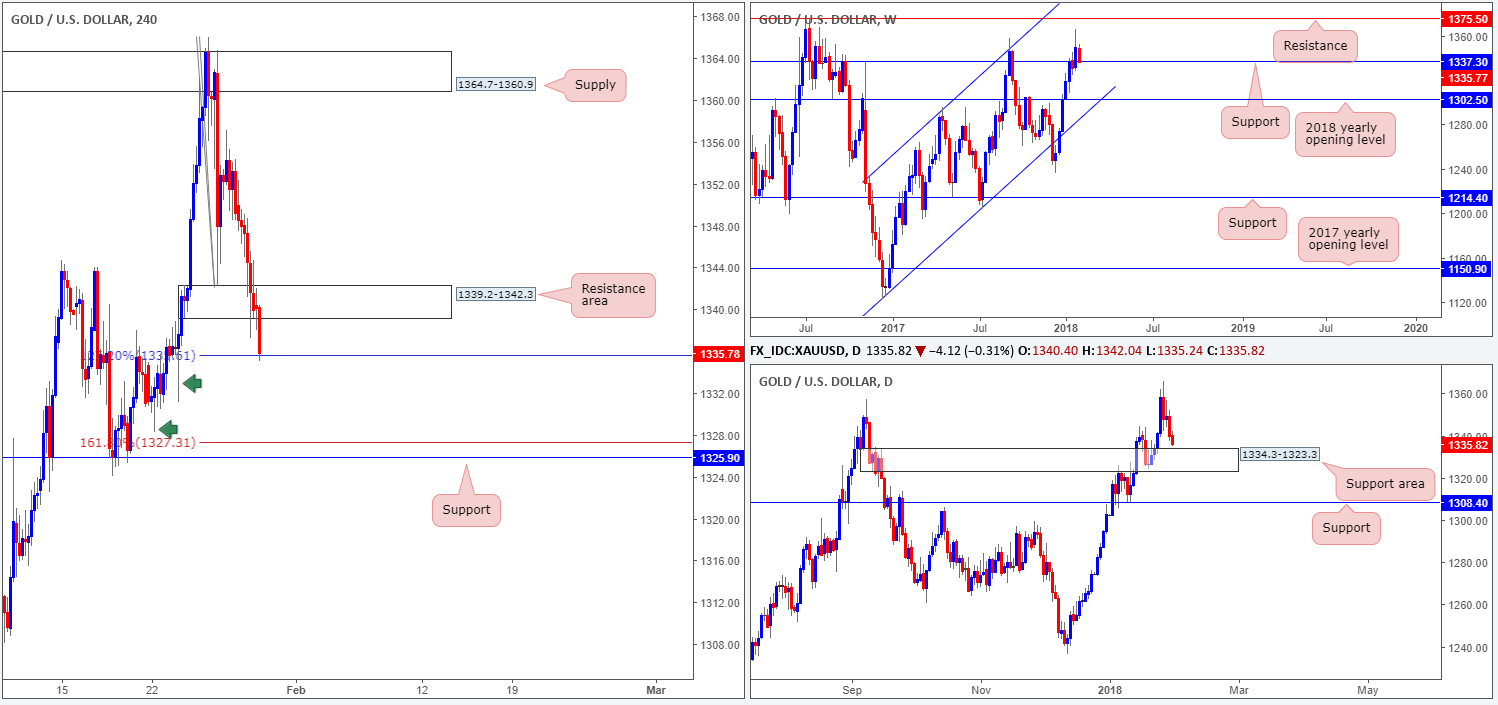
GOLD:
As the US dollar is seen establishing some ground, the price of gold continued to deteriorate on Monday. In recent hours, we’ve seen H4 price chew through a H4 demand area at 1339.2-1342.3 (now acting resistance zone), and connect with a H4 127.2% Fib ext. point at 1335.6. Considering that this line is positioned directly above a daily support area at 1334.3-1323.3, and located nearby weekly support at 1337.3, buying could be seen from this angle.
On the other hand, should the H4 127.2% Fib ext. fail to hold, the next downside target on the H4 scale can be seen at 1327.3/1325.9: a 161.8% Fib ext. point/H4 support. The green arrows denote consumption tails, which we believe has likely cleared downside.
Market direction:
Buying from current price, although tempting due to higher-timeframe structure, is somewhat precarious. We say this simply because of the nearby H4 resistance area at 1339.2-1342.3. Therefore, in order to prove buyer intent here, we would need to see a decisive push back above the H4 resistance zone.
Areas worthy of attention:
Supports: 1335.6; 1327.3; 1325.9; 1337.3; 1334.3-1323.3.
Resistances: 1339.2-1342.3.
This site has been designed for informational and educational purposes only and does not constitute an offer to sell nor a solicitation of an offer to buy any products which may be referenced upon the site. The services and information provided through this site are for personal, non-commercial, educational use and display. IC Markets does not provide personal trading advice through this site and does not represent that the products or services discussed are suitable for any trader. Traders are advised not to rely on any information contained in the site in the process of making a fully informed decision.
This site may include market analysis. All ideas, opinions, and/or forecasts, expressed or implied herein, information, charts or examples contained in the lessons, are for informational and educational purposes only and should not be construed as a recommendation to invest, trade, and/or speculate in the markets. Any trades, and/or speculations made in light of the ideas, opinions, and/or forecasts, expressed or implied herein, are committed at your own risk, financial or otherwise.
The use of the site is agreement that the site is for informational and educational purposes only and does not constitute advice in any form in the furtherance of any trade or trading decisions.
The accuracy, completeness and timeliness of the information contained on this site cannot be guaranteed. IC Markets does not warranty, guarantee or make any representations, or assume any liability with regard to financial results based on the use of the information in the site.
News, views, opinions, recommendations and other information obtained from sources outside of www.icmarkets.com.au, used in this site are believed to be reliable, but we cannot guarantee their accuracy or completeness. All such information is subject to change at any time without notice. IC Markets assumes no responsibility for the content of any linked site. The fact that such links may exist does not indicate approval or endorsement of any material contained on any linked site.
IC Markets is not liable for any harm caused by the transmission, through accessing the services or information on this site, of a computer virus, or other computer code or programming device that might be used to access, delete, damage, disable, disrupt or otherwise impede in any manner, the operation of the site or of any user’s software, hardware, data or property.


