Lower timeframe confirmation: is something we use a lot in our analysis. All it simply means is waiting for price action on the lower timeframes to confirm direction within a higher timeframe area. For example, some traders will not enter a trade until an opposing supply or demand area has been consumed, while on the other hand, another group of traders may only need a trendline break to confirm direction. As you can probably imagine, the list is endless. We, however, personally prefer to use the two methods of confirmation mentioned above in our trading.
EURUSD:
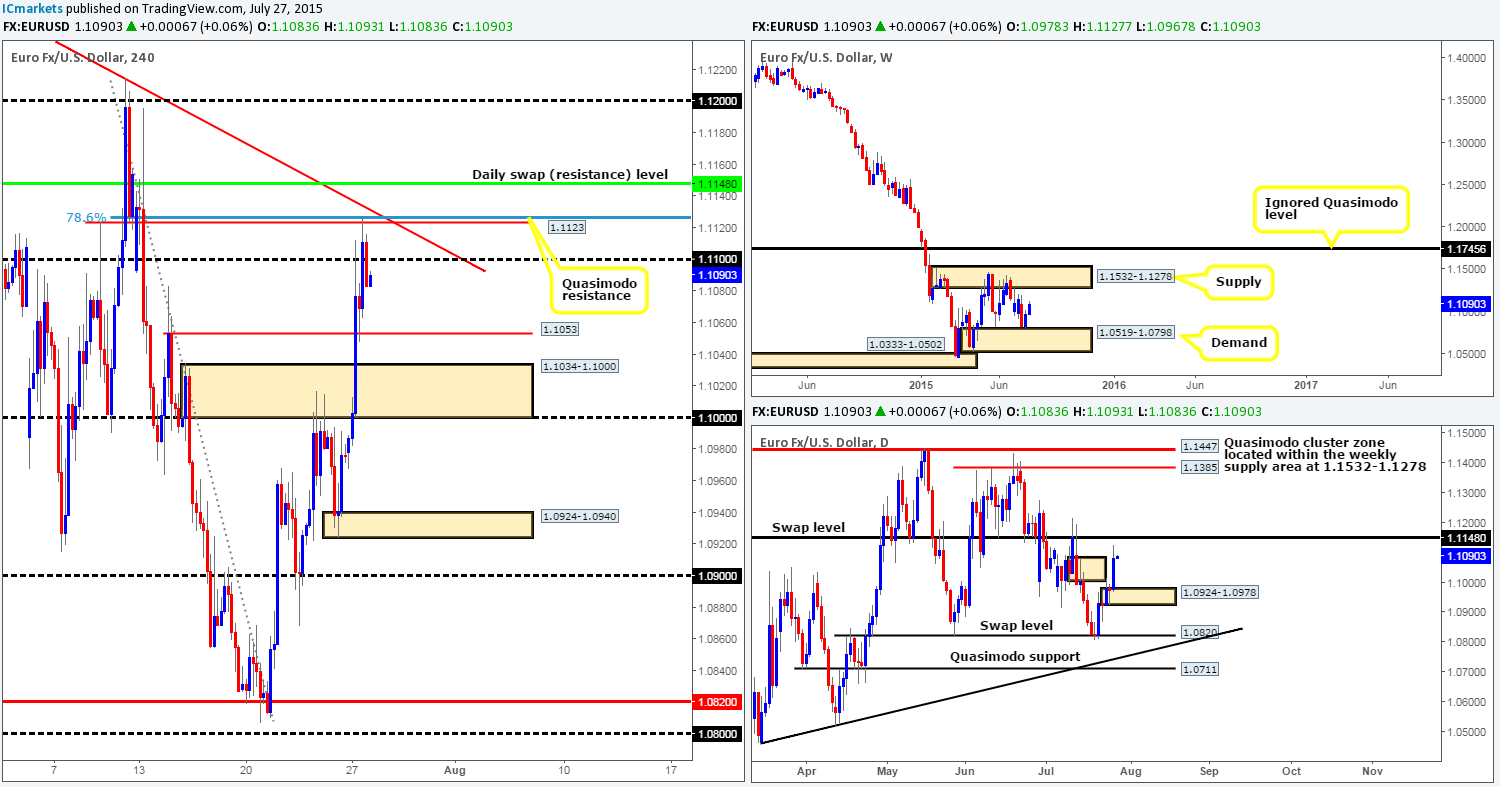
Following the open at 1.0978 the EUR currency saw a strong wave of bids come into the market, erasing both the 4hr supply area at 1.1034-1.1000 and the round number 1.1100, which ended with price being held lower at the 4hr Quasimodo resistance level at 1.1123 (convergence seen here from the 78.6% Fibonacci resistance and also a corresponding 4hr downtrend line from the high 1.1277).
In the bigger picture, we can see that initial rebound from weekly demand at 1.0519-1.0798 has extended higher so far this week, which as you can see by looking on the daily scale, took out the majority of offers around the daily supply area at 1.1083-1.1006, consequently leaving the path north clear up to at least 1.1148 – a daily swap (resistance) level.
Although, the weekly and daily timeframes both suggest buying today, it would not be something we’d consider, since price is currently reacting off of 4hr Quasimodo resistance at the moment. And even with a break above this 4hr resistance barrier, we’re then faced with the daily swap (resistance) level at 1.1148. Therefore, at this point in time our team has come to a general consensus that no buying is to be done until we see a 4hr close above this daily level.
Levels to watch/live orders:
- Buys: Flat (Stop loss: N/A).
- Sells: Flat (Stop loss: N/A).
GBP/USD:
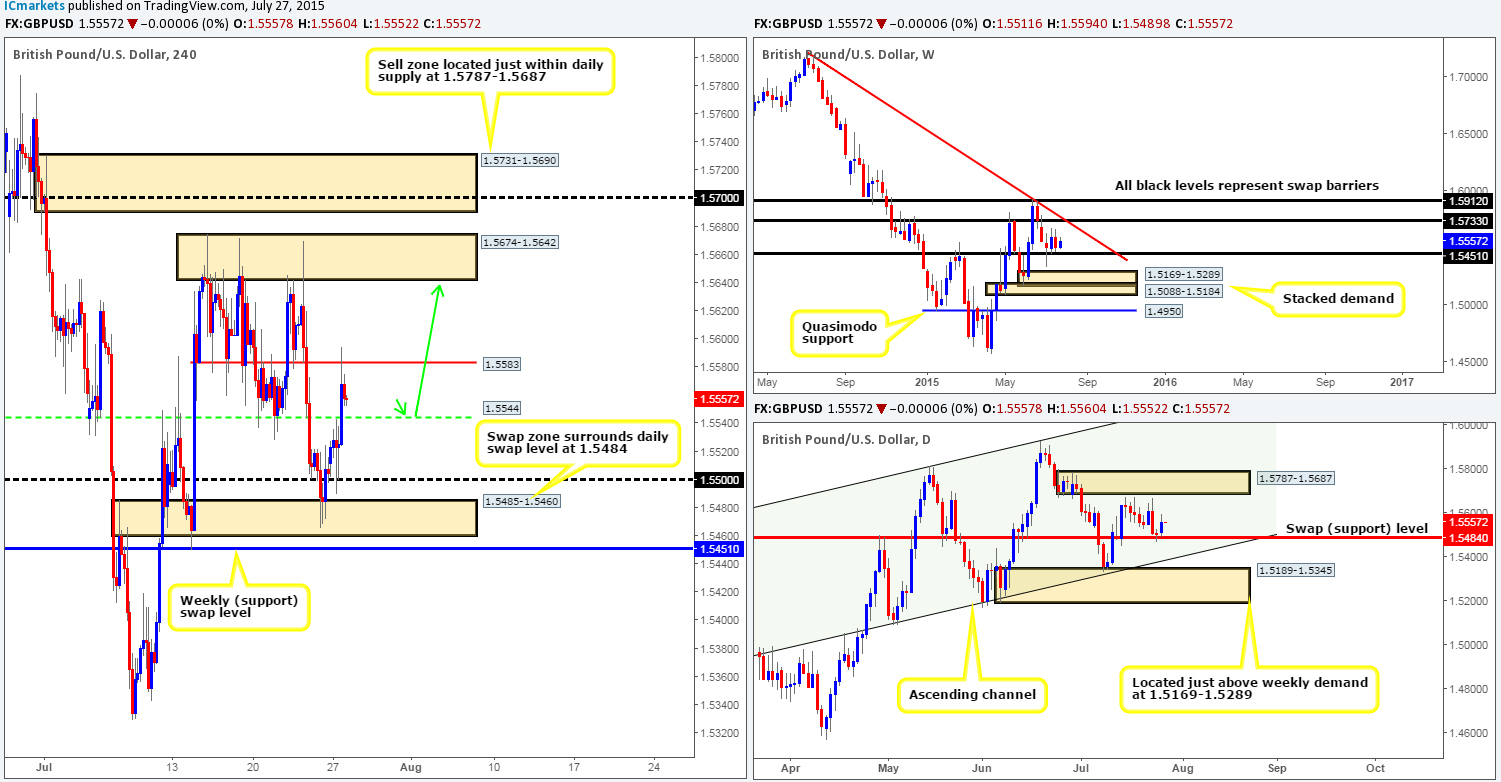
During the course of yesterday’s sessions, Cable retested the 1.5500 handle as support, which, as you can see, was clearly enough to attract buyers into this market. Price exploded north from here breaking above 1.5544 that ended with price hitting and rebounding from the 1.5583 level. The majority of sellers attempting to fade this level were likely stopped out here due to the spike high at 1.5594, thus, as far as we’re concerned, this level is likely weak now.
Unfortunately, we were not around for retest of 1.5500, which is a shame considering that this was a level of interest that we noted in our previous analysis http://www.icmarkets.com/blog/monday-27th-july-weekly-technical-outlook-and-review/, well done to any of our readers who managed to enter long from here. This recent push north from 1.5500 should not really come as much of a surprise since we have both a weekly swap (support) level at 1.5451 and a daily swap (support) level at 1.5484 backing this move!
With the above taken on board, we feel that as long as 1.5544 holds as support today (potential level to look for confirmed longs – green arrows), we believe that this market has potential to move up to the 4hr resistance base at 1.5674-1.5642 today, which is located just below the daily supply area at 1.5787-1.5687 (a nice take-profit target for any long trades taken from 1.5544).
Levels to watch/ live orders:
- Buys: 1.5544 [Tentative – confirmation required] (Stop loss: dependent on where one confirms this level).
- Sells: Flat (Stop loss: N/A)
AUD/USD:
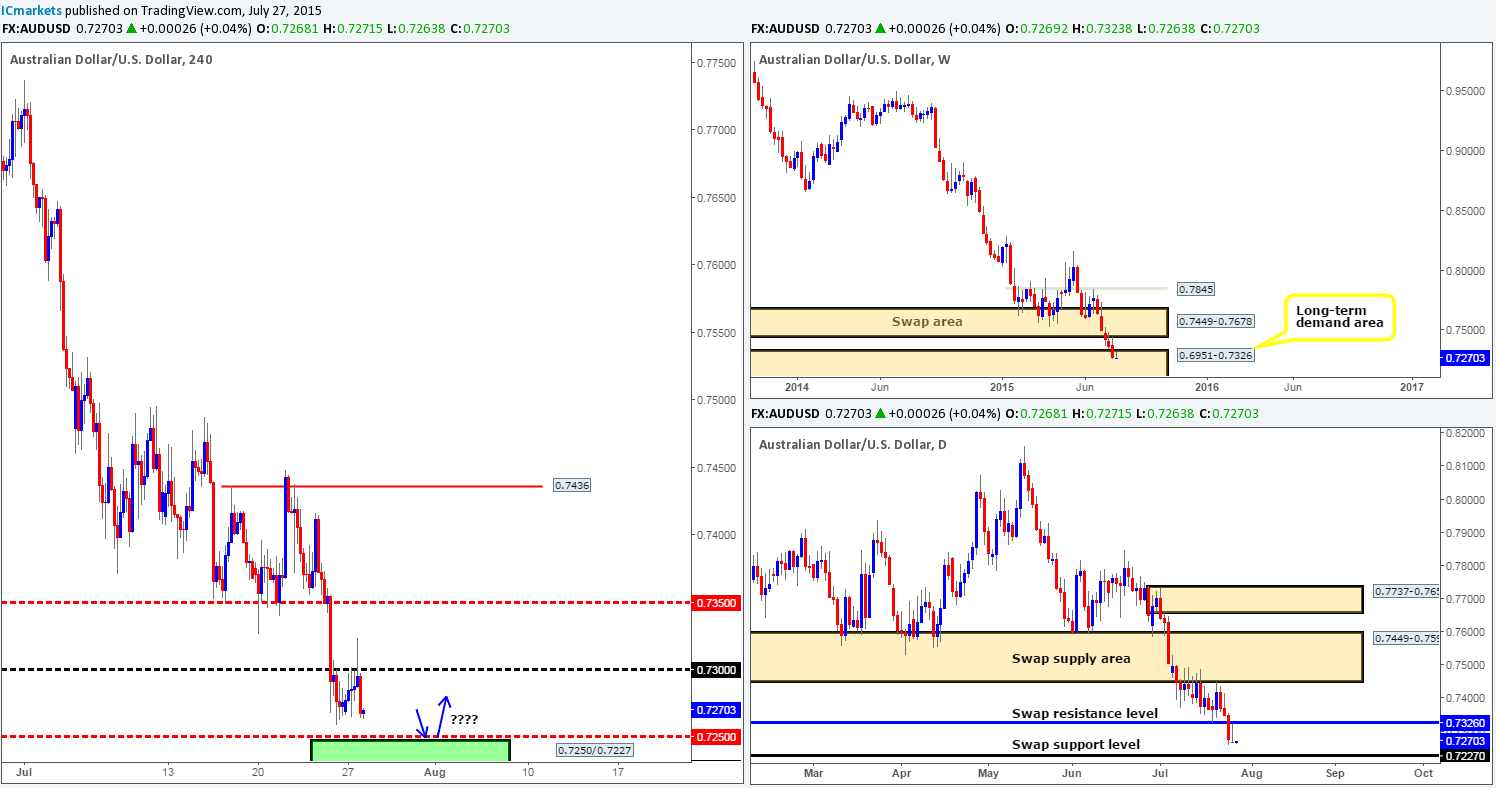
Despite the AUD/USD pair being in quite a severe long-term downtrend at present, price is now trading within a weekly demand zone coming in at 0.6951-0.7326. Regarding the daily timeframe, however, price action printed a nice looking selling tail (pin bar) yesterday which jabbed into the lower limits of a daily swap (resistance) level at 0.7326. Because of this, the path south still remains clear on this timeframe for further selling down to a daily swap (support) level given at 0.7227.
On to the 4hr scale, we can see that yesterday’s action respected the round-number resistance level at 0.7300, which ended with a 4hr bearish pin-bar candle forming going into the U.S. open, forcing price lower into the close 0.7268.
Given the points made above, our analysis remains relatively unchanged from our previous report…
Taking into account that price is now trading within a long-term weekly demand area at 0.6951-0.7326, should we not be looking to buy this pair today? Yes and no would be our answer to this, since the daily timeframe indicates that there is still room for further selling yet down to at least 0.7227 (swap [support] level) which is positioned relatively deep within the aforementioned weekly demand area. Therefore, we should be prepared for this to be seen sometime today. The green rectangle represents a possible buy zone for us between the mid-level number 0.7250 and the daily swap (support) level mentioned above at 0.7227. Some will likely think we may be crazy even considering a buy from here with the AUD/USD pair in such a clear downtrend at present, and they could very well be correct! However, technicals show that there is a POSSIBILITY that price may bounce or even reverse from this zone this week, so we’re willing to give it a chance. An alert has been placed at 0.7255, which if triggered; it will essentially be our cue to begin watching for lower timeframe confirming price action (15/30/60 minute) to enter long. Targets will be dependent on how price approaches our zone of interest.
Levels to watch/ live orders:
- Buys: 0.7250/0.7227 [Tentative – confirmation required] (Stop loss: dependent on where one confirms this zone).
- Sells: Flat (Stop loss: N/A).
USD/JPY:
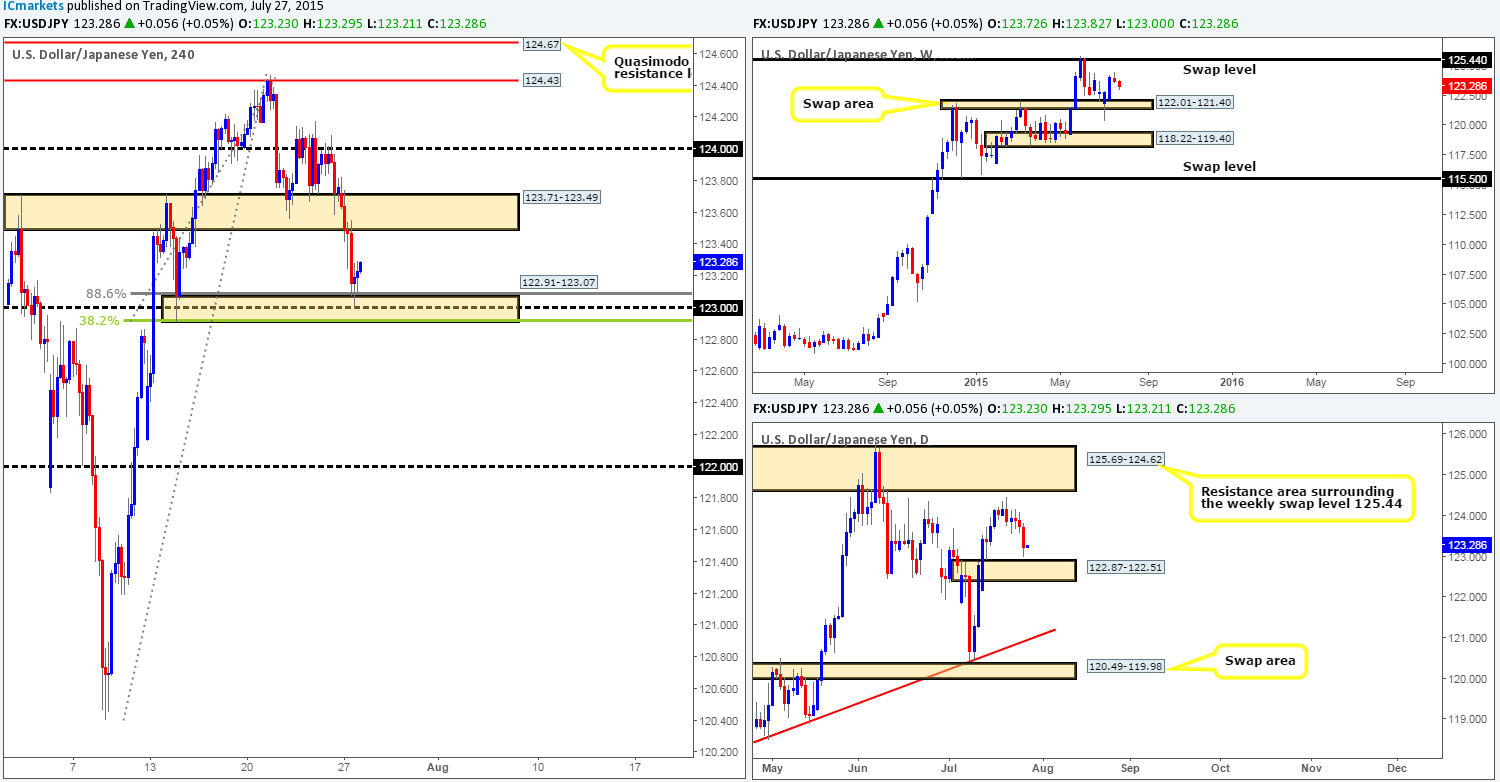
Immediately after price opened at 123.72, this market began selling off. This, as you can see, continued until the U.S. open, where at which point we saw price action rebound from a heavily confluent 4hr demand area at 122.91-123.07.
This 4hr demand zone was actually mentioned in our previous report as an area to keep an eye on for potential buying opportunities (http://www.icmarkets.com/blog/monday-27th-july-weekly-technical-outlook-and-review/). Confluence ranges from the following structures:
- Sits just above the daily swap (demand) area at 122.87-122.51.
- Round-number support at 123.00.
- 38.2% Fibonacci barrier at 122.91.
- 4hr Harmonic Bat pattern with a Fibonacci defining limit of 88.6% (not marked on the chart but should be easy enough to see).
There is, at the time of writing, very little lower timeframe confirmation being seen around this area of demand at the moment, therefore we fear that we may have missed the boat here so to speak. For those who are already long, we’d personally be looking to take partial profits at the 4hr swap (supply) area at 123.71-123.49, and likely close our full position around the 124.00 region.
However, for traders who missed the initial bounce from this 4hr area, like us, all may not be lost. The reason being is price could yet effectively dive lower today to connect with the aforementioned daily swap (demand) area and fake below the current 4hr demand zone. This would take out a ton of sell stops from both traders already long and breakout sellers looking to sell, thus providing liquidity for the big boys to buy into. In the event that a fake lower does indeed happen and price springs back forming a pin bar of sorts, we would likely take the plunge here and enter long at market.
Levels to watch/ live orders:
- Buys: 122.91-123.07 [Tentative – confirmation required] (Stop loss: dependent on where one confirms this area).
- Sells: Flat (Stop loss: N/A).
USD/CAD:
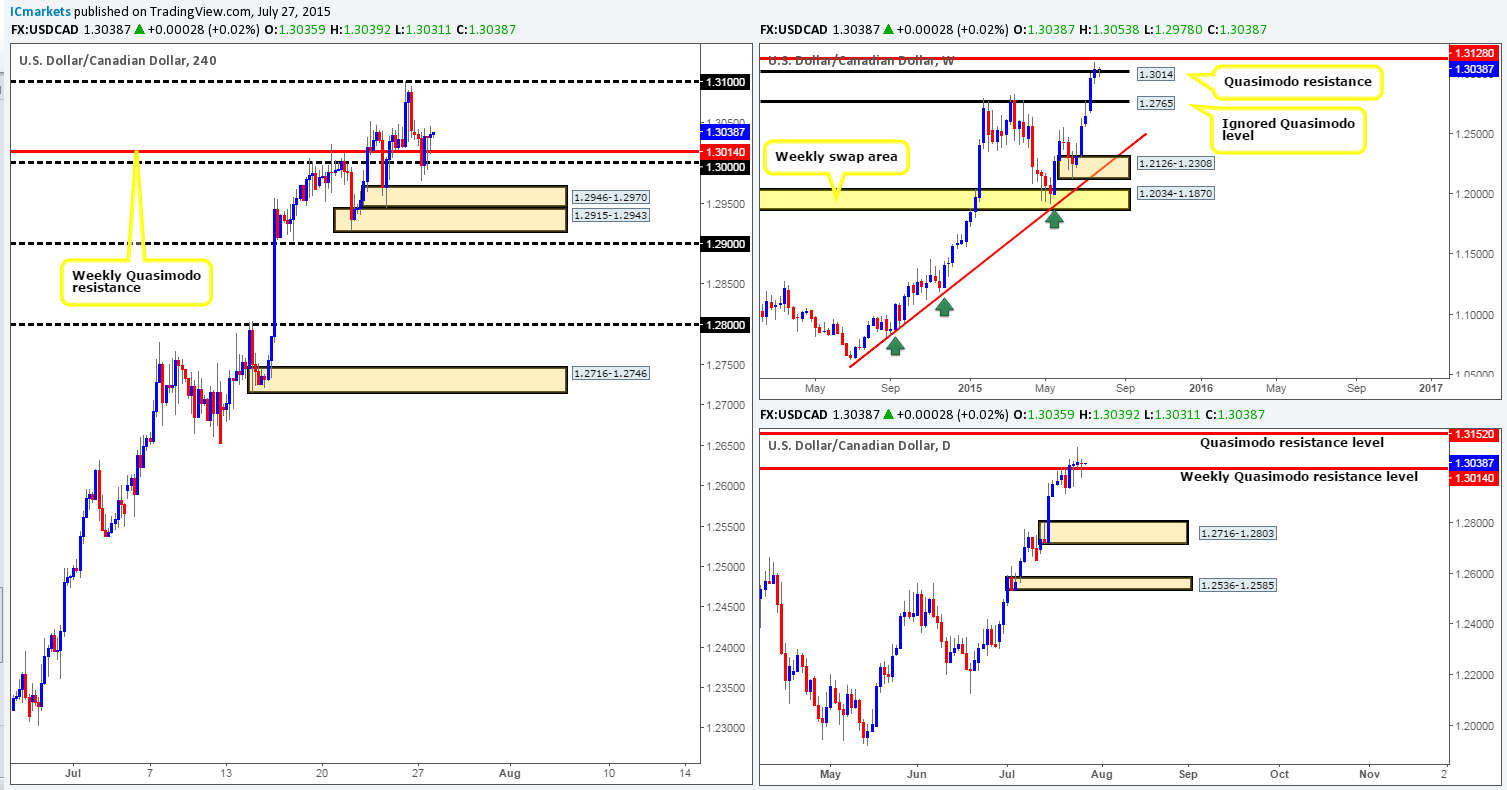
Yesterday’s action shows that going into the London session, price drove through the weekly Quasimodo resistance (now acting support) level at 1.3014 and shook hands with round-number support at 1.3000, which, as you can see, was clearly enough to cushion a counter-attack back up above the aforementioned weekly Quasimodo level. As a result, if you look across to the daily timeframe, you’ll notice that price printed a very nice looking bullish pin-bar candle.
With all of the above taken into consideration, we’re quite confident this pair is likely to appreciate in value this week back up to at least 1.3100, which sits just below a weekly swap (resistance) level at 1.3128. Therefore, our objective for today is simple – watch for lower timeframe buying confirmation off the base of 1.3014 (weekly Quasimodo level). Should we manage to spot an entry here, we’ll then look at targeting 1.3100 for a quick (hopefully) 70/80 – pip profit.
Levels to watch/ live orders:
- Buys: 1.3014 region [Tentative – confirmation required] (Stop loss: dependent on where one confirms this area).
- Sells: Flat (Stop loss: N/A).
USD/CHF:
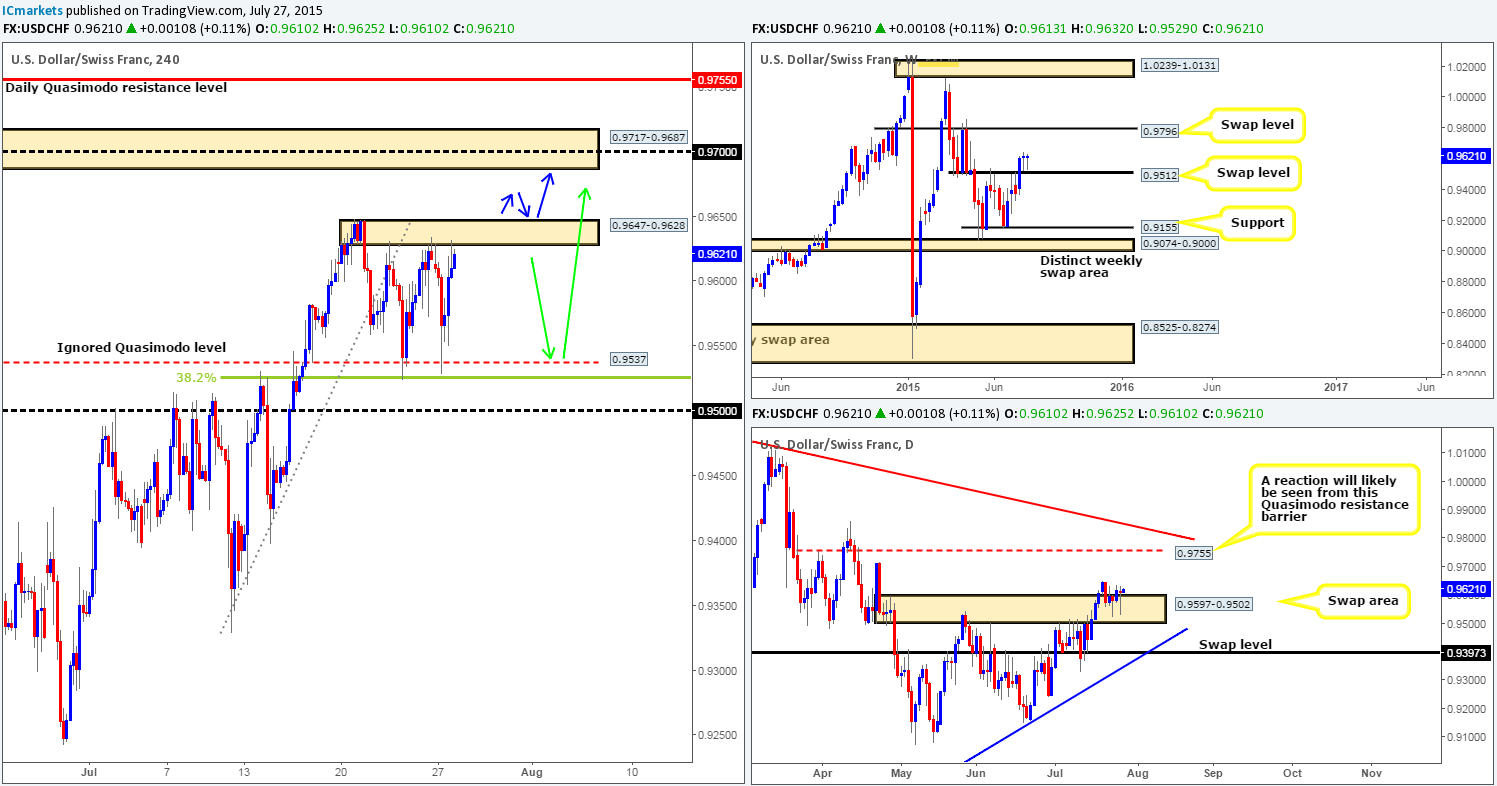
Working our way from the weekly timeframe down this morning, we can see that price is once again seen respecting the top-side limit of the weekly swap (support) level at 0.9512. Alongside this, bids are still seen holding firm within the daily swap (demand) area at 0.9597-0.9502.
Going down to the 4hr timeframe, price action shows us that relatively heavy volatility was seen on this pair throughout yesterday’s sessions. Price not only went one-on-one with the 4hr ignored Quasimodo level at 0.9537 (38.2% Fibonacci convergence), but was also seen bumping heads with 4hr supply coming in 0.9647-0.9628 (both barriers proving tough nuts to crack at the moment). Despite this flurry of buying and selling, price closed only seven pips above Monday’s close!
Taking all of the above into account, here is our two pips’ worth on where this pair may trade today:
- Seeing as the higher timeframes are showing bullish intent right now (see above), we could see the current 4hr supply zone consumed. This could provide a potential retest opportunity (lower timeframe confirmation required), targeting the fresh 4hr supply seen above at 0.9717-0.9687 (blue arrows).
- In the event that the current 4hr supply holds the market lower once more and pushes prices down to 0.9537 again, we may, if the lower timeframe price action is agreeable, look to trade long from here. Partial profits would be taken at 0.9624 (stop will be moved to breakeven at this point), with the 4hr supply area mentioned above at 0.9717-0.9687 (green arrows) as our final take-profit region.
Levels to watch/ live orders:
- Buys: 0.9537 [Tentative – confirmation required] (Stop loss: dependent on where one confirms this level) Watch for 0.9647-0.9628 to be consumed and then look to enter long on any retest seen (confirmation required).
- Sells: Flat (Stop loss: N/A).
XAU/USD: (Gold)
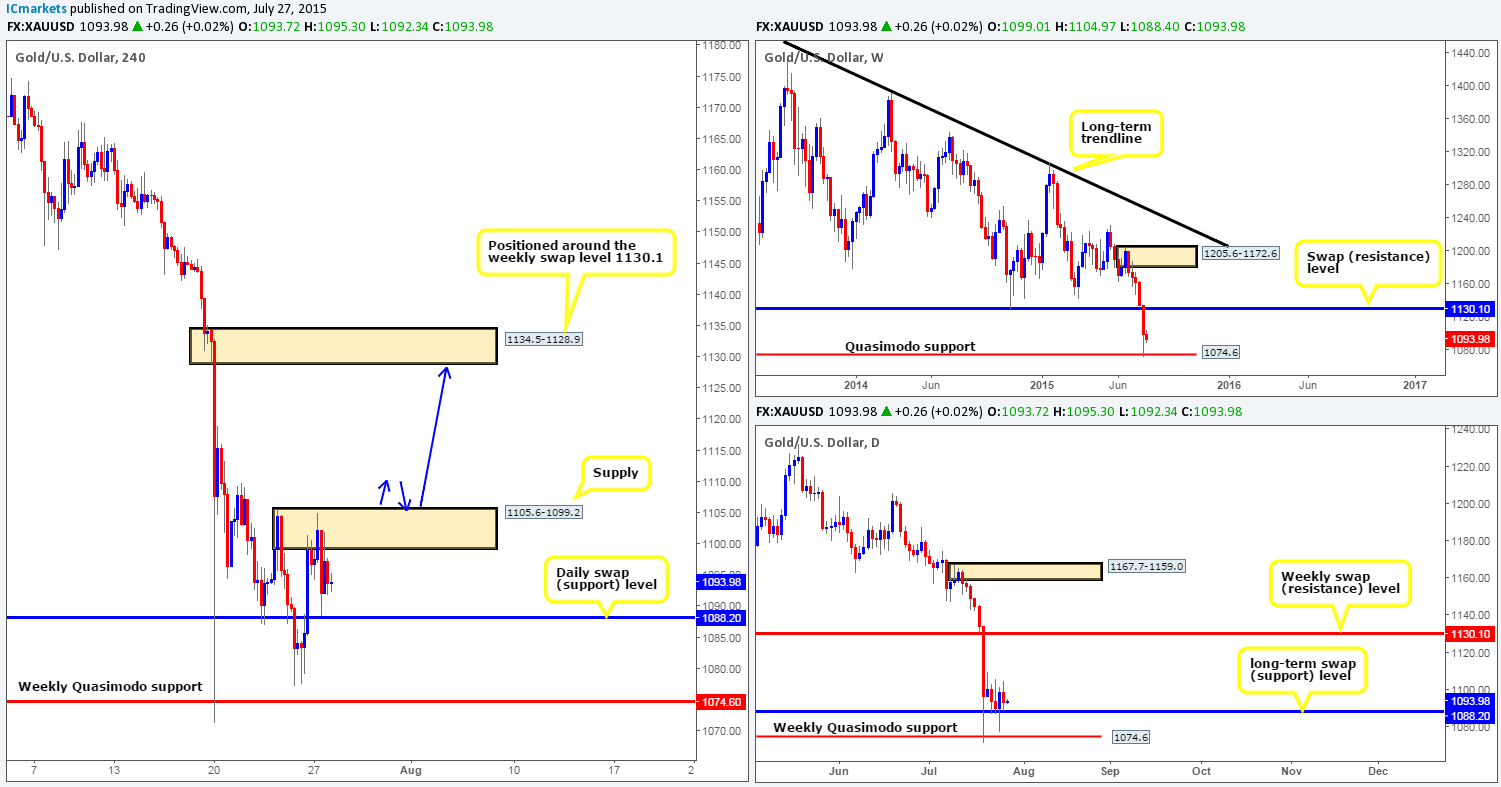
For those who read our previous report on Gold, you may recall that we mentioned if price were to drive higher into the 4hr supply area at 1105.6-1099.2 and then drop down to test the daily swap (support) level at 1088.2, we’d consider entering long. As you can see, this did indeed happen, but unfortunately we were unable to find any suitable confirming price action on the lower timeframes to justify a long position.
Therefore, what we’re ideally looking for during today’s sessions is a push above the aforementioned 4hr supply zone, which will, as far as we can see, likely clear the path for further buying all the way up to the 4hr supply area at 1134.5-1128.9 (located around the weekly swap [resistance] level at 1130.1). To trade this move, however, our team would need to see not only a retest of the aforementioned 4hr supply as demand (see blue arrows), but also some sort of lower timeframe buying confirming signal. The risk/reward on this trade would be phenomenal if everything goes as planned!
Levels to watch/ live orders:
- Buys: Watch for 1105.6-1099.2 to be consumed and then look to enter long on any retest seen (confirmation required).
- Sells: Flat (Stop loss: N/A).