Lower timeframe confirmation: is something we use a lot in our analysis. All it simply means is waiting for price action on the lower timeframes to confirm direction within a higher timeframe area. For example, some traders will not enter a trade until an opposing supply or demand area has been consumed, while on the other hand, another group of traders may only need a trendline break to confirm direction. As you can probably imagine, the list is endless. We, however, personally prefer to use the two methods of confirmation mentioned above in our trading.
EURUSD:
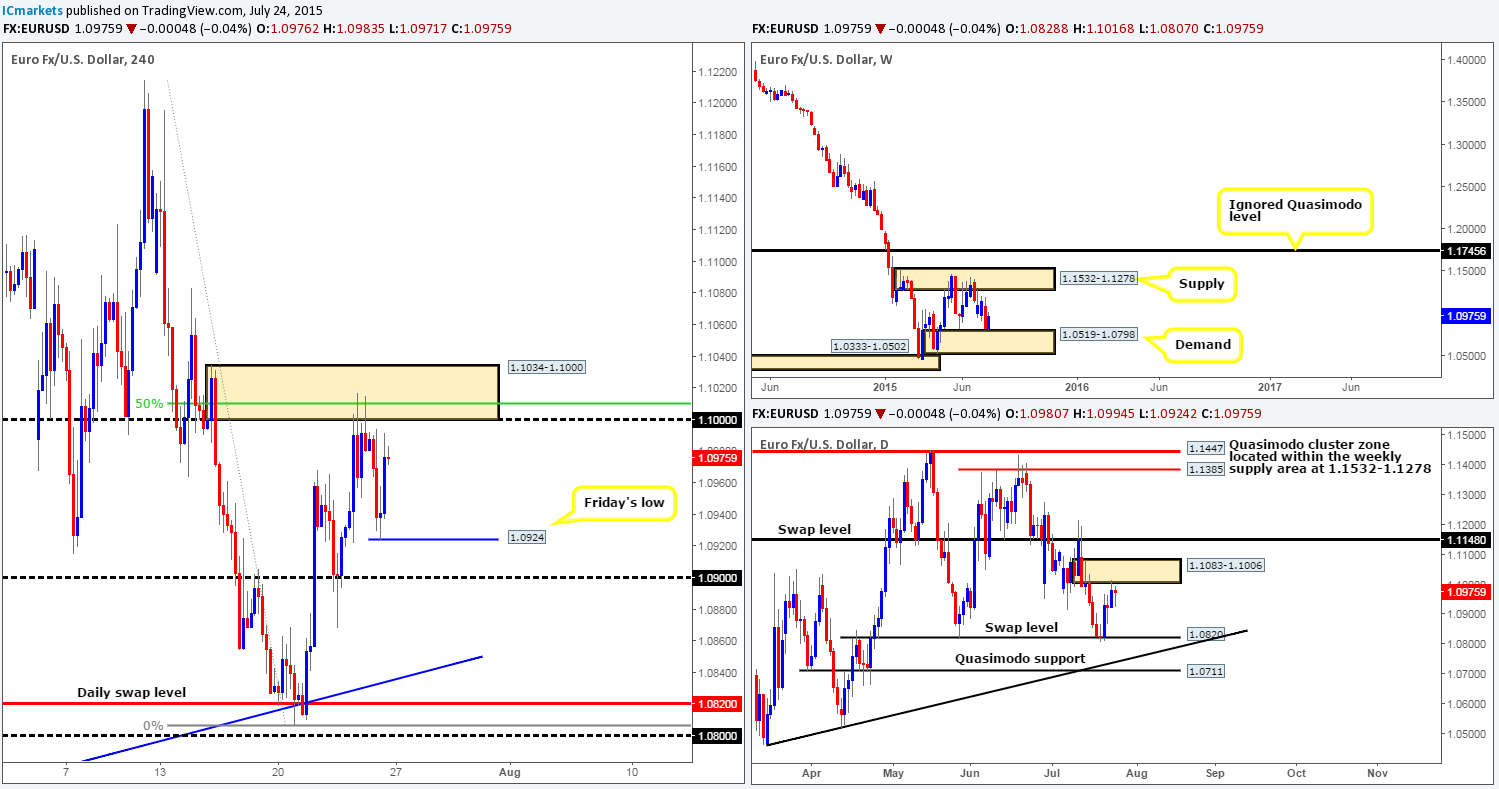
The EUR/USD pair enjoyed a relatively strong week last week as bids came into the market from just above a weekly demand area seen at 1.0519-1.0798, gaining close to 150 pips into the close 1.0975. In the event that the buyers are able to continue holding price here this week, we might, just might, see prices challenge the weekly supply area lurking above at 1.1532-1.1278.
Daily timeframe action on the other hand, shows that last week’s trade began with a daily inverted pin-bar candle off the top-side of a daily swap (support) level coming in at 1.0820 (located just above the weekly demand area at 1.0519-1.0798). Following this, price then spent the remainder of the week pressing forward until we reached an area of daily supply given at 1.1083-1.1006 which held the market lower into the close.
For those who read Friday’s report on the Euro (http://www.icmarkets.com/blog/friday-24th-july-daily-technical-outlook-and-review/), you may recall that we took a short position from 1.10013 around the 4hr supply area at 1.1034-1.1000. Being conservative traders, we did not really want to leave this position running over the weekend and considering price was lurking close to our entry level near the close, we decided to wrap it up and liquidate our position for small profits at 1.0969.
Considering that the weekly timeframe is showing that price bounced from a weekly demand, and the daily timeframe reveals price is now nibbling the underside of daily supply (see above), it is very difficult to judge direction going into this week. Therefore, at least for today anyway, we’re going to focus our energy on hunting for small intraday moves from pre-determined levels of interest:
Potential buy zones:
- Friday’s low 1.0924 will likely see a bounce, whether this bounce will be enough to capitalize on though is anybody’s guess.
- The round number 1.0900. This could provide a wonderful base to look for an intraday play from. The reason being is simply because well-funded traders may seek to fake below Friday’s low and tag in bids sitting at this psychological threshold.
Potential sell zones:
- The same place where we took our short trade late last week (see above), the 4hr supply area at 1.1034-1.1000, which boasts not only resistance from the round number at 1.0000 and the 50.0% Fibonacci level, but is also located within a daily supply area coming in at 1.1083-1.1006.
Just to be clear here, we have no intention in setting pending orders at any of the above said areas, we would need to see the lower timeframe confirmation before we considered risking capital.
Levels to watch/live orders:
- Buys: 1.0924 [Tentative – confirmation required] (Stop loss: dependent on where one finds confirmation) 1.0900 [Tentative – confirmation required] (Stop loss: dependent on where one finds confirmation).
- Sells: 1.1034-1.1000 [Tentative – confirmation required] (Stop loss: 1.1040).
GBP/USD:
Pound Sterling had a rather poor week last week consequently losing close to 100 pips into the weekly close 1.5504. Additionally, this move took back any gains the market had accrued during prior week’s trade, and has now once again placed price within touching distance of the weekly swap (support) level at 1.5451.
Moving down to the daily timeframe, we can see that price actually found resistance from just below a daily supply area coming in at 1.5787-1.5687, which, as you can see, eventually forced this market to connect with a daily swap (support) level below at 1.5484. Friday’s reaction to this barrier does not look much in our opinion and could’ve just been shorts squaring their positions going into the weekend. It will be interesting to see what the 4hr timeframe has to say…
The 4hr timeframe shows a much cleaner picture. Friday’s action reveals that price jabbed into a 4hr swap (demand) area coming in at 1.5485-1.5460 (encapsulates the aforementioned daily swap level/converges nicely with the 61.8% Fibonacci level), and printed a beautiful array of buying tails which eventually propelled price above the round number 1.5500, and also spiked just above the highs at 1.5522.
Now, given that there is a certain harmony being seen across all three of the above timeframes at the moment (Weekly swap (support) level 1.5451/ Daily swap (support) level 1.5484/ 4hr swap (demand) area at 1.5485-1.5460), our primary focus today, and quite possibly into the week will be on looking for longs into this market. With this, we have two possible entry plans:
- Watch for lower timeframe buying confirmation at the round number 1.5500. Should we happen to spot an entry here, we’ll be looking to take partial profits at the 4hr swap level above at 1.5544, and let our remaining position run with our stop at breakeven. Final profits will be, if price reaches this high of course, taken around the 4hr resistance base at 1.5674-1.5642 which is located just below the aforementioned daily supply area.
- Price could dive lower here taking out stops from traders already long at both 1.5500 and also Friday’s low 1.5465 to connect up with the weekly swap (support) level just mentioned above at 1.5451. As such, this is also another area we’d be very interested in taking a long trade from this week (see green buy zone at 1.5442/1.5465). To avoid any deep fakeouts at this weekly level, however, one could wait for the lower timeframes to confirm that there is buying interest here before committing to a trade, as there is nothing worse than getting stopped out to-the-pip only to see price bounce to your target! Targets for this trade will be similar to above, the only difference is we may consider taking partial profits at (what would be resistance then) 1.5500.

Levels to watch/ live orders:
- Buys: 1.5500 [Tentative – confirmation required] (Stop loss: dependent on where one confirms this level) 1.5442/1.5465 [Tentative – confirmation required] (Stop loss: dependent on where one confirms this zone).
- Sells: Flat (Stop loss: N/A).
AUD/USD:
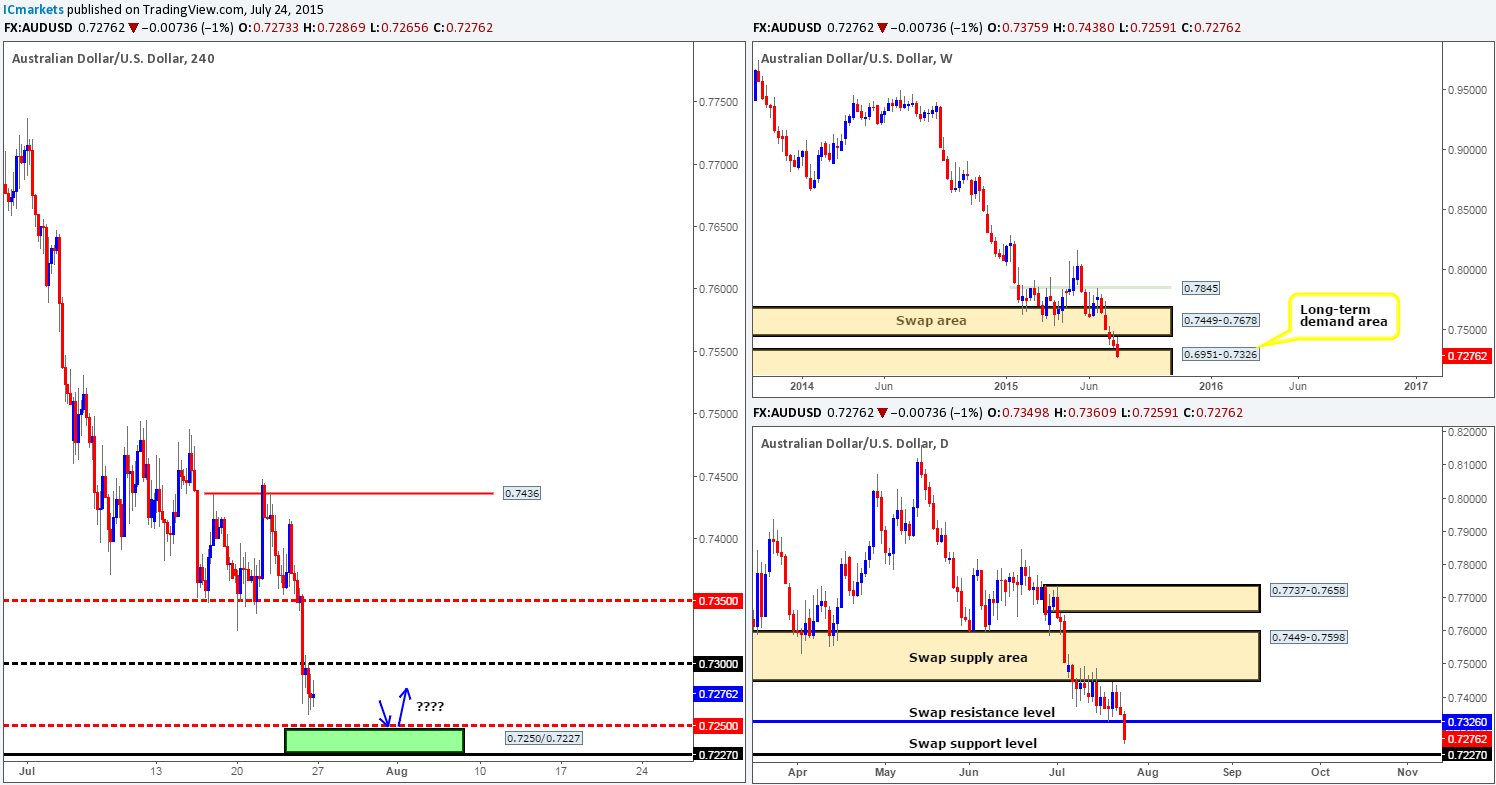
For five straight weeks now the Australian Dollar has depreciated in value against the Greenback, with last week’s decline erasing a further 100 pips of value. This sell-off saw price dive head first into a near-term weekly demand area coming in at 0.6951-0.7326, closing very near its lows at 0.7276.
The daily action shows that the majority of last week’s selling took place on Friday, which, as you can see, took out the daily swap (support) level at 0.7326, and at the same time likely cleared the path south for further selling this week down to another daily swap (support) level given at 0.7227.
From the 4hr timeframe, we can see that Friday’s bearish momentum took out not only the mid-level hurdle 0.7350, but also the round number 0.7300. Following this, price retested 0.7300 as resistance which clearly attracted further sellers into the market since this pair dropped another 25 pips going into the close.
So, with all of the above taken into consideration, where do we think this pair is headed today/this week? Well, taking into account that price is now trading within a long-term weekly demand area at 0.6951-0.7326, should we not be looking to buy this pair today? Yes and no would be our answer, since the daily timeframe indicates that there is still room for further selling yet down to at least 0.7227 (swap level) which is positioned relatively deep within the aforementioned weekly demand area. Therefore, we should be prepared for this to be seen sometime today from either a retest off of 0.7300, or simply a continuation sell-off at the open. Now, the green rectangle represents a possible buy zone for us between the mid-level number 0.7250 and the daily swap (support) level mentioned above at 0.7227. Some will likely think we may be crazy even considering a buy from here with the AUD/USD pair in such a clear downtrend at present, and they could very well be correct! However, technicals show that there is a POSSIBILITY that price may bounce or even reverse from this zone this week, so we’re willing to give it a chance. An alert has been placed at 0.7255, which if triggered will essentially be our cue to begin watching for lower timeframe confirming price action (15/30/60 minute) to enter long. Targets will of course be dependent on how price approaches our zone of interest.
Levels to watch/ live orders:
- Buys: 0.7250/0.7227 [Tentative – confirmation required] (Stop loss: dependent on where one confirms this zone).
- Sells: Flat (Stop loss: N/A).
USD/JPY:
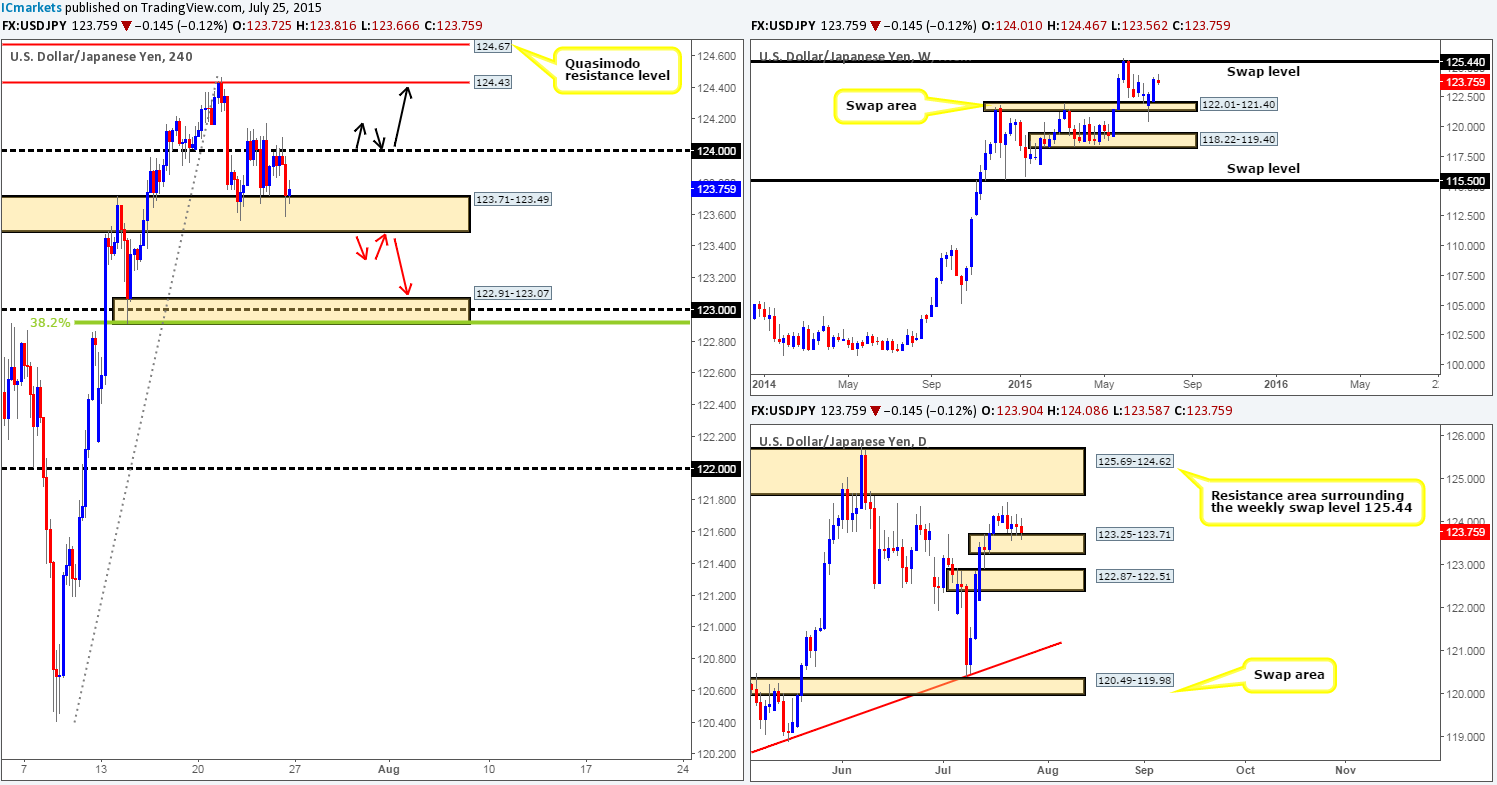
The upward momentum on the USD/JPY slowed right down during last week’s trade, consequently forming a small weekly pin-bar candle going into the close 123.75. Despite this, price did not even really manage to put a dent in the prior two-week rally from the weekly swap area coming in at 122.01-121.40, thus, we still feel this pair may rally to connect with the weekly swap (resistance) level above at 125.44 sometime soon.
Daily timeframe action on the other hand, shows price spent much of last week teasing a small daily swap (demand) area at 123.25-123.71. The somewhat fragile price action seen here could suggest price may breakout south and test the daily swap (demand) area sitting below it at 122.87-122.51. This lower zone is as far as we can see really the last line of defense so to speak before price can once again attack the aforementioned weekly swap area.
On to the 4hr timeframe, we can see a strong wave of offers came in around the 124.00 handle during the course of Friday’s sessions. This move saw price spiral south back down into the 4hr swap (demand) area coming in at 123.71-123.49, where at which point a little short-covering spurge was seen into the close. Given the points made above, we believe this week’s direction will likely come down to which way price breaks out of this temporary 4hr range we’re seeing.
Should the remaining offers around 124.00 be taken out, this will likely lead to a push higher to connect with either the 4hr resistance level at 124.43 or the 4hr Quasimodo resistance level seen above it at 124.67 (positioned just within a daily resistance zone at 125.69-124.62). Shorting at either of the two levels is certainly a viable trade plan in our book. In addition to this, one could, if they so wished, even look to trade the retest of 124.00 following the break if a small enough stop-loss location is found on the lower timeframes (black arrows), targeting 124.40.
However, in the event that bids get taken out from the aforementioned 4hr swap (demand) area this week, we’re quite confident that this market will slip down towards a nice looking 4hr demand area at 122.91-123.07 (sits just above the daily swap area at 122.87-122.51). This – banded together with support being seen from not only the round number 123.00, but also the 38.2% Fibonacci barrier makes this an awesome place to consider longs this week should price get down this far. Also, like above, one could, if a small enough stop-loss location is found on the lower timeframes, look to trade the retest of the 4hr swap (demand) area, targeting 123.10.
In closing, we must be clear here that we have no plan to set pending orders at any of the above said levels, we’d much prefer to see how the lower timeframe price action reacts to these areas before committing capital to a trade.
Levels to watch/ live orders:
- Buys: 122.91-123.07 [Tentative – confirmation required] (Stop loss: 122.86) Watch for 124.00 to be consumed and then look to enter long on any retest seen (confirmation required).
- Sells: 124.43/124.67 [Tentative – confirmation required] (Stop loss: dependent on where one confirms these levels) Watch for 123.71-123.49 to be consumed and then look to enter long on any retest seen (confirmation required).
USD/CAD:
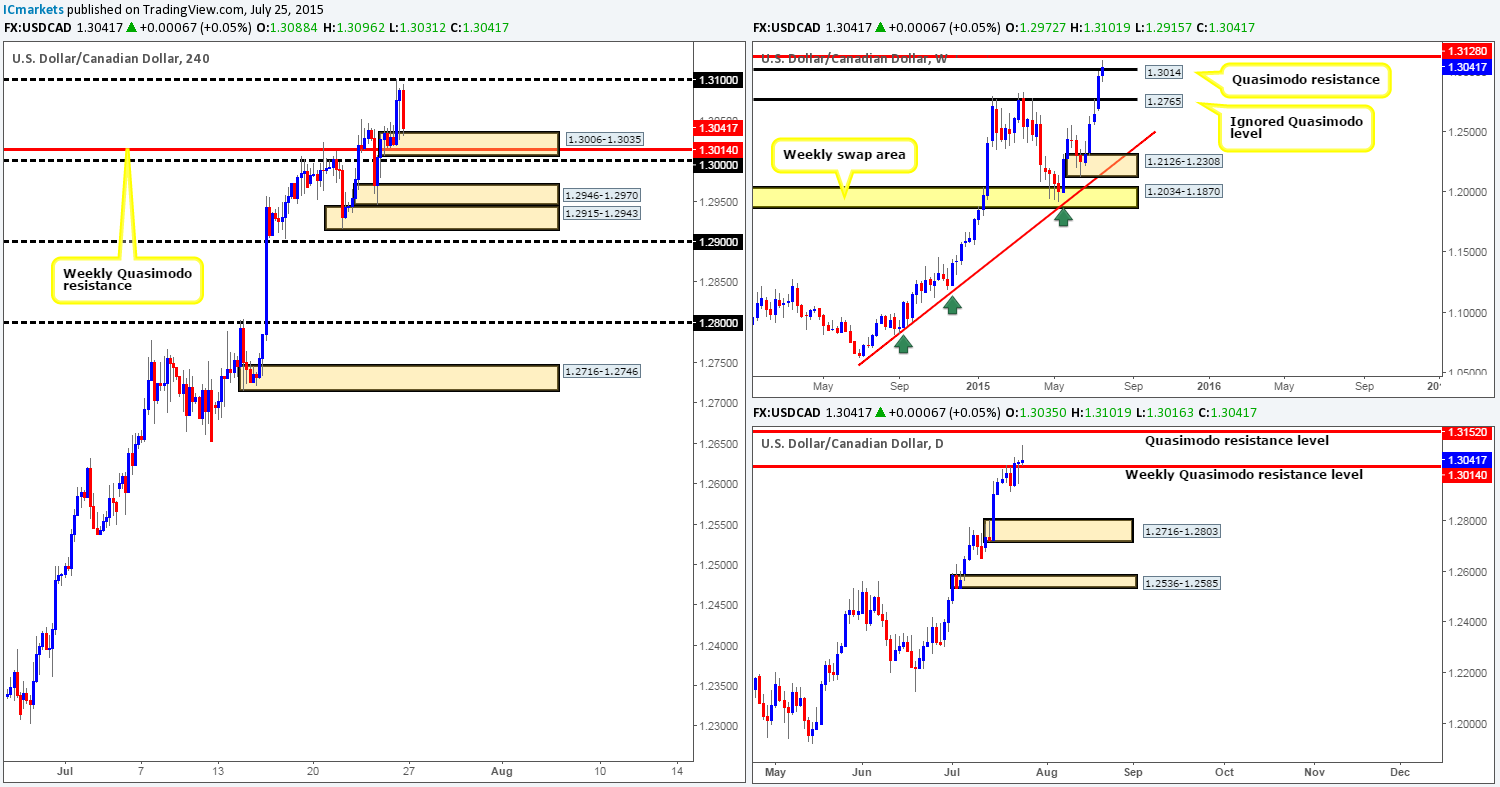
Last week’s trading saw the USD/CAD rally for the fifth consecutive week, gaining a little over 70 pips of value into the close 1.3041. This recent surge saw price close above a weekly Quasimodo resistance level coming in at 1.3014, which as a result has likely opened up the doors for price to challenge the weekly swap (resistance) level at 1.3128.
Moving down one timeframe, we can see that daily price action held above the aforementioned weekly Quasimodo resistance level from Wednesday onwards. With that being said, price did, however, print a rather aggressive selling tail (pin bar) during Friday’s session, which could potentially suggest weakness within the buyers camp? Food for thought…
Looking to the 4hr scale, a round of heavy bids hit this market mid-way through the London morning session on Friday, eventually lifting price up to test the round number 1.3100, which, as you can see, saw price sell-off back down towards a newly-formed 4hr demand area at 1.3006-1.3035.
Now, taking all of the above into account, we feel that as long as price does not get below the 1.2900 handle this week, we may see this market continue to appreciate in value. With that, here is what we have noted so far:
- Potential long opportunity from the 4hr demand area at 1.3006-1.3035 – watch for a possible fake lower to the 1.3000 round number though.
- Stacked 4hr demand between 1.2915-1.2943 and 1.2946-1.2970 could be areas to keep an eye on this week for buying opportunities. However, a fakeout lower to 1.2900 is possible so do keep this in mind.
We would not recommend placing pending orders at any of the above areas, simply because it is difficult to know which one will see a reaction, if any. It is always best to act in your own best interest in this game, that’s why we usually look for the lower timeframes to confirm our levels before jumping in.
Levels to watch/ live orders:
- Buys: 1.3006-1.3035 [Tentative – confirmation required] (Stop loss: dependent on where one confirms this area) 1.2915-1.2943 and 1.2946-1.2970 [Tentative – confirmation required] (Stop loss: dependent on where one confirms these zones).
- Sells: Flat (Stop loss: N/A).
USD/CHF:
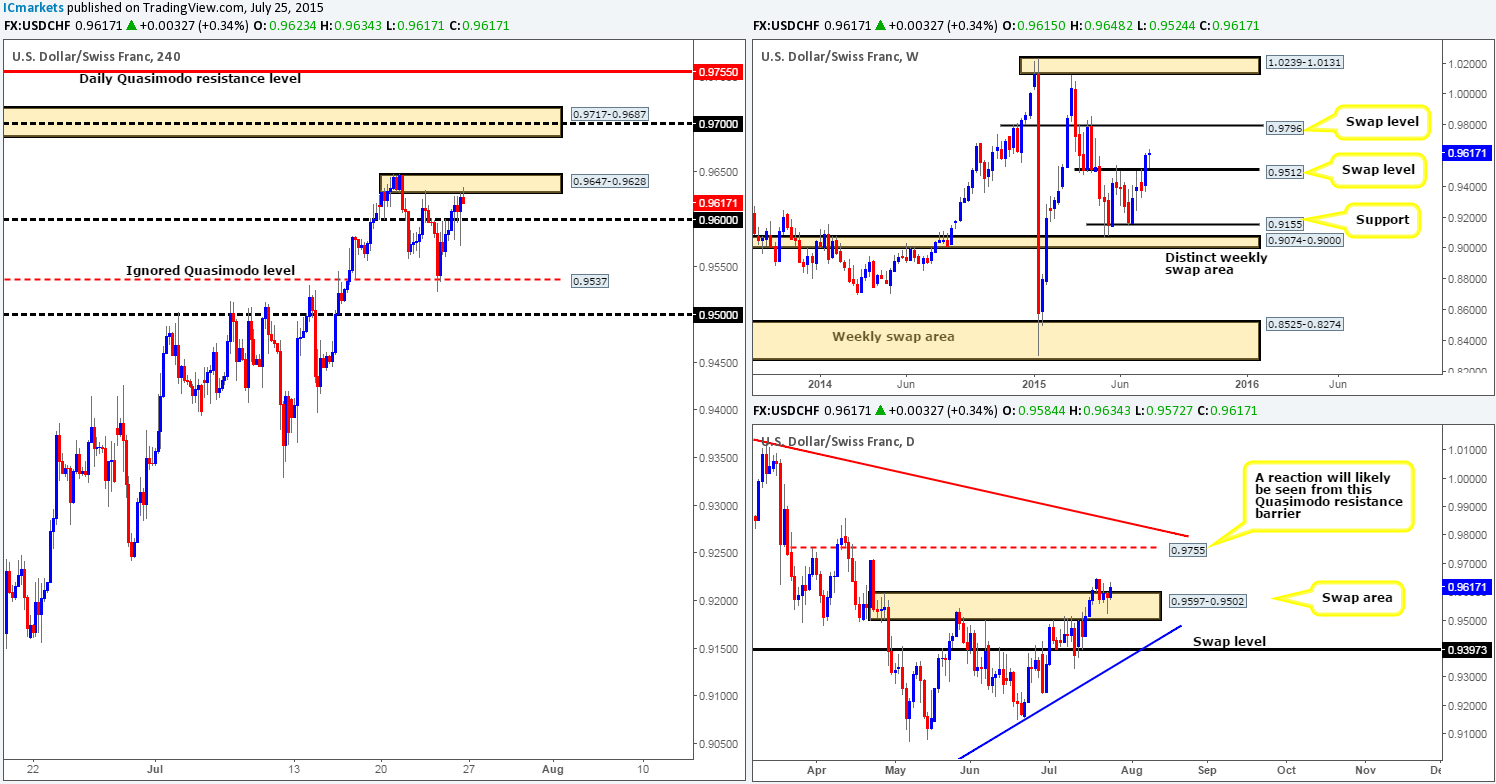
Last week’s action saw price come very close (missed it by twelve pips) to connecting with a weekly swap (support) level at 0.9512 before buyers came into the market. This, as you can see, ended with price closing the week out two pips above the open (0.9615) at 0.9617, consequently forming a relatively strong buying tail in the process. To the upside, we see very little resistance on this timeframe until the weekly swap level coming in at 0.9796.
Recent action on the daily timeframe shows price spent much of last week trading within and around a daily swap (demand) area at 0.9597-0.9502. At the time of writing, the buyers look in relatively good shape here which could attract further buyers into this market this week up to the daily Quasimodo resistance level at 0.9755.
Moving down to the 4hr timeframe, we can see that going into the early hours of Friday’s sessions price action punched through the 0.9600 ceiling, and held as support throughout the rest of the day. This eventually pushed prices higher to connect with a 4hr supply zone coming in at 0.9647-0.9628, which managed to hold the market lower going into the weekly close.
Taking all of the above into account and assuming that 0.9600 holds as support today, we feel that this market will take out the remaining offers sitting within the aforementioned 4hr supply zone and advance further north this week. Therefore, today’s spotlight will firmly be focused on the 0.9600 barrier. Should we manage to spot a long entry here, our team will be looking to ride this train up to the fresh 4hr supply area coming in at 0.9717-0.9687, which sits below the aforementioned daily Quasimodo resistance level.
Levels to watch/ live orders:
- Buys: 0.9600 [Tentative – confirmation required] (Stop loss: dependent on where one confirms this level).
- Sells: Flat (Stop loss: N/A).
DOW 30:
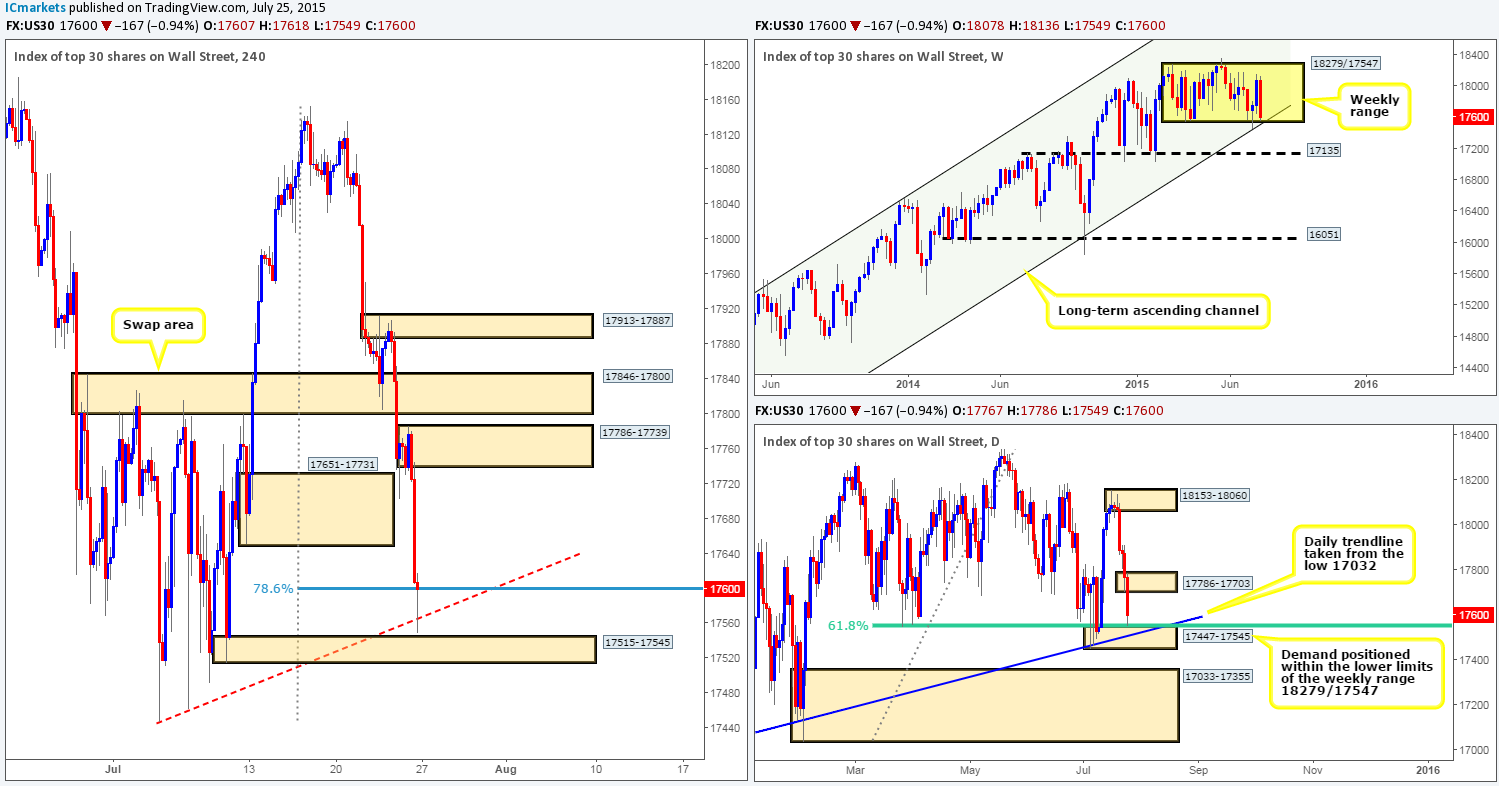
The DOW Index fell hard last week, losing 478 points into the close 17600. Consequent to this, price has once again crossed swords with the lower limit of the current weekly range 18279/17547, which converges beautifully with the ascending weekly channel taken from the low 10402 and high 13287.
Looking down to the daily scale, we can see that last week’s sell-off saw price end the week rebounding slightly off of a daily demand area seen at 17447-17545 (located within the lower limits of the aforementioned weekly range 17547), which boasts support from not only a 61.8% Fibonacci level, but also a daily trendline extended from the low 17032. Should the buyers fight back and defend this zone this week, the next area of potential trouble on this timeframe falls in at around daily supply given at 17786-17703.
The 4hr timeframe shows that the recent sell-off forced price to take out 4hr demand at 17786-17739, and slam dunk itself into quite a nice looking 4hr buy zone which is composed of the following structures:
- Small 4hr demand area at 17515-17545 (positioned just within the aforementioned daily demand area).
- Deep 78.6% Fibonacci support level at 17599.
- Small 4hr trendline taken from the low 17447.
That being the case, and given that agreement is being seen across the board regarding the higher timeframe’s position (see above in bold) at the moment, our prime focus for today/ this week will be on looking for confirmed longs around the above said 4hr buy zone. The reason we require confirmation here comes from seeing very little active demand below the buy zone to offer additional support if needed, thus a fakeout to the extreme low 17447 could take place. Should all go to plan and we manage to find an entry long here, we intend to take partial profits at the 4hr supply area at 17786-17739 and then set our stop to breakeven, thus giving the remaining position room to run further north which will be trailed behind lower timeframe support that forms as price rallies.
Levels to watch/ live orders:
- Buys: 17545/17559 [Tentative – confirmation required] (Stop loss: dependent on where one confirms this area).
- Sells: Flat (Stop loss: N/A).
XAU/USD: (Gold)
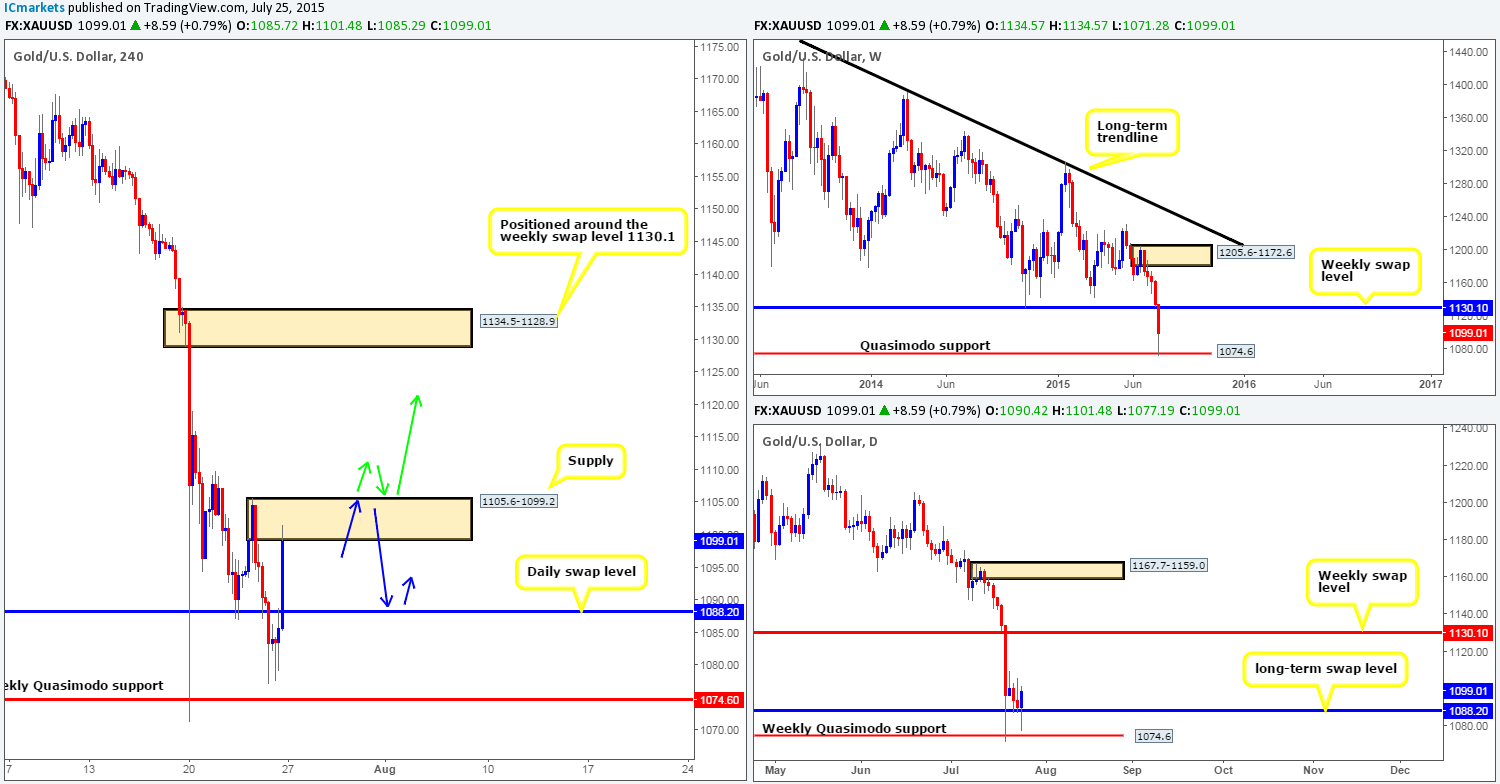
The Gold market sustained further losses for the fifth consecutive week last week, losing $35.20 off its market value. This, as you can probably see from the weekly chart, saw price swoop below the weekly swap (support) level at 1130.1 down towards a weekly Quasimodo support level at 1074.6, which held firm going into the close 1099.0.
Consequent to the above, we can see that additional support was seen in this market from the daily scale coming in at 1088.2 (swap [support] level). This barrier managed to hold prices higher for the entire week, which ended with price printing a nice looking bullish engulfing pattern on Friday.
The 4hr timeframe action was intersecting last week. Following the aggressive sell-off and rebound from the aforementioned weekly Quasimodo support level, price formed a beautifully structured three-drive reversal pattern into the jaws of the daily swap (support) level mentioned above at 1088.2, which as you can see blasted higher to connect with a 4hr supply zone at 1105.6-1099.2 a few hours before the week’s close.
On the one hand, we know that the overall trend in this market is pointing south, on the other, however, it is clear that structural support is currently building strength on the higher timeframes (check above in bold). Therefore, if price can overcome any offers sitting within the current 4hr supply area this week, we feel there is a very good chance that this market could extend higher up to the 4hr supply zone positioned around the weekly swap level at 1130.1. With that, here are two possible avenues we may look to take this week:
- Buy from the daily swap (support) level at 1088.2. Now, for this long to be permitted, we’d need to see the following take place… A deep drive into the current 4hr supply area (preferably a spike above it), whereupon price then drops back to pick up any unfilled buy orders left around 1088.2 (blue arrows). This way we can be pretty sure most of the supply at this barrier is consumed.
- In the event that price closes above the current 4hr supply zone, we may look to try and trade any retest seen off this area.
In closing, the overall take-profit target for any trades taken from the above said areas will be 1127.9. Furthermore, waiting for lower timeframe confirmation is strongly advised here due to current trend direction.
Levels to watch/ live orders:
- Buys: 1088.2 [Tentative – confirmation required] (Stop loss: dependent on where one confirms this level) Watch for 1105.6-1099.2 to be consumed and then look to enter long on any retest seen (confirmation required).
- Sells: Flat (Stop loss: N/A).
Ever since Gold aggressively rebounded off of the weekly Quasimodo support level at 1074.6 at the beginning of the week, price action drifted lower until buyers came in and defended the daily swap level at 1088.2 on Wednesday. However, as you can see, the buying was relatively short-lived as offers around 4hr supply at 1109.8-1102.9 was able to send this market back down to the aforementioned daily swap level.
Given the points made above, this is what we have logged so far for today’s upcoming action:
- Given Wednesday’s relatively aggressive reaction seen off of the daily swap level at 1088.2, we could, if lower timeframe price action was agreeable, look to take an intraday long position from 1088.2 today, targeting the aforementioned 4hr supply area as per the red arrow.
- If 1088.2 were to give way today, however, a potential short opportunity may present itself if price were to retest 1088.2 as resistance and show some sort of lower timeframe selling confirmation. Should this play out, we’d personally look to target 1074.6 to end the week.