A note on lower timeframe confirming price action…
Waiting for lower timeframe confirmation is our main tool to confirm strength within higher timeframe zones, and has really been the key to our trading success. It takes a little time to understand the subtle nuances, however, as each trade is never the same, but once you master the rhythm so to speak, you will be saved from countless unnecessary losing trades. The following is a list of what we look for:
- A break/retest of supply or demand dependent on which way you’re trading.
- A trendline break/retest.
- Buying/selling tails/wicks – essentially we look for a cluster of very obvious spikes off of lower timeframe support and resistance levels within the higher timeframe zone.
- Candlestick patterns. We tend to only stick with pin bars and engulfing bars as these have proven to be the most effective.
We search for lower timeframe confirmation between the M15 the H1 timeframes, since most of our higher-timeframe areas begin with the H4. Stops are usually placed 5-10 pips beyond confirming structures.
EUR/USD:
Following yesterday’s rather aggressive open the shared currency continued to push north, quickly reaching highs of 1.1382 (just a few pips ahead of H4 Quasimodo resistance at 1.1392). It was from this point that we saw the EUR begin to change tracks, consequently erasing most of the day’s gains and ending the day connecting with a H4 demand at 1.1303-1.1287.
Given how well the current H4 demand was respected as supply in the past, traders likely view this block as a stable platform in which to enter long from. We know this because our team also saw this as a nice buy zone yesterday. However, things have changed from yesterday. Not only is weekly action still loitering around the underside of a weekly resistance area at 1.1533-1.1278, but as of yesterday’s close daily price is now seen trading from daily supply coming in at 1.1446-1.1369. This is certainly not to say that a long trade will not work from the current H4 demand as it could, all we’re saying is be prepared for a push lower.
Our suggestions: In light of the points made above, our team is bearish this pair for the time being. Should our analysis be correct and price does indeed close lower, a short trade could be possible down to the H4 mid-way support 1.1250, followed closely by the H4 support at 1.1233 (sits within daily demand at 1.1242-1.1202 – essentially the next downside target on the daily timeframe).
For most who read our analysis will already know that we’re not too fond of breakout trading, so for us to be permitted to trade this move we’d need to see two things happen. Firstly, a retest of the broken H4 demand as supply would need to be seen, and secondly a lower timeframe confirming sell signal following the retest. This signal could be in the form of an engulf of demand, a trendline break/retest or simply a collection of well-defined selling wicks around the higher timeframe area.

Levels to watch/live orders:
- Buys: Flat (Stop loss: N/A).
- Sells: Watch for price to consume 1.1303-1.1287 and look to trade any retest seen thereafter (lower timeframe confirmation required).
GBP/USD:
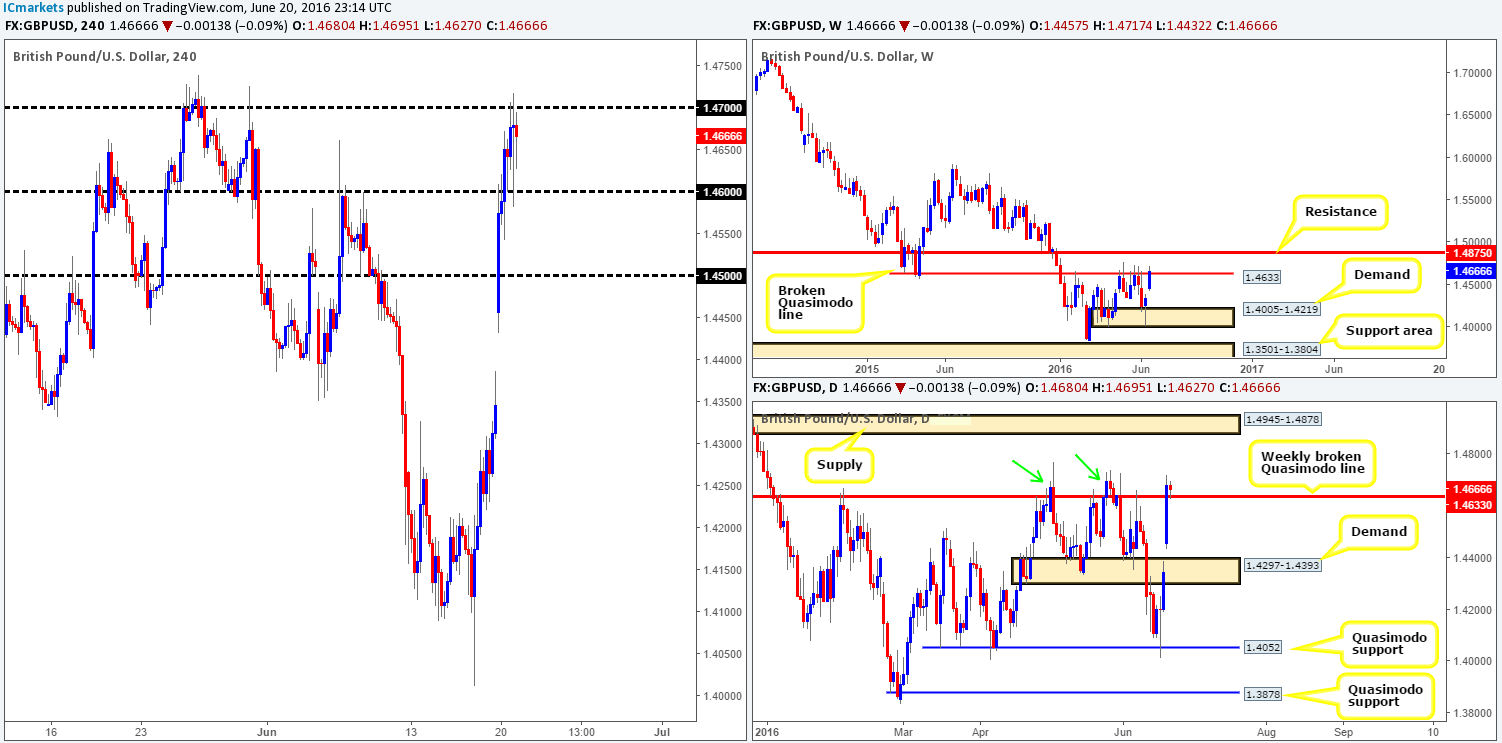
Recent polls surrounding the current ‘Brexit’ situation continue to flood the wires, with latest news indicating that the ‘remain’ camp is gaining ground. This, as you can see, saw the GBP rally over 200 pips yesterday, breaking through both the 1.45 and 1.46 handles, before peaking at 1.47 going into the US open.
Looking over to the daily chart we can see that, thanks to yesterday’s buying, price closed above the weekly broken Quasimodo line at 1.4633. This does not, however, mean we should all hit the buy buttons! Just take a look at the previous action. On two occasions (see green arrows) this unit also closed above this line only to later then sell-off.
Our suggestions: As we mentioned in Monday’s report, we’re very hesitant trading EUR and GBP pairs this week due to the EU referendum being so close to finalizing. High volatility is expected throughout the week and as such technical setups become extremely vulnerable.
However, purely from a technical perspective, a decisive close above 1.47 followed by a strong retest would, under normal circumstances, be sufficient to begin looking for a lower timeframe buy entry. In all honesty though guys, even if this setup did take shape today or going into the week, we’d probably pass in view of the current political climate.
Levels to watch/live orders:
- Buys: Flat (Stop loss: N/A).
- Sells: Flat (Stop loss: N/A).
AUD/USD:
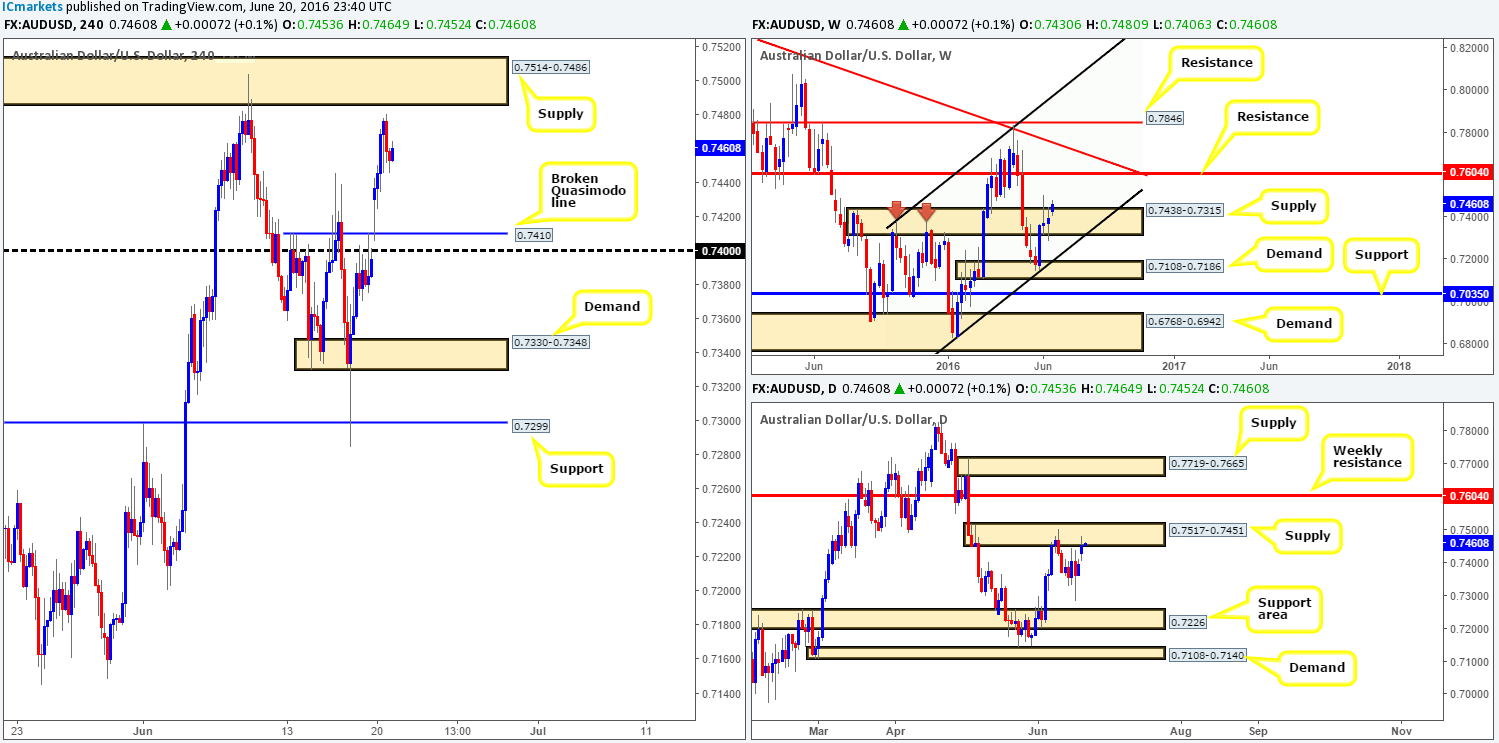
Starting from the top this morning, weekly supply at 0.7438-0.7315 is looking incredibly weak at the moment. In the event that this market remains bid, it’s highly likely weekly resistance at 0.7604 will be brought into the action. On the other side of the coin, however, daily candlesticks are currently testing daily supply drawn from 0.7517-0.7451. This area could, as it did a few weeks back, be enough to help suppress buying pressure within the aforementioned weekly supply zone.
Shortly after the market opened on Sunday, H4 action spiked lower to fill bids at the H4 broken Quasimodo line 0.7410. This propelled the commodity currency to highs of 0.7480 (just ahead of H4 supply at 0.7514-0.7486), before selling-off to lows of 0.7446 during the US session.
Our suggestions: One could look to short from the H4 supply at 0.7514-0.7486 given the position this pair trades at on the daily chart (see above). Nevertheless, we are still hesitant considering that the bulls seem to have an edge within the current weekly supply zone. If one is willing to wait for lower timeframe price action to form within the H4 supply, then selling from here is an option we believe (see the top of this report for lower timeframe confirming techniques).
Levels to watch/live orders:
- Buys: Flat (Stop loss: N/A).
- Sells: 0.7514-0.7486 [Tentative – confirmation required] (Stop loss: dependent on where one confirms this area).
USD/JPY:
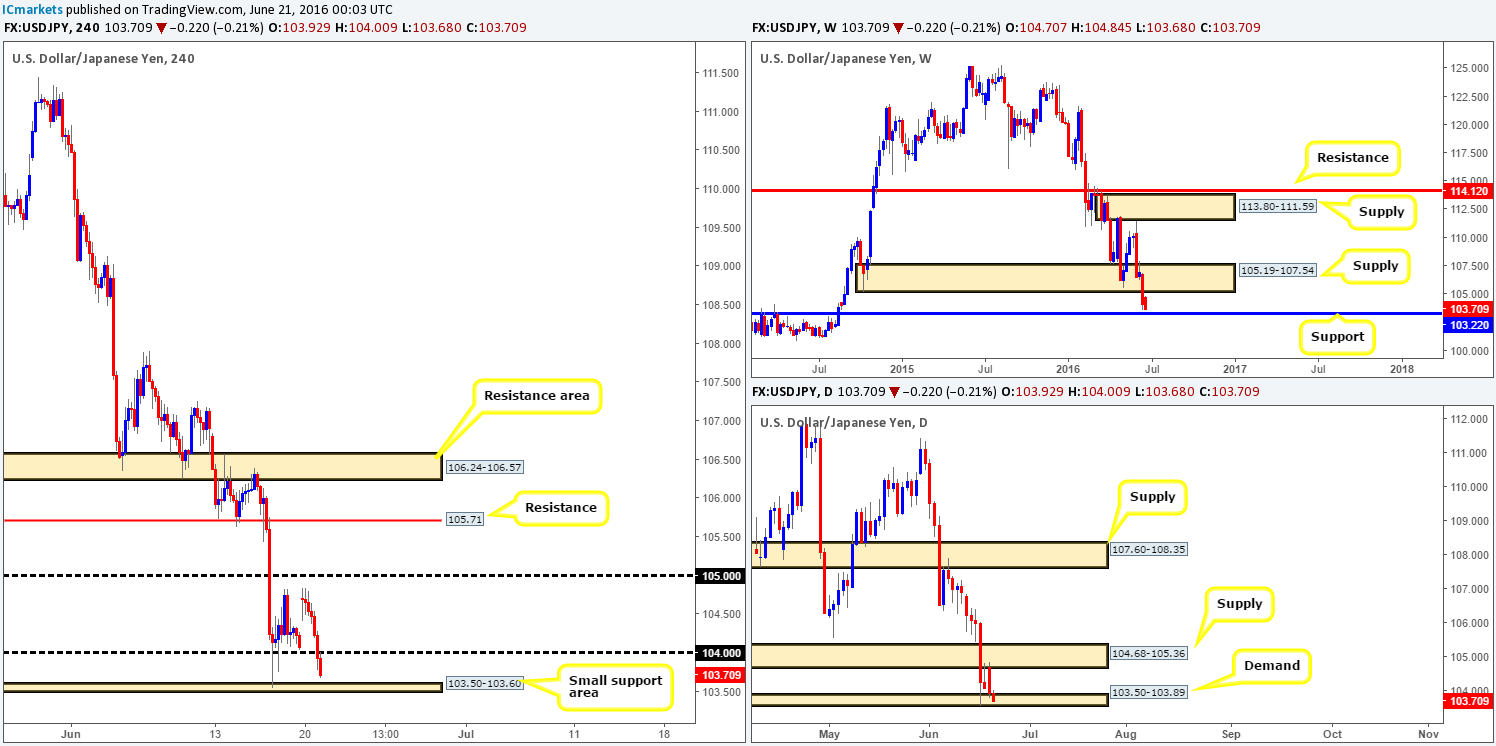
Shortly after Sunday’s opening gap the buyers failed to advance this pair higher, topping out at 104.84. However, it was only until mid-way through London trading did we see the bears really kick into action, which, as you can see, ended the day closing price beyond the 104 handle, leaving the small H4 support area at 103.50-103.60 unchallenged.
With weekly price looking as though it will cross swords with weekly support at 103.22 soon, and daily action trading deep within the confines of a daily demand at 103.50-103.89, where does our team go from here?
Our suggestions: In that weekly support is close to being tagged into the action, traders may want to be cautious going long from the current H4 support area, as a fakeout is highly likely! With that being the case, the 103 handle is, for the time being, the only area that we’d consider buying this market since it’s located a few pips below the weekly support line.
Levels to watch/live orders:
- Buys: 103 region [Tentative – confirmation required] (Stop loss: dependent on where one confirms this area).
- Sells: Flat (Stop loss: N/A).
USD/CAD:
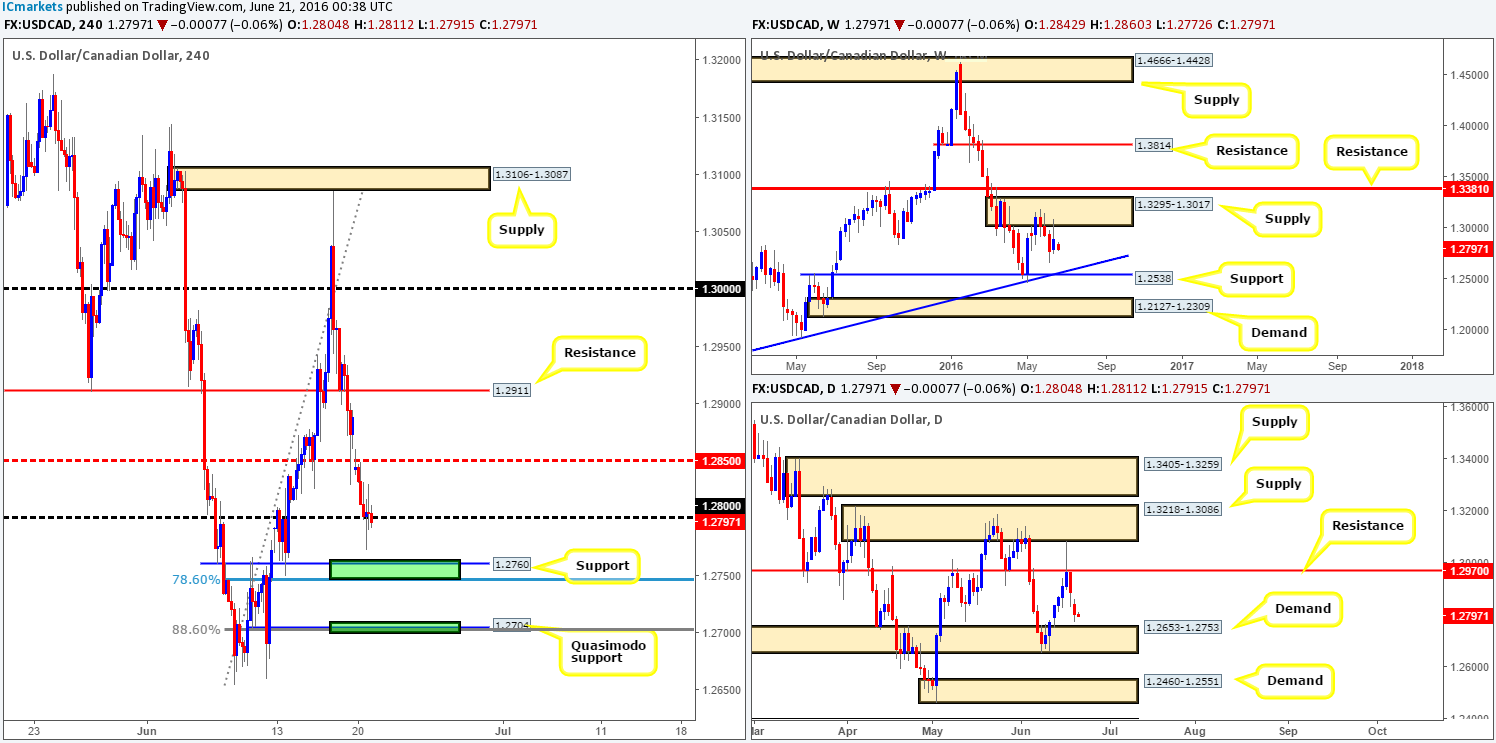
After Sunday’s opening gap, price was well-offered on the retest of the H4 mid-way resistance line drawn from 1.2850, which saw the Loonie drop to shake hands with the 1.28 handle. With the bid-side of this market looking increasingly weak around 1.28 at the moment, we feel further selling is likely on the cards today.
As we mentioned in Monday’s report, however, H4 structure prevents us from taking a short here. Directly below 1.28 sits two H4 support zones marked in green (H4 78.6% support at 1.2746, H4 support at 1.2760/H4 Quasimodo support at 1.2704, 1.27 handle and a H4 88.6% Fib support at 1.2702) which will very likely hold price!
Our suggestions: Watch for buy entries (preferably on the lower timeframes – see the top of this report for entry techniques) around the two lower H4 (green) zones (1.2746/1.2760 – 1.27/1.2705). Despite weekly price showing room to drive lower to a weekly trendline support extended from the high 1.1278, both of these H4 areas are located nearby the daily demand area at 1.2653-1.2753, so a bounce is still likely.
Levels to watch/live orders:
- Buys: 1.2746/1.2760 [Tentative – confirmation required] (Stop loss: dependent on where one confirms this area). 1.27/1.2705 [Tentative – confirmation required] (Stop loss: dependent on where one confirms this area).
- Sells: Flat (Stop loss: N/A).
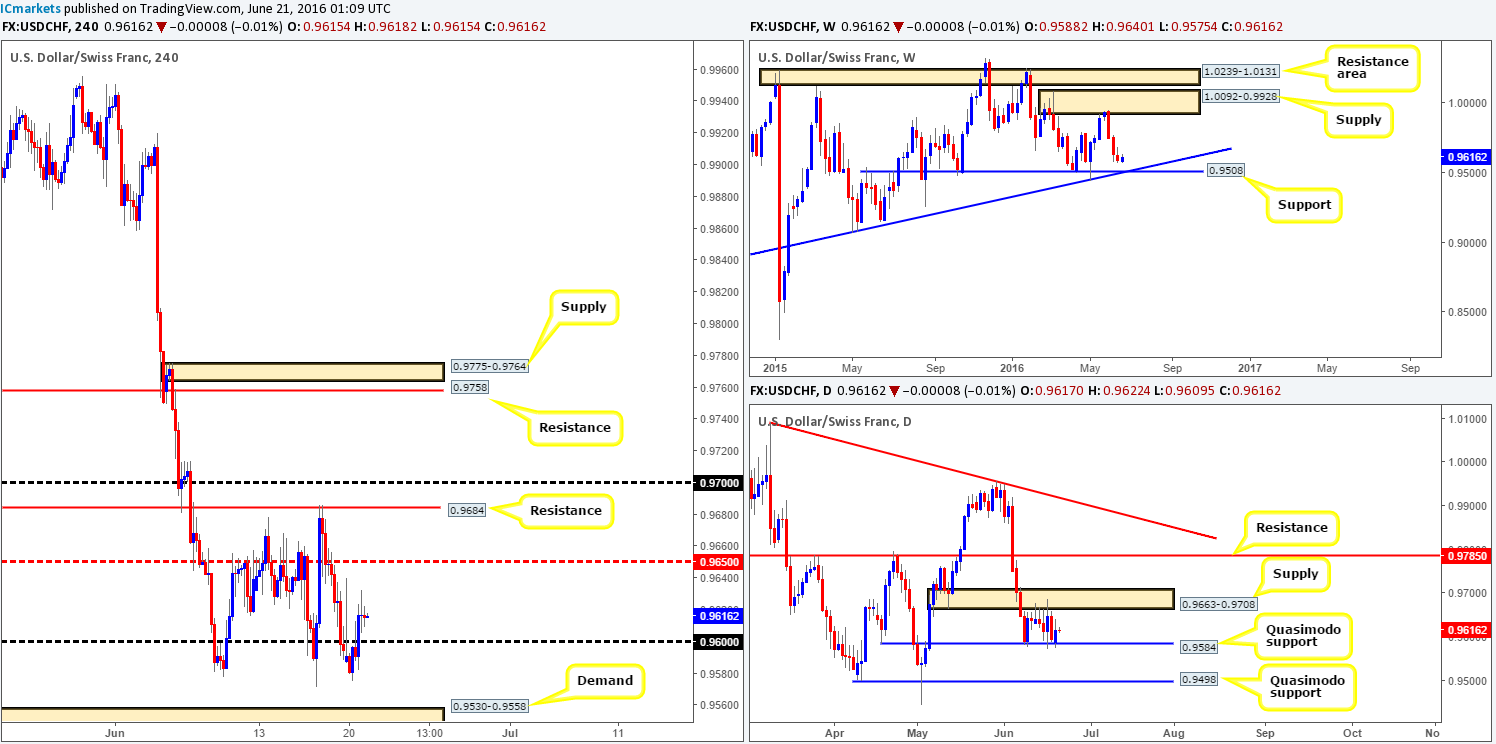
USD/CHF:
Beginning with a look at the weekly chart this morning, we can see that the bears have been in control of this market since price peaked around weekly supply coming in at 1.0092-0.9928. What is more, we see very little support to stop the Swissy from continuing to push lower down to a weekly support drawn from 0.9508, which coincides nicely with weekly trendline confluence taken from the low 0.9078. Turning our attention to the daily chart, the pair remains sandwiched between a daily supply zone at 0.9663-0.9708 and a daily Quasimodo support at 0.9584. Any sustained move beyond the current daily supply would likely place daily resistance at 0.9785 in the spotlight. Meanwhile, a push below the daily Quasimodo support potentially opens the floodgates down to 0.9498 – another daily Quasimodo support line.
For those who read Monday’s report (see link below) you may recall us mentioning to wait for at least a H4 close below the daily Quasimodo support at 0.9584 before looking to trade short in this market. As we can see, the close lower never materialized and price rallied to highs of 0.9632 as a result.
Our suggestions: Entering long from 0.96 may look attractive when taking into account that the daily timeframe shows room to appreciate up to daily supply at 0.9663-0.9708. However, let’s not forget that weekly bears are currently in control and could very well slash through 0.96! Under these circumstances, our team is going to step aside today and reassess the structure going into tomorrow’s sessions.
Levels to watch/live orders:
- Buys: Flat (Stop loss: N/A).
- Sells: Flat (Stop loss: N/A).
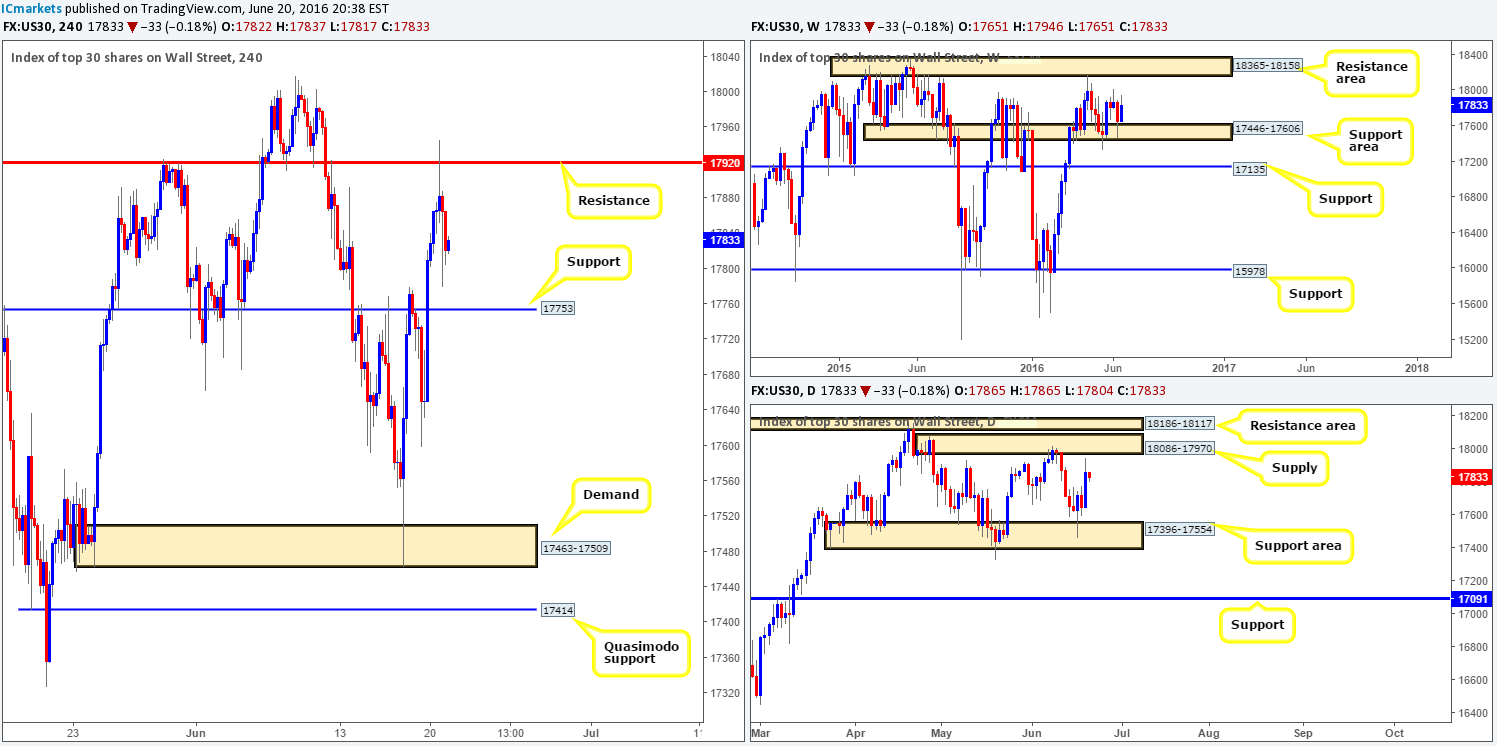
DOW 30:
In recent trading, we can see that the DOW continued to rally following the break of the H4 resistance at 17753 (now acting support) yesterday, and went on to touch a H4 resistance line at 17920 which held price lower into the close. Seeing as how this recent surge of buying brought this unit up to within touching distance of daily supply at 18086-17970, entering long from 17753 is a little bit touch-and-go now.
However, should price halt at this line and form a lower timeframe buy setup we may, considering the weekly chart shows price trading from a weekly support area at 17446-17606, look to take a small buy position. In regards to finding a lower timeframe buy signal, we usually look for either an engulf of supply, a trendline break/retest or simply a collection buying tails around the support. This is by no means a guaranteed trade if a lower timeframe buy signal is seen, but it does usually help to keep one out of trouble.
Levels to watch/live orders:
- Buys: 17753 region [Tentative – confirmation required] (Stop loss: dependent on where one confirms this area).
- Sells: Flat (Stop loss: N/A).
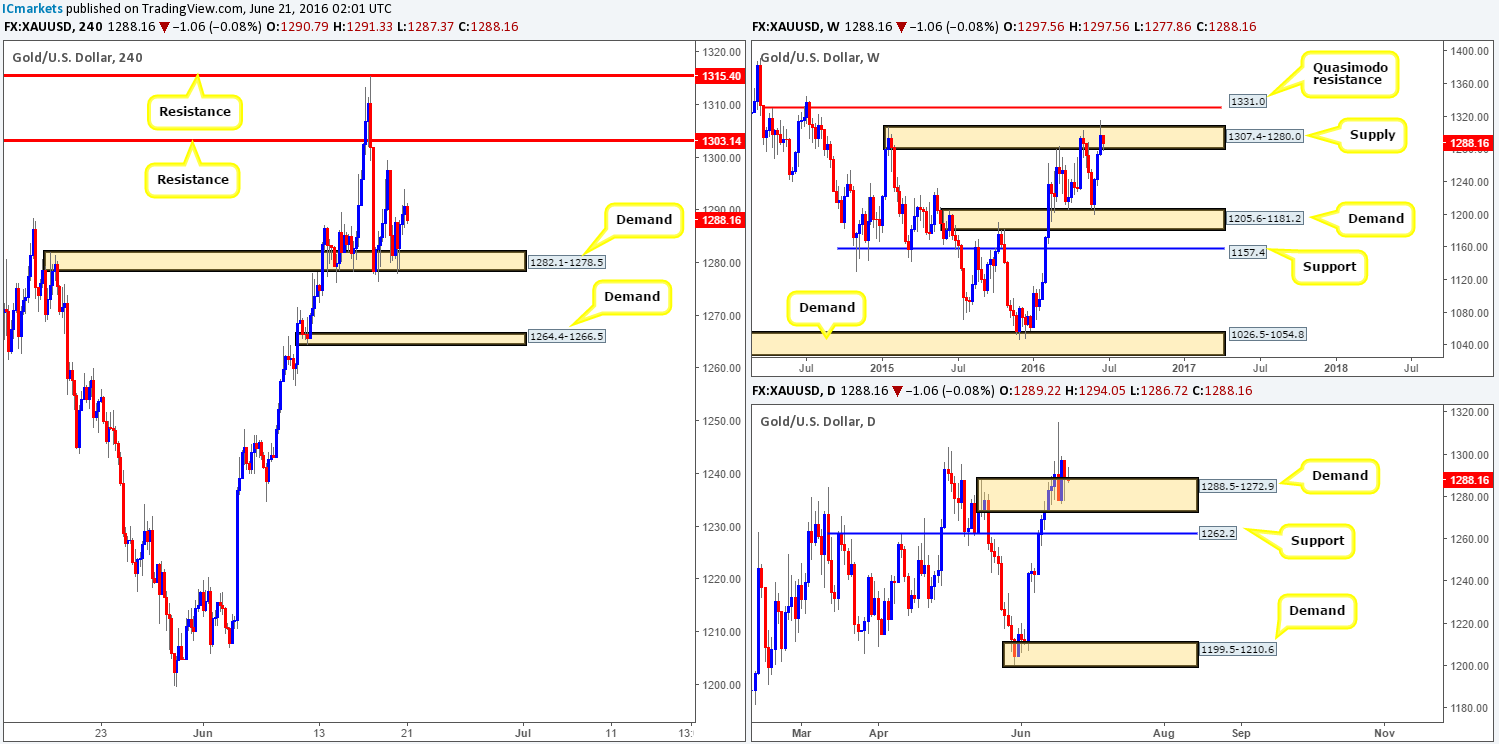
GOLD:
(With little movement seen yesterday much of the following report echoes thoughts put forward in our previous analysis).
Using a top-down approach this morning, it’s clear to see that the yellow metal continues to trade within weekly supply penciled in at 1307.4-1280.0. This area has been visited twice already and each time responded with relatively aggressive selling – will history repeat itself?
From the daily chart, however, current price is seen trading from the top-side of a daily demand zone drawn from 1288.5-1272.9. On the assumption that this area holds up against the current weekly supply, we see very little fresh supply to the left of price until the market reaches 1333.4 – a daily Quasimodo resistance which sits just above a weekly Quasimodo resistance at 1331.0 (the next upside target beyond the current daily supply).
Stepping across to the H4 chart, demand at 1282.1-1278.5 continues to provide a floor of support to this market. Technically, gold is a bit of a tricky beast to trade. On the one hand there is potential for a sell-off from the weekly supply base at 1307.4-1280.0, and on the other hand, both H4 and daily buyers are trading from demand (see above).
Our suggestions: In light of the above notes we still believe that the more logical route to take today would be to wait and see if price closes below the current H4 demand area. This, at least in our opinion, would indicate weakness within the current daily demand and strength from the current weekly supply, and to top it off, open up the path south down to H4 demand at 1264.4-1266.5 (sits just above daily support at 1262.2 – the next downside target beyond the current daily demand).
To trade this setup, nevertheless, we’d need to see two things happen. Firstly, a retest to the underside of the broken H4 demand would need to be seen, and secondly a lower timeframe sell signal following the retest (see the top of this report for entry techniques). Now, of course, how one enters here depends totally on the individual trader as some are aggressive and could simply short the breakout below the H4 demand, and others, like us, are conservative who needs a little more confirmation to be confident in risking risk capital.
Levels to watch/live orders:
- Buys: Flat (Stop loss: N/A).
- Sells: Watch for price to consume 1282.1-1278.5 and look to trade any retest seen thereafter (lower timeframe confirmation required).