A note on lower timeframe confirming price action…
Waiting for lower timeframe confirmation is our main tool to confirm strength within higher timeframe zones, and has really been the key to our trading success. It takes a little time to understand the subtle nuances, however, as each trade is never the same, but once you master the rhythm so to speak, you will be saved from countless unnecessary losing trades. The following is a list of what we look for:
-
A break/retest of supply or demand dependent on which way you’re trading.
-
A trendline break/retest.
-
Buying/selling tails/wicks – essentially we look for a cluster of very obvious spikes off of lower timeframe support and resistance levels within the higher timeframe zone.
-
Candlestick patterns. We tend to only stick with pin bars and engulfing bars as these have proven to be the most effective.
We search for lower timeframe confirmation between the M15 the H1 timeframes, since most of our higher-timeframe areas begin with the H4. Stops are usually placed 5-10 pips beyond confirming structures.
EUR/USD:
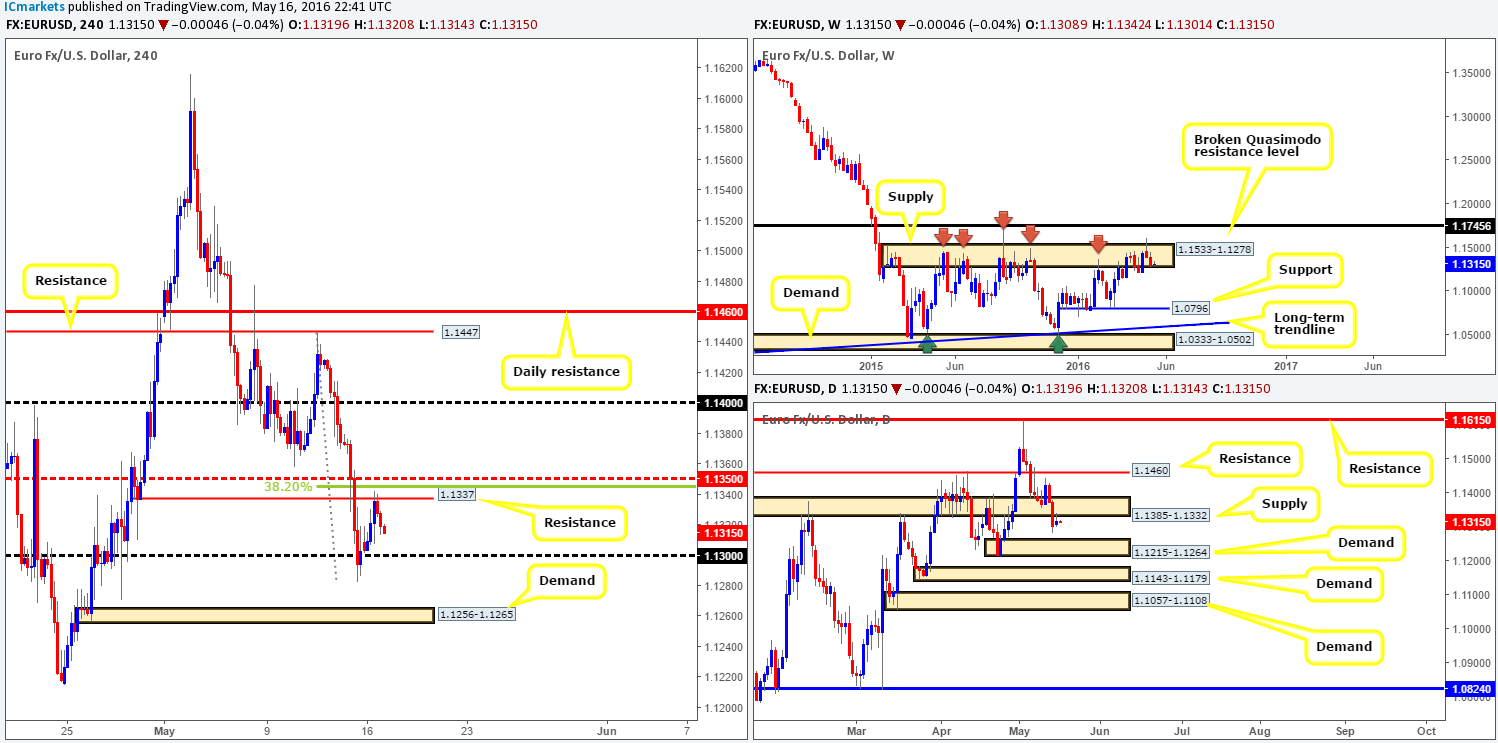
Weekly view: Following the bearish pin bar formed within supply at 1.1533-1.1278 two weeks back, the single currency, as expected, tumbled lower last week. Due to this zone managing to cap upside since May 2015 (see red arrows) we still feel lower prices are on the cards, as the next logical target from here falls in around support at 1.0796.
Daily view: Turning our attention to the daily chart we can see that price retested the underside of a recently broken demand-turned supply at 1.1385-1.1332. This – coupled with weekly action lurking within supply (see above) will likely force this unit south to test demand coming in at 1.1215-1.1264.
H4 view: For those who read our previous report on the EUR/USD (see link below) you may recall us mentioning to watch for possible shorting opportunities around the 1.1350/1.1337 region. As can be seen from the chart, this area was tagged going into the early hours of yesterday’s American session and has since then sold off to lows of 1.1313. Well done to any of our readers who managed to board this train before it departed.
All in all we feel this pair is going to continue weakening today. Psychological support at 1.13 will likely give way due to the more attractive zone sitting just below – the H4 demand base at 1.1256-1.1265. This area, as you’ll see by looking over to the daily chart, sits on top of daily demand chalked in at 1.1215-1.1264 which, as we mentioned above, is the next downside target on that timeframe. Other than a retest of the 1.1350/1.1337 region today, we see little opportunity to sell this market. In regards to buying, however, one may want to consider the possibility of looking for intraday long positions around the aforementioned H4 demand should price reach this low due to its convergence with daily demand.
Levels to watch/live orders:
-
Buys: 1.1256-1.1265 [Tentative – confirmation required] (Stop loss: dependent on where one confirms this area).
-
Sells: 1.1350/1.1337 [Tentative – confirmation required] (Stop loss: dependent on where one confirms this area).
GBP/USD:
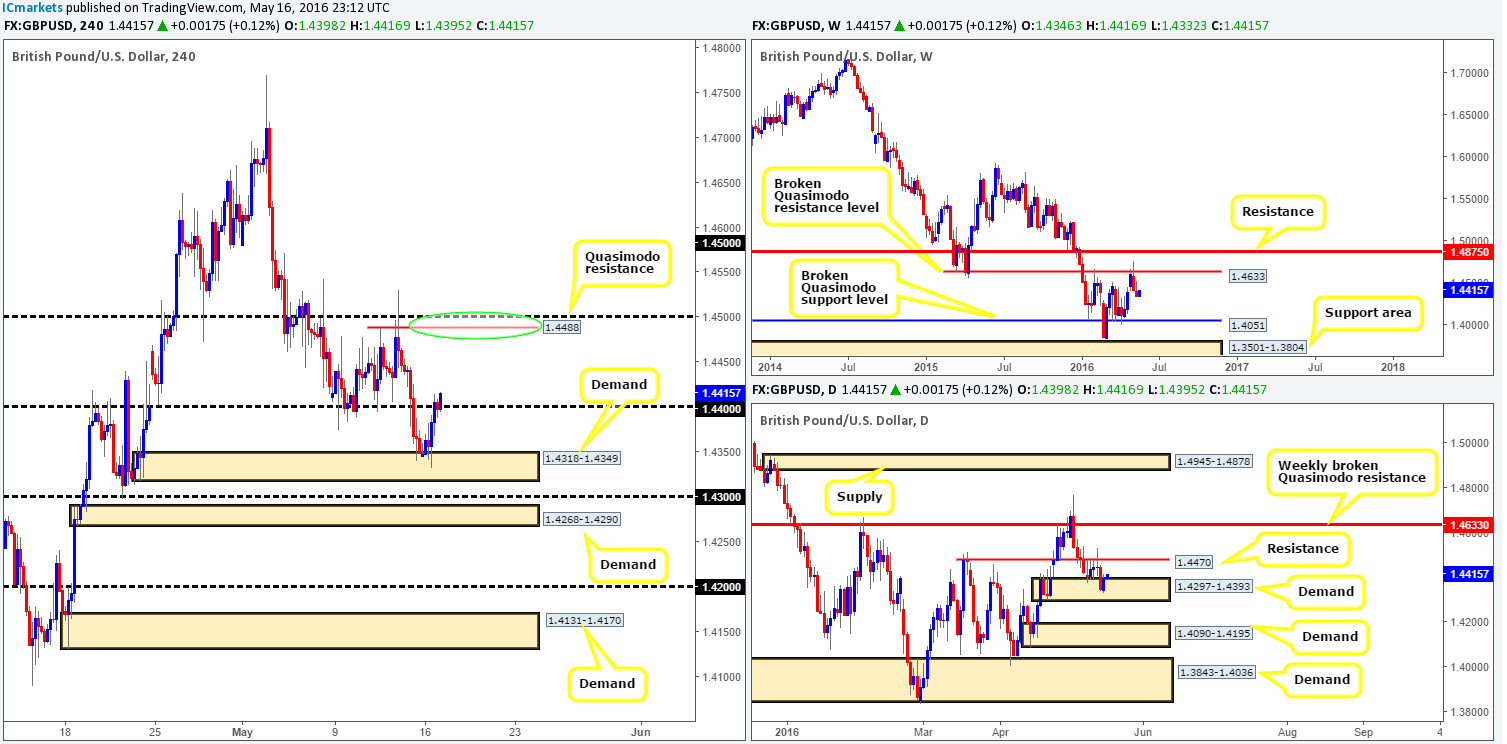
Weekly view: Recent action shows that Cable extended its bounce from the broken Quasimodo resistance line at 1.4633 down to lows of 1.4340 last week. In the event that the bears remain dominant here, further selling could be possible down to 1.4051 – a broken Quasimodo support level.
Daily view: From this angle, demand at 1.4297-1.4393 held firm during yesterday’s session clawing back some of Friday’s losses. Despite this, we do not see this pair trading beyond resistance at 1.4470 this week due to what we’ve noted on the weekly chart.
H4 view: Yesterday’s modest rally from demand at 1.4318-1.4349, as you can see, brought Cable up to psychological resistance 1.44 by the day’s end. Beyond 1.44 is a Quasimodo resistance barrier drawn from 1.4488, which sits only a few pips above the daily resistance line at 1.4470.
Given our notes on both the weekly and daily timeframes (see above), our team has no plan to buy above 1.44 today. What we are interested in, however, is a possible short from the Quasimodo resistance 1.4488. Not only does it converge closely with nearby daily resistance, but it also has the 1.45 handle just above it giving our line extra weight!
Entering into a market position from 1.4488 is a possibility if one is willing to place their stops above the apex of the Quasimodo formation around the 1.4531 mark. If you prefer tighter stops, you may want to consider waiting for lower timeframe confirmation. This could be either a break of a demand and subsequent retest, a trendline break/retest or simply a collection of well-defined selling wicks around a lower-timeframe resistance. Stops are usually placed 5-10 pips beyond confirming structures.
Levels to watch/live orders:
-
Buys: Flat (Stop loss: N/A).
-
Sells: 1.4488 region [Tentative – confirmation required] (Stop loss: dependent on where one confirms this area).
AUD/USD:
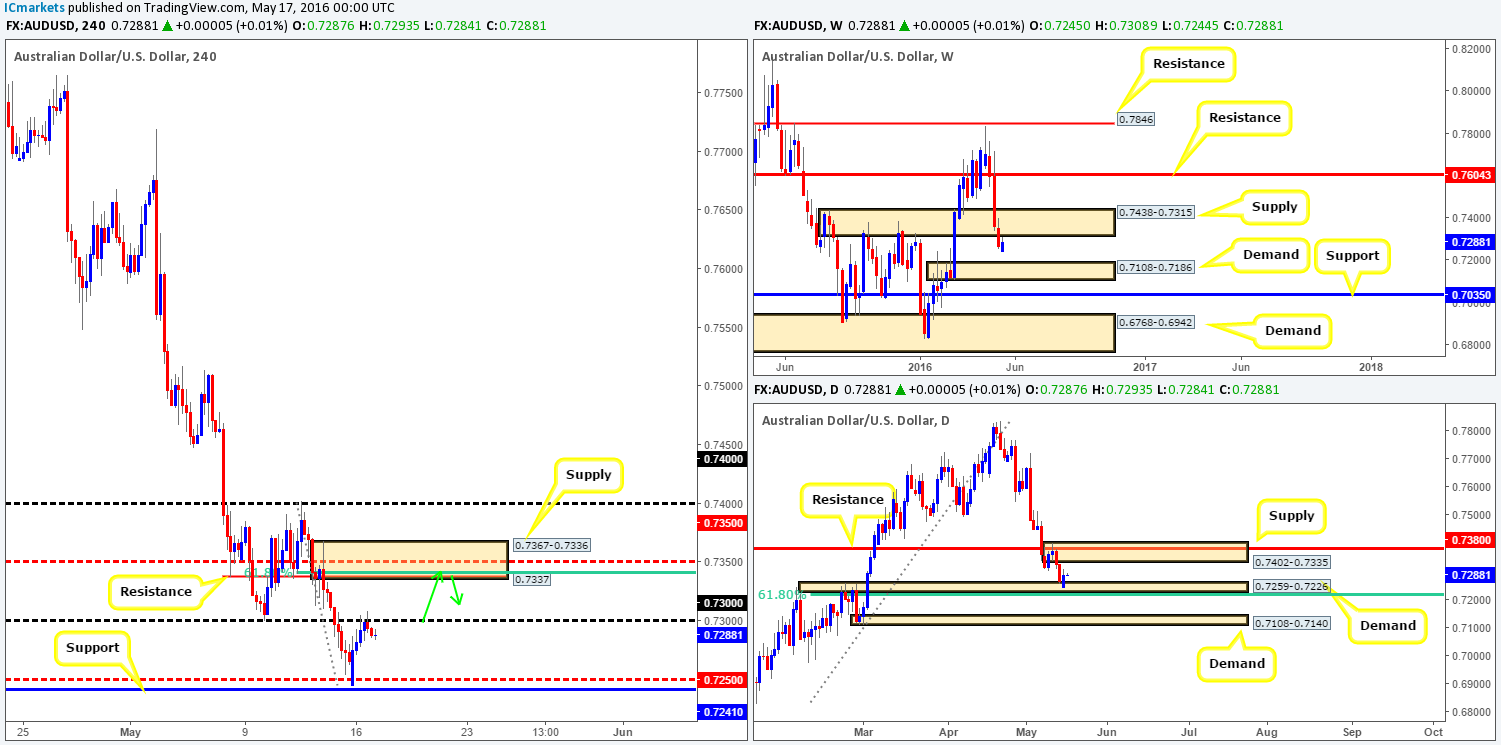
Weekly view: Since the commodity currency peaked at 0.7835 price has fallen sharply for the past three weeks, consequently taking out demand painted at 0.7438-0.7315. With price recently coming within ten pips of retesting this area as supply, this may lead to further selling down to demand coming in at 0.7108-0.7186.
Daily view: In spite of what we’re seeing on the weekly chart, daily price appears to have found a relatively strong foothold within demand at 0.7259-0.7226. To our way of seeing things, this could attract further bids into this market up to supply seen at 0.7402-0.7335 (encapsulates a resistance drawn from 0.7380 and sits within the above said weekly supply).
H4 view: The bounce from mid-way support 0.7250, as shown on the chart, extended higher throughout the course of yesterday’s sessions, bringing the Aussie up to the 0.73 psychological resistance. In light of the higher-timeframe notes, 0.73 is not a level we would feel comfortable selling from. The supply lurking just above at 0.7367-0.7336 is, in our opinion, a far more logical barrier due to the following:
-
Converges with daily supply at 0.7402-0.7335, and by extension converges with weekly supply at 0.7438-0.7315.
-
Boasts H4 resistance at 0.7337.
-
Encapsulates H4 mid-way resistance at 0.7350.
-
61.8% Fibonacci resistance seen at 0.7339.
Therefore, today’s spotlight will firmly be focused on the above said H4 supply for a sell. We are confident that this area will bounce price should the market reach this high so we’ve set a pending sell order at 0.7337 along with a stop-loss above at 0.7371. Partial profits will be taken at 0.73. From there on we’ll reassess structure to determine the next take-profit zone.
Levels to watch/live orders:
-
Buys: Flat (Stop loss: N/A).
-
Sells: 0.7337 [Pending order] (Stop loss: 0.7371).
USD/JPY:
Weekly view: Demand at 105.19-107.54, as can be seen from this angle, continues to provide a floor to this market. On the condition that the bulls remain dominant it is likely that this unit will connect with supply penciled in at 113.80-111.59 sometime soon.
Daily view: Price remains sandwiched between supply at 109.26-109.83 and demand at 107.60-108.35. A clear break higher would likely see daily action challenge resistance given at 110.96, whereas a push lower has the demand zone at 105.19-106.31 (sits within the extremes of the aforementioned weekly demand) to target.
H4 view: Modest gains were posted during yesterday’s trading sessions, forcing the USD/JPY to connect with the 109 handle by the day’s end. In a similar fashion to the daily chart, the H4 also remains consolidating between demand at 108.27-108.44 and supply carved from 109.26-109.49. As a result, much of the following analysis will remain the same as put forward in Monday’s report…
If we look to buy on the basis of price rallying from weekly demand, there’s the 109 handle, the aforementioned supply base and the 110.00 handle to contend with which could repel prices! To that end, what we’re watching for is a close above the 110 handle. This would, as far as we see it, achieve the following:
-
Open the H4 path north up to H4 resistance at 110.84.
-
Push price above the current daily supply at 109.26-109.83 and potentially clear the runway up to daily resistance at 110.96 – a few pips above the H4 line 110.84.
In addition to these two points it would also allow traders the chance to enter long on any retest seen at 110 as per the green arrows. For us to be given the green light to buy, nonetheless, we would require a lower timeframe buy setup to form following the retest of 110. This could be in the form of an engulf of supply, a trendline break/retest or even simply a collection of buying tails around the 110 number.

Levels to watch/live orders:
-
Buys: Watch for price to close above 110 and look to trade any retest seen thereafter (lower timeframe confirmation required).
-
Sells: Flat (Stop loss: N/A).
USD/CAD:
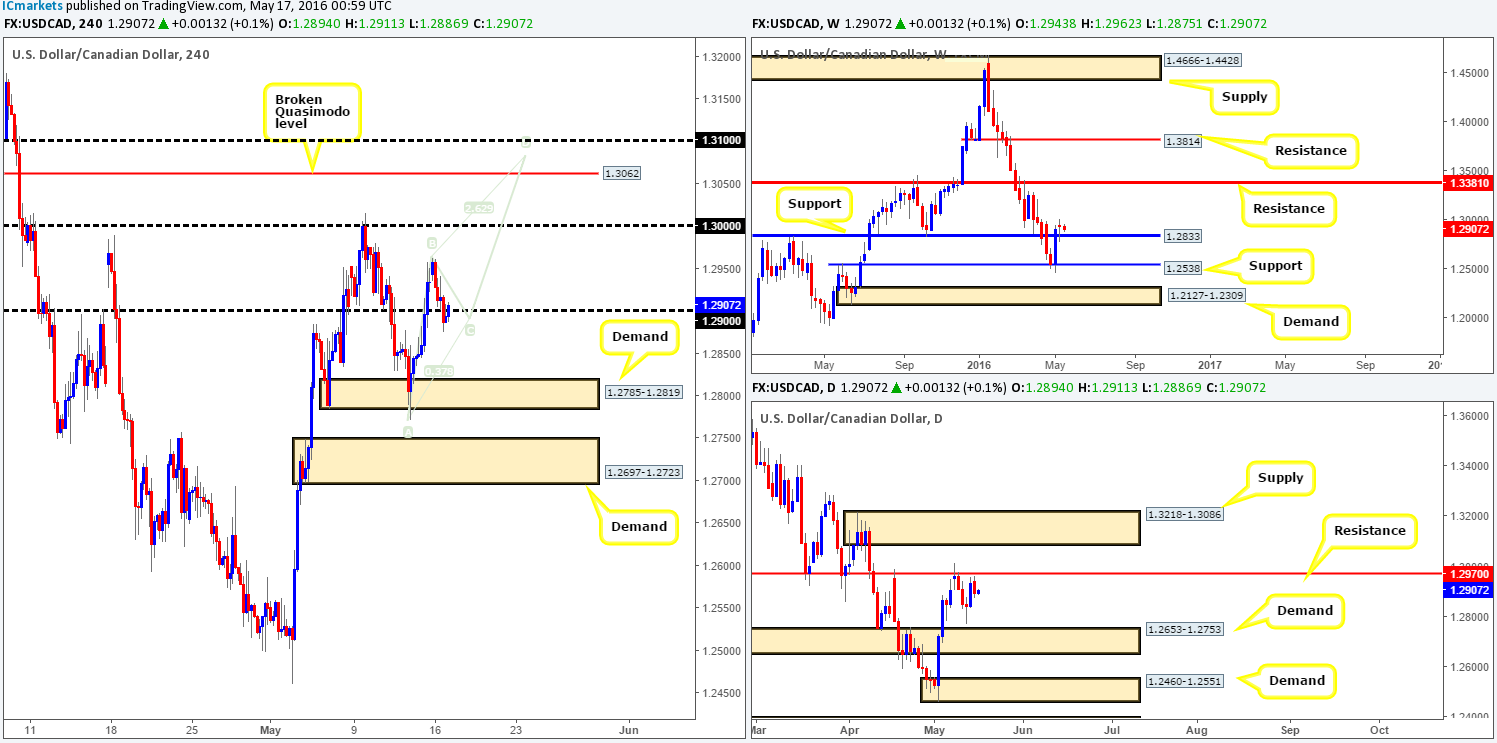
Weekly view: As of now, weekly price is trading from support at 1.2833. The next upside target from this line can be seen at 1.3381 – a clear line of resistance. In the event that the bulls fail to muster enough strength to defend this line, the 1.2538 support will likely be next in the firing range. Something to bear in mind, however, is that oil’s weekly chart shows price currently trading from supply at 48.33-44.54 which may push the Canadian dollar lower and the U.S. dollar higher.
Daily view: Down on the daily chart, the Loonie found active offers a few pips below resistance at 1.2970 yesterday. Further downside from here would likely force this pair into the jaws of demand logged in at 1.2653-1.2753. Meanwhile, a break above the current resistance line places supply at 1.3218-1.3086 on the hit list.
H4 view: Following the open 1.2943, the USD/CAD trickled south down to the 1.29 region. Based on the assumption that 1.29 holds as support today, here are out thoughts going forward:
-
Weekly buyers appear in relatively good shape especially considering that oil now also trades around weekly supply (see above).
-
Daily action is currently trading from resistance, but we feel based on the weekly structure and price also lurking within daily supply on oil at 48.33-46.53, this line will likely cave in (see above).
-
It’s likely only a bounce will be seen at 1.30 should price reach this high due to daily supply sitting above at 1.3218-1.3086.
-
From a close above 1.30, we’d be looking to sell between 1.31 and the H4 Quasimodo resistance at 1.3062 which, as you can see, incorporates a H4 AB=CD completion point (1.3082) and is also bolstered by the daily supply zone just mentioned above.
We would not be comfortable placing a pending sell order here due to weekly price showing room to continue moving north (see above). Waiting for the lower timeframes to prove selling interest resides here is, at least in our opinion, the safer route to take. For ways of confirming a zone, please see the top of this report.
Levels to watch/live orders:
-
Buys: Flat (Stop loss: N/A).
-
Sells: 1.3100/1.3062 [Tentative – confirmation required] (Stop loss: dependent on where one confirms this area).
USD/CHF:
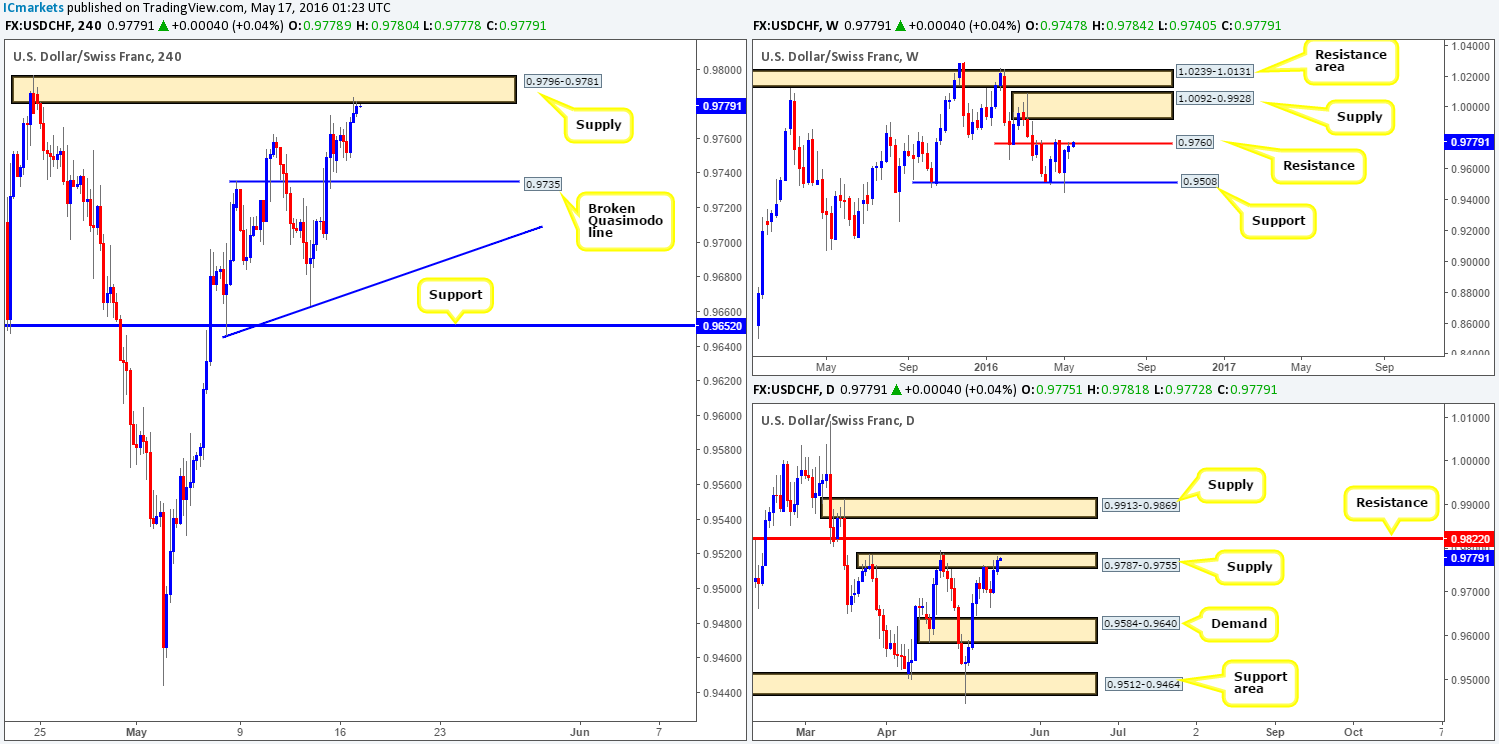
Weekly view: Resistance at 0.9760 was recently brought into view. This line has managed to hold this unit down twice already (28/03/16 – 25/04/16), so it is possible we may see a similar scenario play out here! Should a sell-off come about, the support level at 0.9508 is our next hurdle of interest. Meanwhile, a continuation move higher would likely place supply at 1.0092-0.9928 back in view.
Daily view: The buyers and sellers continue to battle for position within supply seen at 0.9787-0.9755. So far there has been little meaningful selling registered here which could suggest price may head north to resistance penciled in at 0.9822 sometime soon.
H4 view: Over on the H4 chart, we can see that the bid-side of this market came alive going into yesterday’s American session, resulting in the Swissy driving into the jaws of supply chalked up at 0.9796-0.9781. In view of all three timeframes trading around some sort of resistance (see above), the pendulum looks to be swinging toward more of a drop in prices.
Therefore, our outlook for this pair is relatively straightforward – sell! Now, usually in circumstances where each timeframe is trading in unison, we’d look to sell at market from the current H4 supply. However, due to there being little to no selling interest seen within the current daily supply at the moment, we have opted to wait for lower timeframe confirmation (for confirmation techniques, please see the top of this report).
Levels to watch/live orders:
-
Buys: Flat (Stop loss: N/A).
-
Sells: 0.9796-0.9781 [Tentative – confirmation required] (Stop loss: dependent on where one confirms this area).
DOW 30:
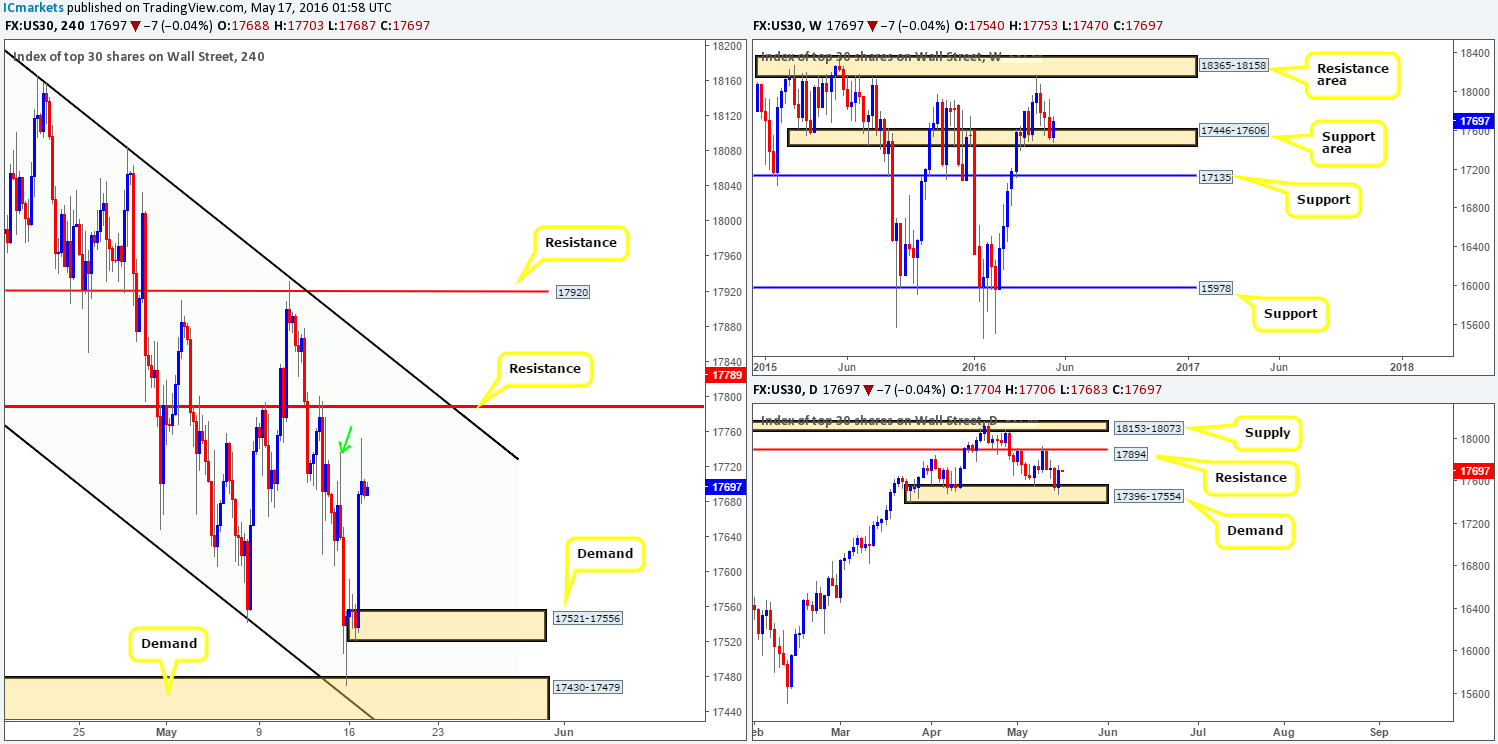
Weekly view: Since price struck the underside of the resistance area at 18365-18158, U.S. stocks have been grinding lower. Presently, however, weekly action is seen bouncing from a support area drawn from 17446-17606.
Daily view: In-line with the weekly chart, the daily chart shows price bounced from demand seen at 17396-17554, forming a pin bar. The pin was formed collectively using both Fridays and Monday’s candle. Assuming this is taken as a bullish signal, this index may see a touch of resistance fixed at 17894.
H4 view: Stepping across to the H4 chart, we can see that there was recently an aggressive bounce to highs of 17753 seen from demand coming in at 17430-17479 (converged with a channel support taken from the low 17776). As things stand on the higher-timeframe picture (see above), we are not really keen on selling right now. In regard to buying, nevertheless, an area that catches our eye at the moment is demand seen at 17521-17556. It has little convergence, but did manage to break above the 17737 high (green arrow), which, to us, suggests bullish strength. On account of this, if price connects with this H4 demand today WITHOUT hitting overhead resistance, we would look to buy from here with lower timeframe confirmation (for confirmation techniques, please see the top of this report).
The reason behind requiring confirmation here when it’s an area that’s supported by higher-timeframe structure is simply because price may fake through this zone and once again tag the demand at 17430-17479.
Levels to watch/live orders:
-
Buys: 17521-17556 [Tentative – confirmation required] (Stop loss: dependent on where one confirms this area).
-
Sells: Flat (Stop loss: N/A).


