A note on lower timeframe confirming price action…
Waiting for lower timeframe confirmation is our main tool to confirm strength within higher timeframe zones, andhas really been the key to our trading success. It takes a little time to understand the subtle nuances, however, as each trade is never the same, but once you master the rhythm so to speak, you will be saved from countless unnecessary losing trades. The following is a list of what we look for:
- A break/retest of supply or demand dependent on which way you’re trading.
- A trendline break/retest.
- Buying/selling tails – essentially we look for a cluster of very obvious spikes off of lower timeframe support and resistance levels within the higher timeframe zone.
- Candlestick patterns. We tend to only stick with pin bars and engulfing bars as these have proven to be the most effective.
For us, lower timeframe confirmation starts on the M15 and finishes up on the H1, since most of our higher timeframe areas begin with the H4.
EUR/USD:
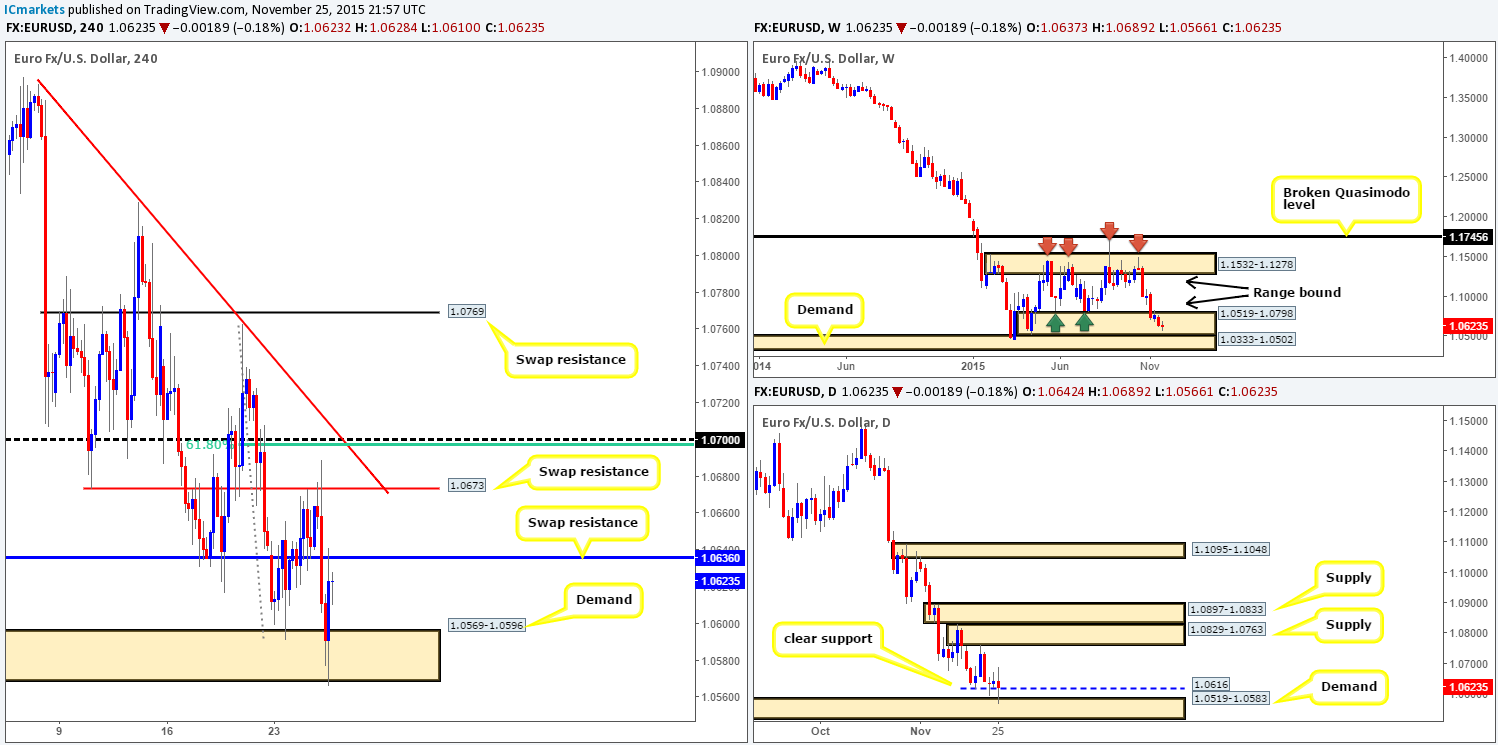
As can be seen from the H4 chart, the EUR fell sharply from the swap resistance level at 1.0673 yesterday during the early hours of London. This lemming-like stampede took out not only the swap support (now resistance) at 1.0636, but also jabbed below demand at 1.0569-1.0596, which, as you can see, was clearly enough to send prices back up to 1.0636 by the day’s end.
Given the above, what’s the vibe like on the higher timeframe picture? Well, up on the weekly chart price continues to loiter within range demand at 1.0519-1.0798, whilst lower down on the daily chart, recent action stabbed below support at 1.0616 and connected with demand at 1.0519-1.0583.
Therefore, should the buyers manage to hold ground above the current daily support, an advance higher could take place. For all that though, let’s not forget that we still have to contend with the H4 swap resistance level at 1.0636. That being the case, what we’re looking for is a break above and retest of this level today to confirm bullish strength exists in this market. If this comes to fruition, out team would begin looking for confirmed longs from here, targeting the swap resistance above at 1.0673, followed closely by psychological resistance 1.0700.
Levels to watch/live orders:
- Buys:Watch for offers to be consumed around 1.0636 and then look to trade any retest seen at this level (confirmation required).
- Sells: Flat (Stop loss: N/A).
GBP/USD:
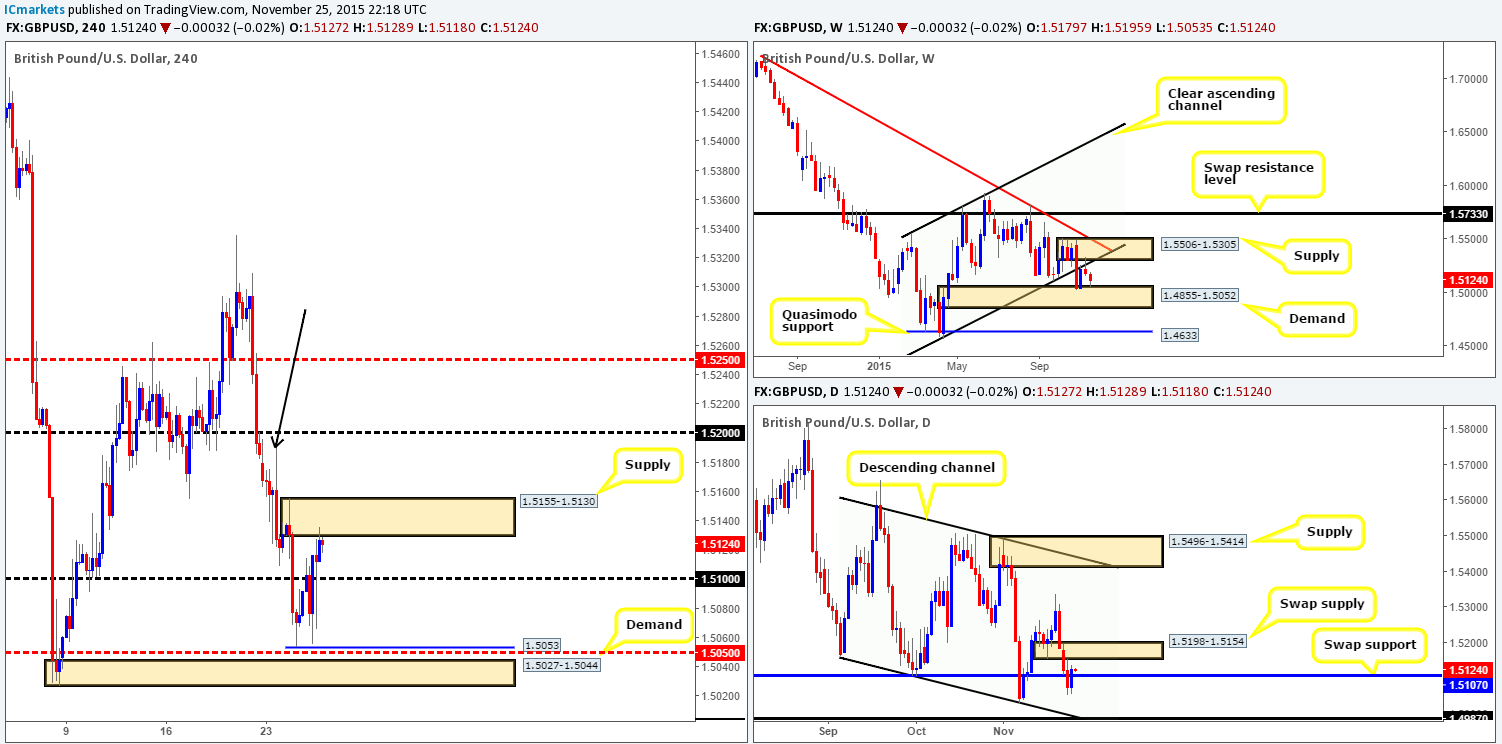
The value of the Pound increased yesterday, resulting in price taking out psychological resistance 1.5100 and connecting with supply drawn from 1.5155-1.5130. From a technical standpoint this advance is not really surprising, since price is currently trading from weekly demand at 1.4855-1.5052. This – coupled with daily action recently closing back above 1.5107 and showing room to appreciate up to at least a swap supply coming in at 1.5198-1.5154 puts the current H4 supply at risk of a fakeout, or worse, being completely ignored.Therefore, the best we’d hope for if we were looking to short this supply is 1.5100.
Assuming that our analysis is correct, beyond the H4 supply zone we see very little resistance stopping price from reaching 1.5200. Check out the large supply consumption wick marked with a black arrow at 1.5189, this suggests to us that the majority of offers have already likely been taken out in this region. To that end, our plan of attack today will consist of waiting for price to break above and retest this supply as demand , thus allowing us to buy (as long as we see confirmation on the lower timeframes) this market up to at least 1.5200.
Levels to watch/ live orders:
- Buys: Watch for offers to be consumed around 1.5155-1.5130 and then look to trade any retest seen at this area (confirmation required).
- Sells: Flat (Stop loss: N/A).
AUD/USD:
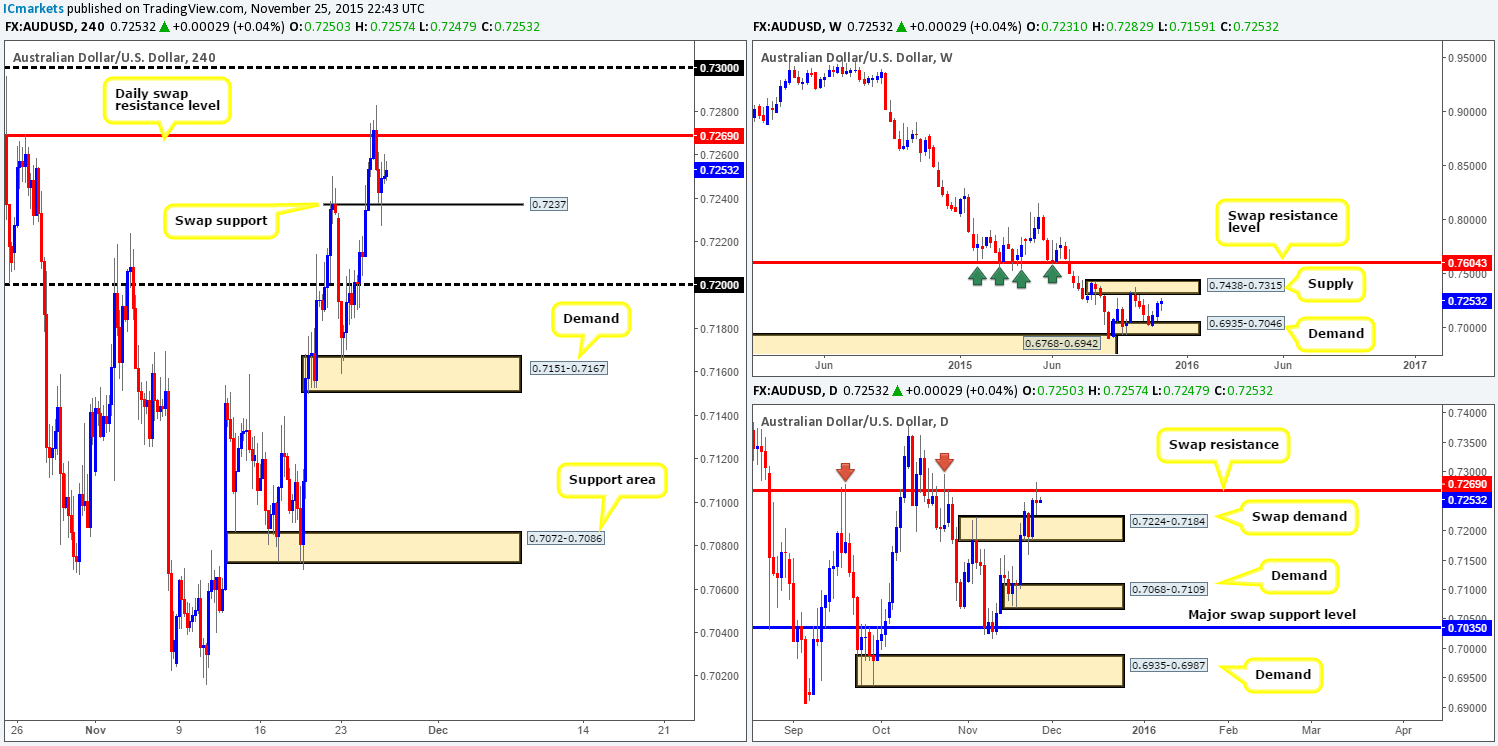
During the course of yesterday’s sessions, the AUD/USD did eventually sell-off from the daily swap resistance level at 0.7269. For those who read our previous report on this pair (http://www.icmarkets.com/blog/wednesday-25th-november-keep-an-eye-on-the-u-s-dollar-around-1-30pm-gmt-volatility-expected/), you may recall us mentioning that we would, depending on how the lower timeframe action behaved here, look to short. Unfortunately, we could find little reason to sell here, which is a shame since price dropped nicely down to the H4 swap support barrier drawn from 0.7237.
Taking into consideration that H4 action is now effectively trading mid-range, how do things stand on the higher timeframes? Well, weekly action still appears to be heading in the direction of supply coming in at 0.7438-0.7315, whilst yesterday’s trade caused price to print a daily indecision candle between the above said daily swap level and a daily swap (demand) at 0.7224-0.7184.
So, with the above in mind, here is our two pips’ worth on possible direction…
- Just to be clear we have little interest in trading between 0.7237/0.7269 UNLESS an extremely favorable lower timeframe setup is seen.
- Also, we would not be at all keen on shorting this market should price break below 0.7237. Not only is there room being seen to appreciate on the weekly timeframe, but shorting below would 0.7237 place you against any daily flow from within the swap demand mentioned above at 0.7224-0.7184.
- The only logical alternative we see here is looking to trade the break and (confirmed) retest of 0.7269, targeting psychological resistance 0.7300, followed by supply at 0.7346-0.7324. Be careful here though traders as this supply is glued to the underside of the aforementioned weekly supply.
Levels to watch/ live orders:
- Buys: 0.7237 [Tentative – confirmation required] (Stop loss: dependent on where one confirms this level) watch for offers to be consumed around 0.7269 and then look to trade any retest seen at this level (confirmation required).
- Sells:0.7269 [Tentative – confirmation required] (Stop loss: dependent on where one confirms this level).
USD/JPY: (Slightly revised)
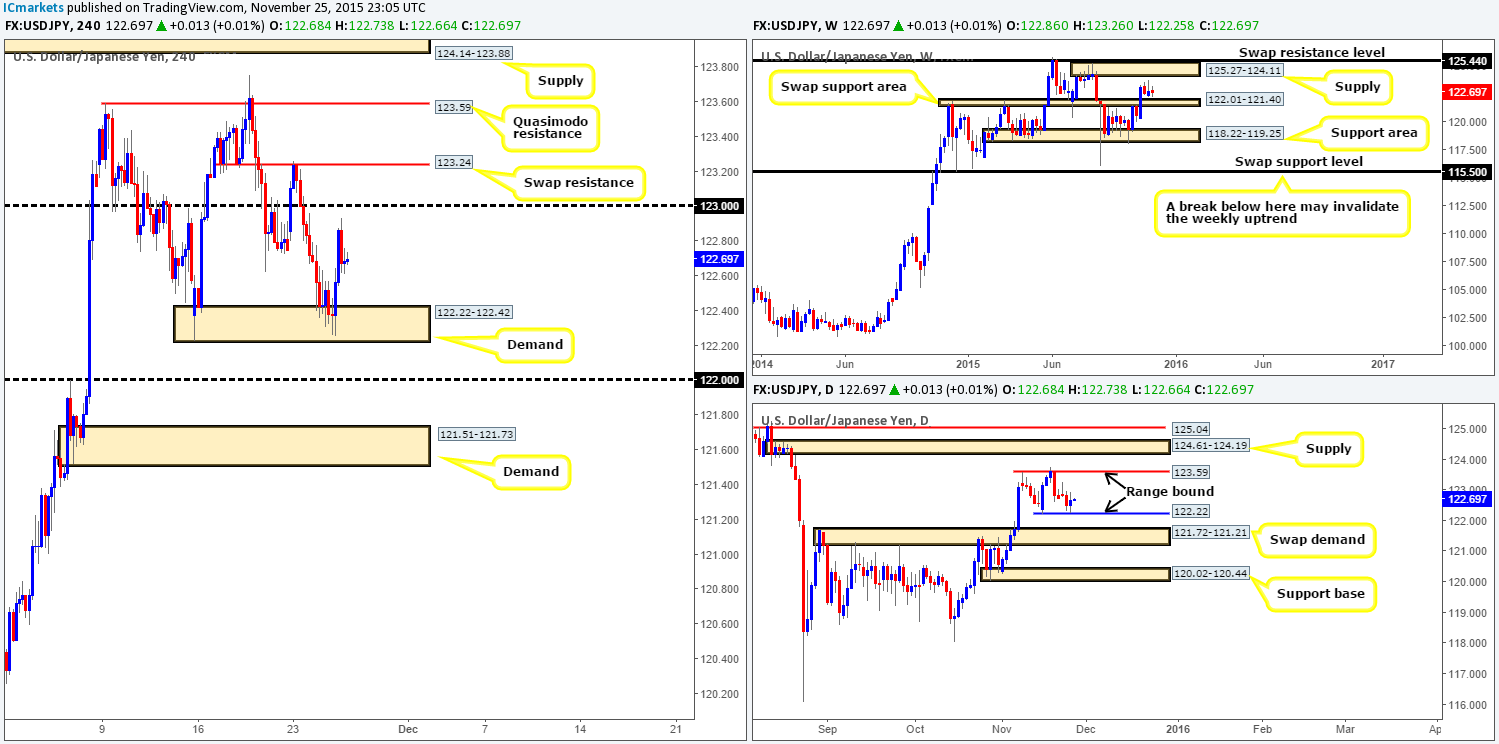
Kicking off this morning’s analysis with a look at the weekly chart shows price remains loitering between a swap support area at 122.01-121.40 and a supply area seen at 125.27-124.11. Down on the daily timeframe, however, we can see that price has begun to carve out a consolidation zone fixed between 123.59/122.22.
Turning our attention to the H4 timeframe, priceresponded beautifully to the H4 demand yesterday coming in at 122.22-122.42, reaching highs of 122.93 on the day. Now, given the position of price on the daily timeframe, here’s what levels we’re looking at today and possibly tomorrow:
- Granted, demand at 122.22-122.42 could potentially see another bounce higher, but what we’re really interested in right now is psychological support below it at 122.00, as this beauty lines up perfectly with the top-side of the aforementioned weekly swap (support) area.
- Psychological resistance 123.00 and the swap resistance just above it at 123.24 both could potentially see reactions, but not much more than a quick intraday bounce in our opinion. The Quasimodo resistance at 123.59 on the other hand may see a stronger move, due to it being closely related to the mid-level resistance 123.50, and also because it represents the upper limit of the daily range.
- Also, do keep a tab on the supply sitting at 124.14-123.88. Not only is this area glued to the underside of the weekly supply mentioned above at 125.27-124.11, but it is also positioned just below daily supply seen at 124.61-124.19.
Levels to watch/ live orders:
- Buys: 122.22-122.42 [Tentative – confirmation required] (Stop loss: around 122.86) 122.00 [Tentative – confirmation required] (Stop loss: dependent on where one confirms this level).
- Sells: 123.59 [Tentative – confirmation required] (Stop loss: dependent on where one confirms this level) 124.14-123.88 [Tentative – confirmation required] (Stop loss: dependent on where one confirms this area).
USD/CAD:
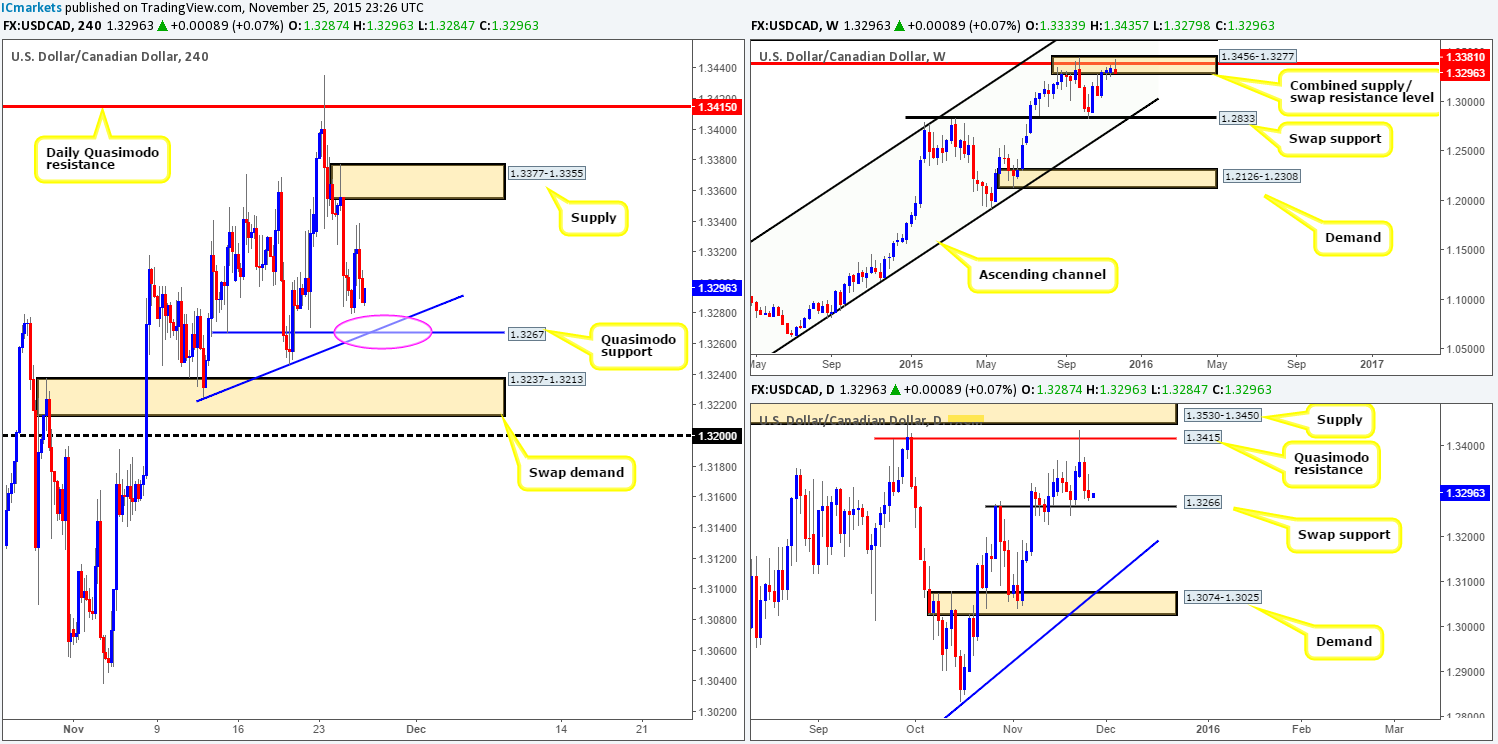
During the early hours of London the USD/CAD catapulted itself north from the 1.3280 region, aggressively trading up to highs of 1.3339, before just as aggressively dropping back down to lows of 1.3279 by the day’s end. As a consequence, we still have the Quasimodo support level seen below at 1.3267 (pink circle) on our radar today.
Not only does this barrier converge nicely with a trendline extended from the low 1.3224, it also coincides with a daily swap (support) level seen at 1.3266, thus likely providing a strong ‘floor’ in which to look to buy from. However, as solid as this buy zone sounds, we still have to take into consideration the fact that price is currently trading from a combined weekly supply/swap resistance area at 1.3456-1.3277/1.3381. This certainly does not mean that the H4 Quasimodo level will not hold if price reaches here, all it means is that we should only enter long from here with corresponding lower timeframe price action and be prudent with taking profits.
Levels to watch/ live orders:
- Buys: 1.3267 [Tentative – confirmation required] (Stop loss: dependent on where one confirms this level).
- Sells: Flat (Stop loss: N/A).
USD/CHF:
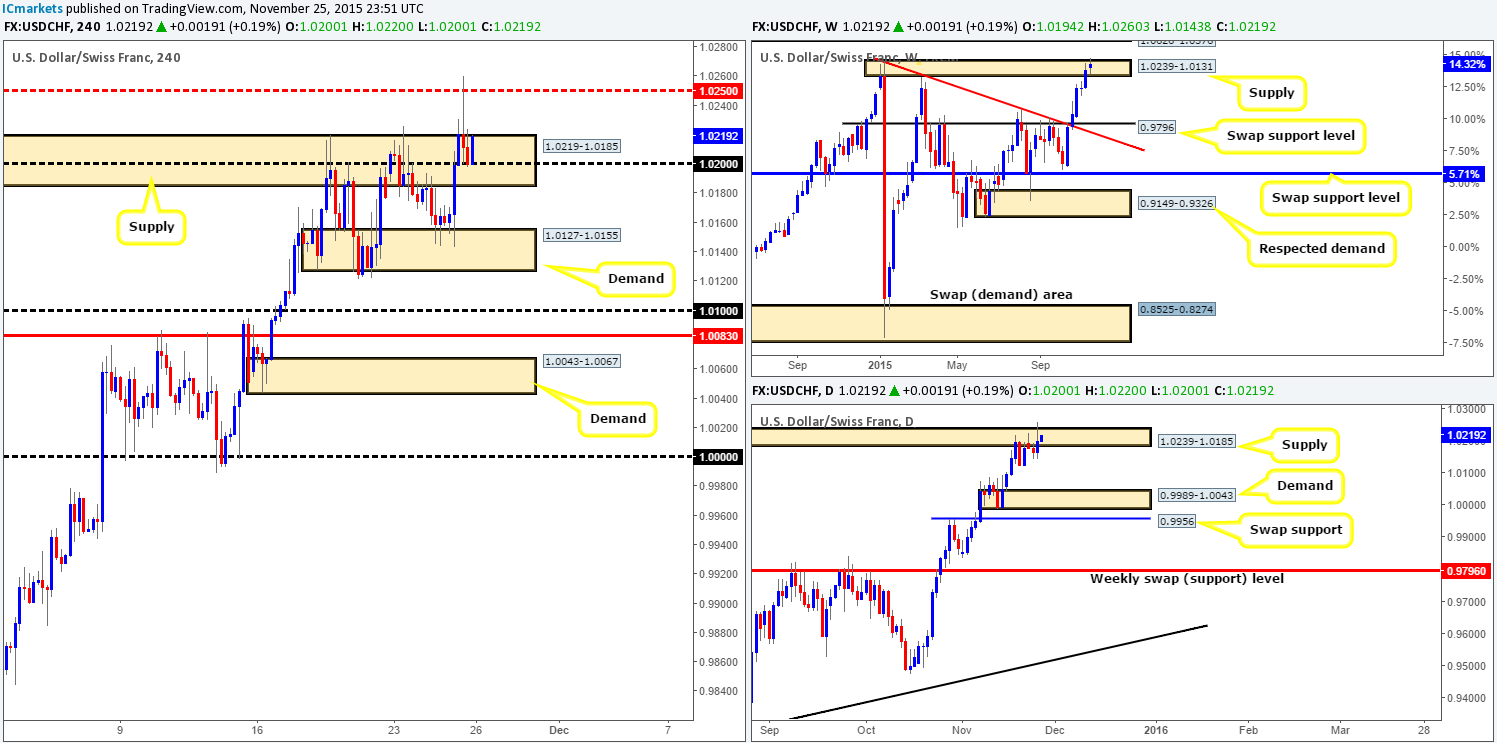
Starting from the top this morning, we can see that weekly action has pierced above the current supply visible at 1.0239-1.0131, which may have opened the trapdoor to further upside towards supply at 1.0626-1.0376. By the same token, the weekly’s partner supply on the daily timeframe 1.0239-1.0185 was also spiked, potentially clearing the path north up to 1.0388 – a swap resistance level positioned just within the weekly supply mentioned above at 1.0626-1.0376.
Down on the H4 timeframe, however, supply at 1.0219-1.0185 was also aggressively spiked, forcing price to hit and rebound from the mid-level resistance 1.0250downto psychological support 1.0200. Given the situation on the higher timeframe picture (see above), if 1.0200 continues to hold firm and we are able to spot a (lower timeframe) confirmed setup here, we’d test the waters and jump in long, targeting 1.0250 first and foremost.
Levels to watch/ live orders:
- Buys: 1.0200[Tentative – confirmation required] (Stop loss: dependent on where one confirms this level).
- Sells: Flat (Stop loss: N/A).
DOW 30:
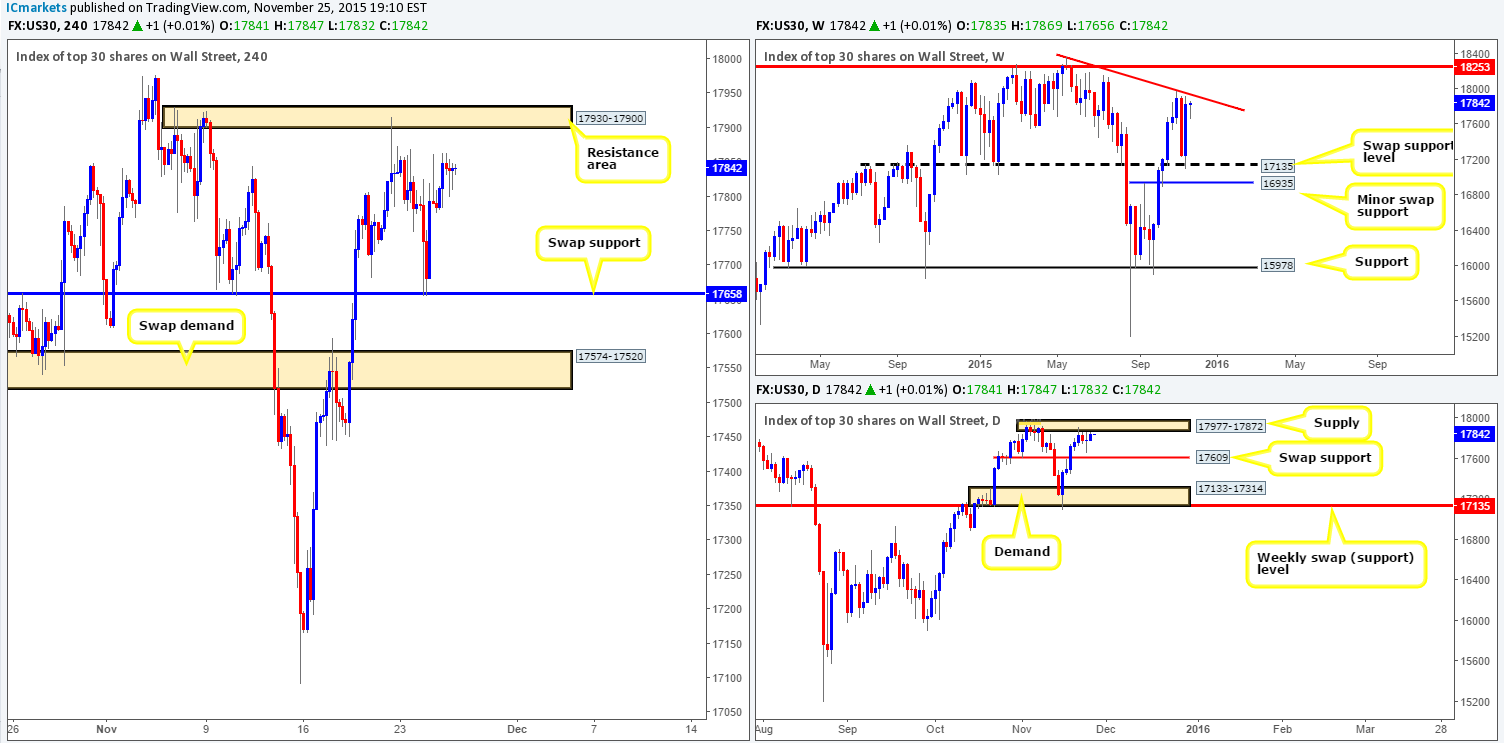
Yesterday’s action on the DOW was sluggish to say the least. Session highs were recorded at 17864, whilst the low for the day came in at 17781. Consequent to this lackluster performance, much of the following report will be similar to the previous…
Beginning with the weekly timeframe, we can see that price remains trading around the underside of the trendline resistance extended from the high 18365. In the event of a break above this line, we can likely expect a sharp rally up to the 18250 region. Down on the daily timeframe, however, the buyers and sellers continue to battle for position beneath supply coming in at 17977-17872. Should the sellers come out victorious here, the next downside target to be aware of is the swap support barrier seen at 17609.
Given that price is currently trading mid-range between a resistance area drawn from 17930-17900 (positioned nicely around the weekly trendline barrier) and a swap support level seen at 17658, where do we go from here? Well, our team is still very interested in shorting from the current H4 resistance area today. However, we will not be placing a pending sell order here due to this zone being relatively small and thus prone to a possible fakeout.
Regarding the current H4 swap support, nonetheless, we would advise caution here. Reason being is price could effectively ignore this level altogether and head directly to the daily swap support barrier mentioned above at 17609.
Levels to watch/ live orders:
- Buys: 17658 [Tentative – confirmation required] (Stop loss: dependent on where one confirms this level).
- Sells: 17930-17900 [Tentative – confirmation required] (Stop loss: dependent on where one confirms this area).
XAU/USD: (Gold)
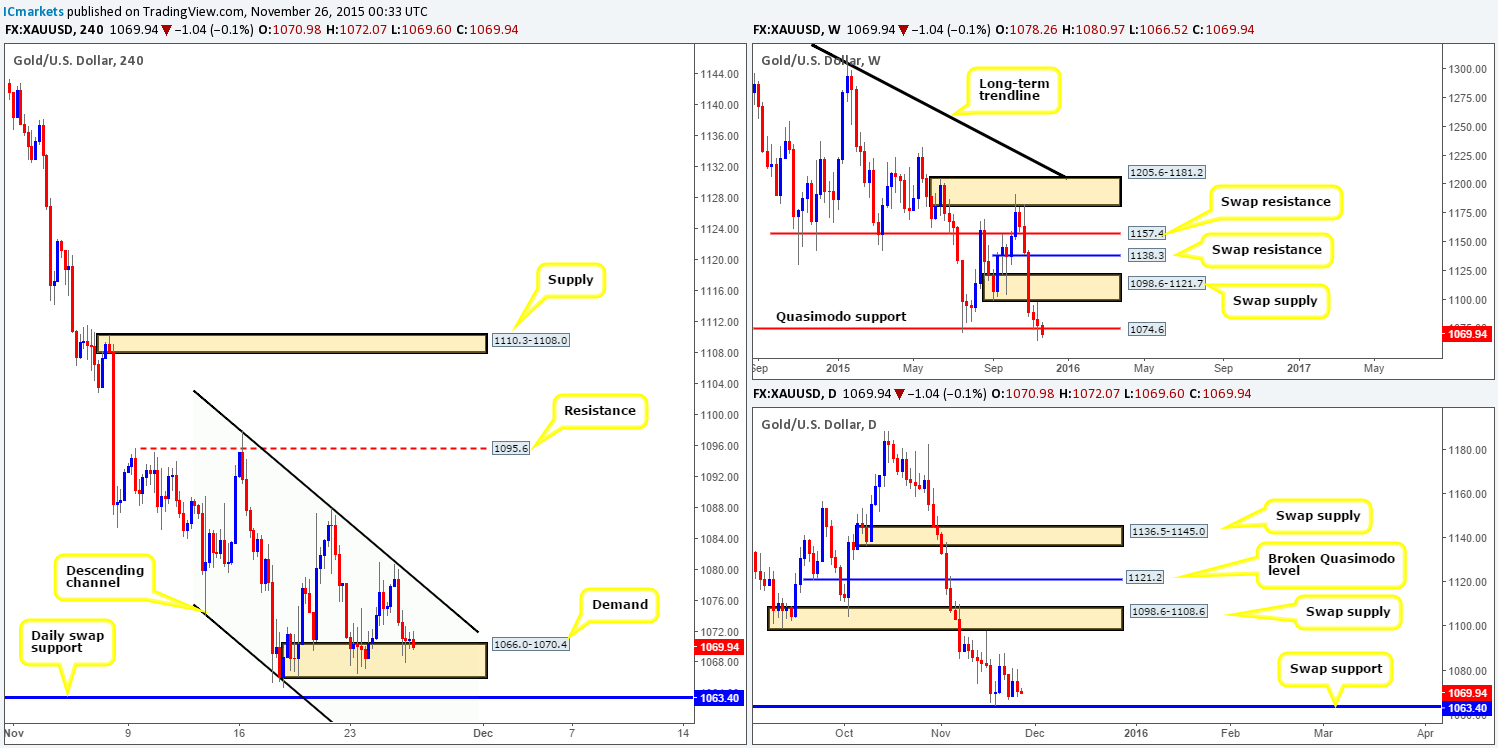
Looking at Gold’sH4 chart this morning, we can see that strong sellers stepped in from the channel resistance (1097.9 – a noted area in our previous report to look for confirmed shorts) and pummeled this market lower during the early hours of London trade. This dragged price back down into the jaws of demand coming in at 1066.0-1070.4, which, as you can see, is so far holding firm.
Consequent to the above, we still have our eye on the stop orders below this H4 demand. If we think about it logically for a minute, the sell orders below this area (both from traders long this demand and traders looking to trade the break) add up to a nice pool of liquidity for buyers just above this daily swap support, which is where we will be looking for a confirmed long into this market.
The reason, however, for still requiring lower timeframe confirmation at this daily level is simply because price appears very unstable around the weekly Quasimodo support level at 1074.6 right now.
Levels to watch/live orders:
- Buys: 1063.4 [Tentative – confirmation required] (Stop loss: dependent on where one confirms this level).
- Sells: Flat (Stop loss: N/A).