A note on lower timeframe confirming price action…
Waiting for lower timeframe confirmation is our main tool to confirm strength within higher timeframe zones, andhas really been the key to our trading success. It takes a little time to understand the subtle nuances, however, as each trade is never the same, but once you master the rhythm so to speak, you will be saved from countless unnecessary losing trades. The following is a list of what we look for:
- A break/retest of supply or demand dependent on which way you’re trading.
- A trendline break/retest.
- Buying/selling tails – essentially we look for a cluster of very obvious spikes off of lower timeframe support and resistance levels within the higher timeframe zone.
- Candlestick patterns. We tend to only stick with pin bars and engulfing bars as these have proven to be the most effective.
For us, lower timeframe confirmation starts on the M15 and finishes up on the H1, since most of our higher timeframe areas begin with the H4.
EUR/USD:
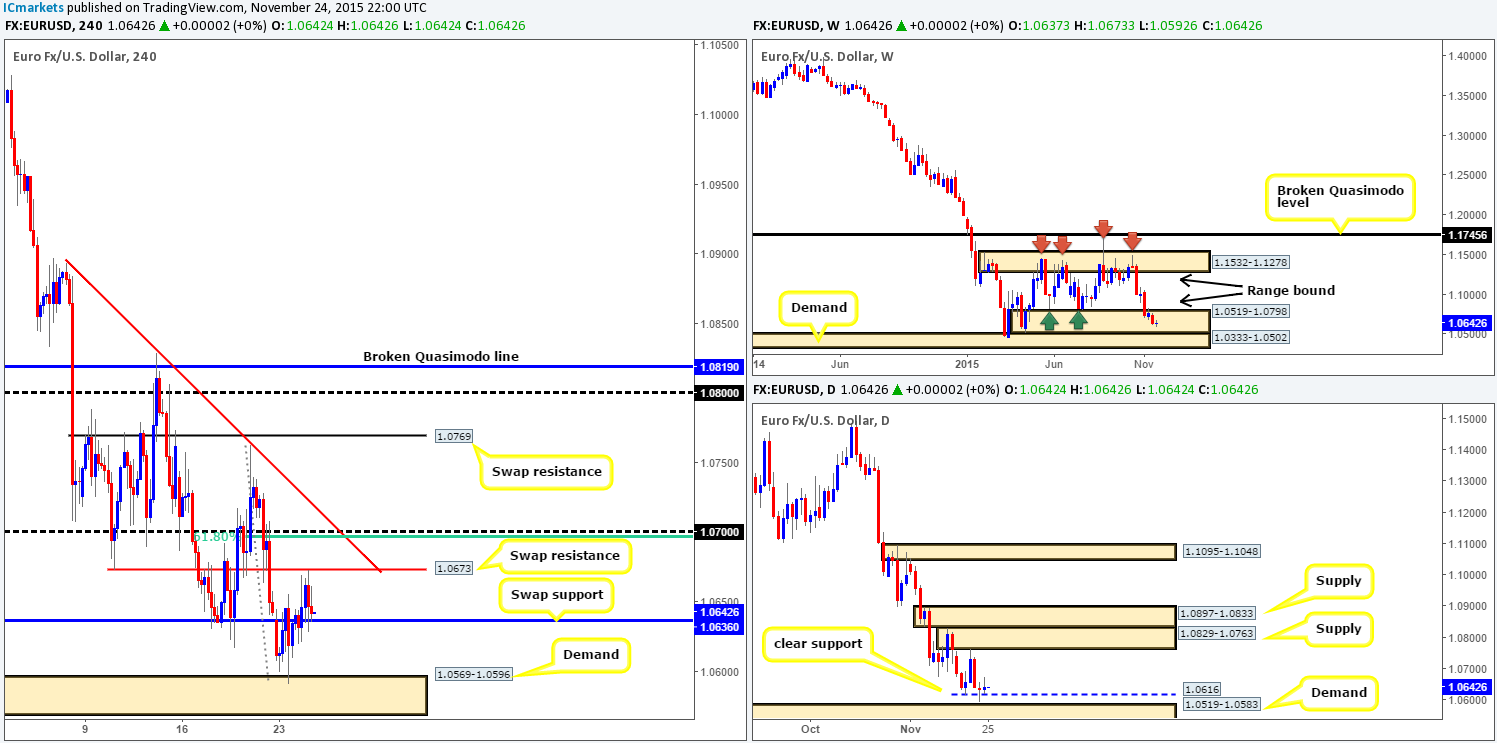
Following Monday’s rebound from H4 demand at 1.0569-1.0596 the EUR sluggishly continued to advance north. As you can see, thistook out the H4 swap resistance (now support) at 1.0636 and ended with price hitting and respecting another swap resistance barrier just above it at 1.0673.
With weekly action showing very little bullish interest within range demand at 1.0519-1.0798, and daily movement, albeit holding above support at 1.0616, also looking very weak, we see this pair (technically) heading lower. That being said though, we have both the U.S. core durable goods data and the unemployment claims to look forward to today at 1.30pm GMT, and this could very well send the market either way.
Given the above in bold, technically, there is only one level that really sticks out to us this morning and that is psychological resistance 1.0700. Not only does this number boast 61.8% Fibonacci resistance at 1.0696, it also ties in nicely with trendline resistance taken from the high 1.0893. How to trade this level is of course down to the individual trader. We, however, would not be comfortable simply placing a pending sell order here and hoping for the best. We’d require lower timeframe confirming price action to be seen before taking a trade, which may be asking too much if price hits during news time!
Levels to watch/live orders:
- Buys:Flat (Stop loss: N/A).
- Sells: 1.0700 [Tentative – confirmation required] (Stop loss: dependent on where one confirms this level).
GBP/USD:
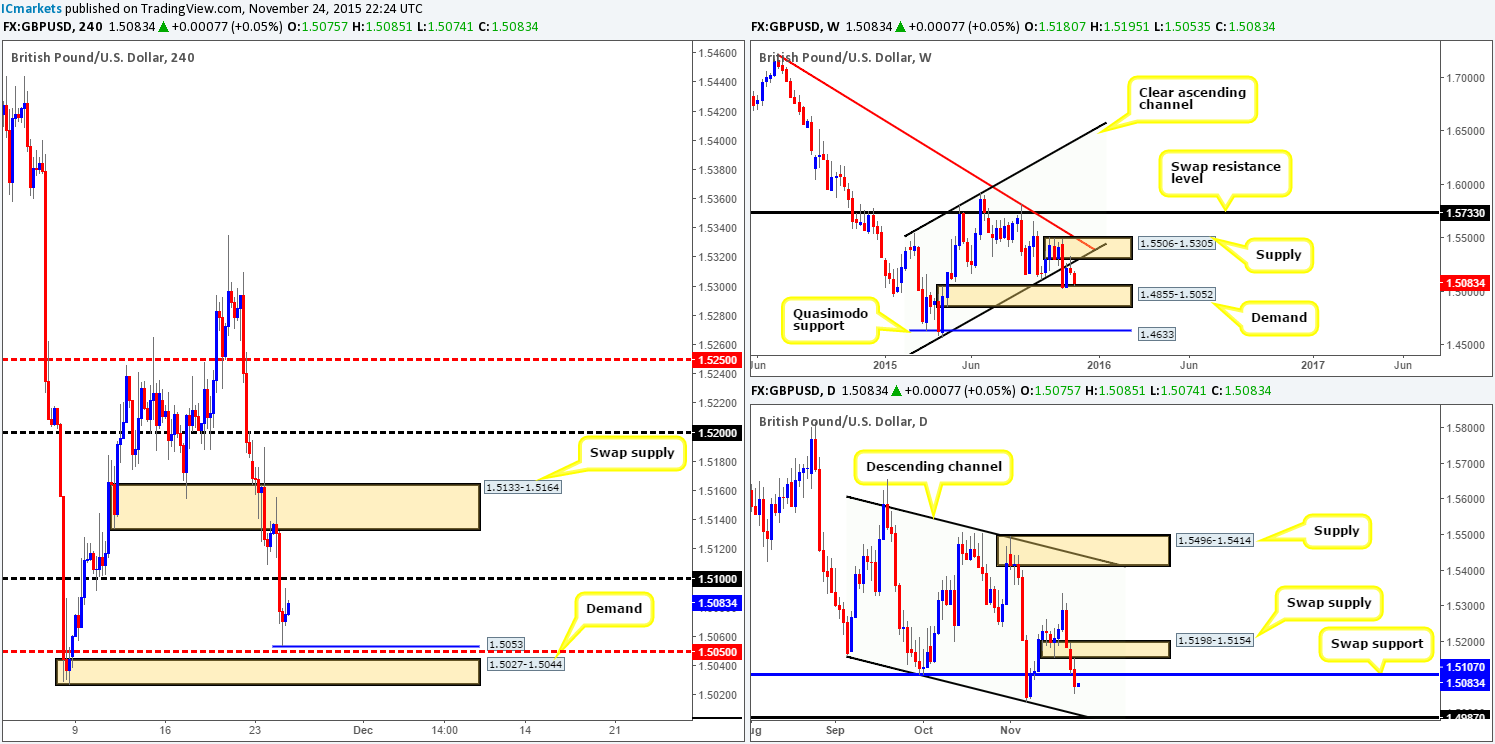
Cable is trading markedly lower this morning, as a heavy round of selling was seen following the retest of a swap supply area at 1.5133-1.5164going into London trade. Bids at psychological support 1.5100 were completely wiped out with price ending the day reaching lows of 1.5053.
Consequent to this recent decline, market action on the weekly chart is now kissing the top-side of demand coming in at 1.4855-1.5052. Meanwhile, down on the daily chart, price has closed below the swap support level at 1.5107.
Given this, we now have our eye on both H4 demand drawn from 1.5027-1.5044 and the large psychological number below it at 1.5000. Why this demand? Well, take a look what is lurking above it. There’s both mid-level support 1.5050 and also yesterday’s low 1.5053, and traders love to place their stops below prior lows! This will be especially prominent on the lower timeframes where traders will likely not even notice the H4 demand sitting directly below. All of this coupled with this H4 demand sitting on top of the above said weekly demand base makes this area worth noting for a potential trade today. Despite this, we would still require lower timeframe confirming price action to be seen here, since thirty or so pips below the current demand sits 1.5000. Not only is this number lodged deep within the aforementioned weekly demand, it also ties in quite nicely with both the daily descending channel support extended from the low 1.5162and a swap support at 1.4987. Therefore, price could just as easily break through this demand and head for 1.5000 before rallying higher.
Levels to watch/ live orders:
- Buys: 1.5027-1.5044 [Tentative – confirmation required] (Stop loss: dependent on where one confirms this area) 1.5000 [Confirmation also required here to avoid being stopped on a fakeout] (Stop loss: dependent on where one confirms this level).
- Sells: Flat (Stop loss: N/A).
AUD/USD:
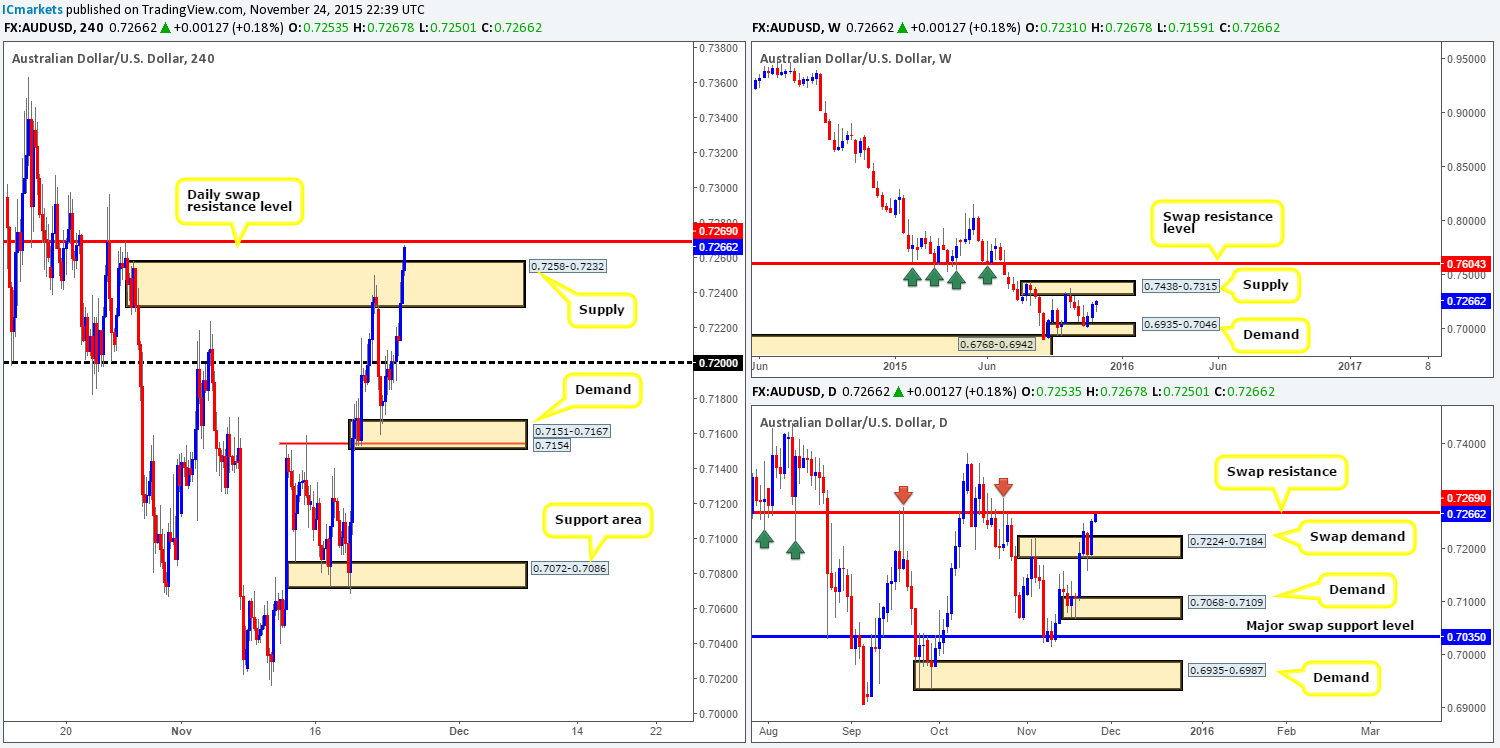
Kicking off this morning’s analysis with a look at the weekly chart shows that price appears to be heading in the direction of supply coming in at 0.7438-0.7315. Be that as it may, down on the daily chart we can see that although the Aussie recently pushed higher from swap demand at 0.7224-0.7184, there is an oncoming swap resistance level lurking directly above it at 0.7269.
Moving down a level to the H4, the recent buying seen on this pair did, as we reported it may do, eventually take out psychological resistance 0.7200. Unfortunately though, there was no retest seen at this number before price rallied into supply at 0.7258-0.7232.
Seeing as how price is currently chewing on the last remaining offers around this supply, we feel it is highly likely candle action will continue to advance. As a result, this will take out stops from traders who shorted here and also trigger in breakout buyers’ orders. All of these buys will effectively create a nice pool of liquidity to sell into from the daily swap (resistance) level mentioned above at 0.7269.
Now, we are definitely not saying this daily level is good enough for a pending sell order, far from it! What we are saying though is a bounce from this region is likely – just look at how responsive it has been on the daily chart in the past (see arrows). That said, there is currently room for price to appreciate on the weekly chart (see above), so we will only trade this daily level when, or indeed if, the lower timeframes prove selling strength exists.
Levels to watch/ live orders:
- Buys: Flat (Stop loss: N/A).
- Sells:0.7269 region [Tentative – confirmation required] (Stop loss: dependent on where one confirms this area).
USD/JPY:
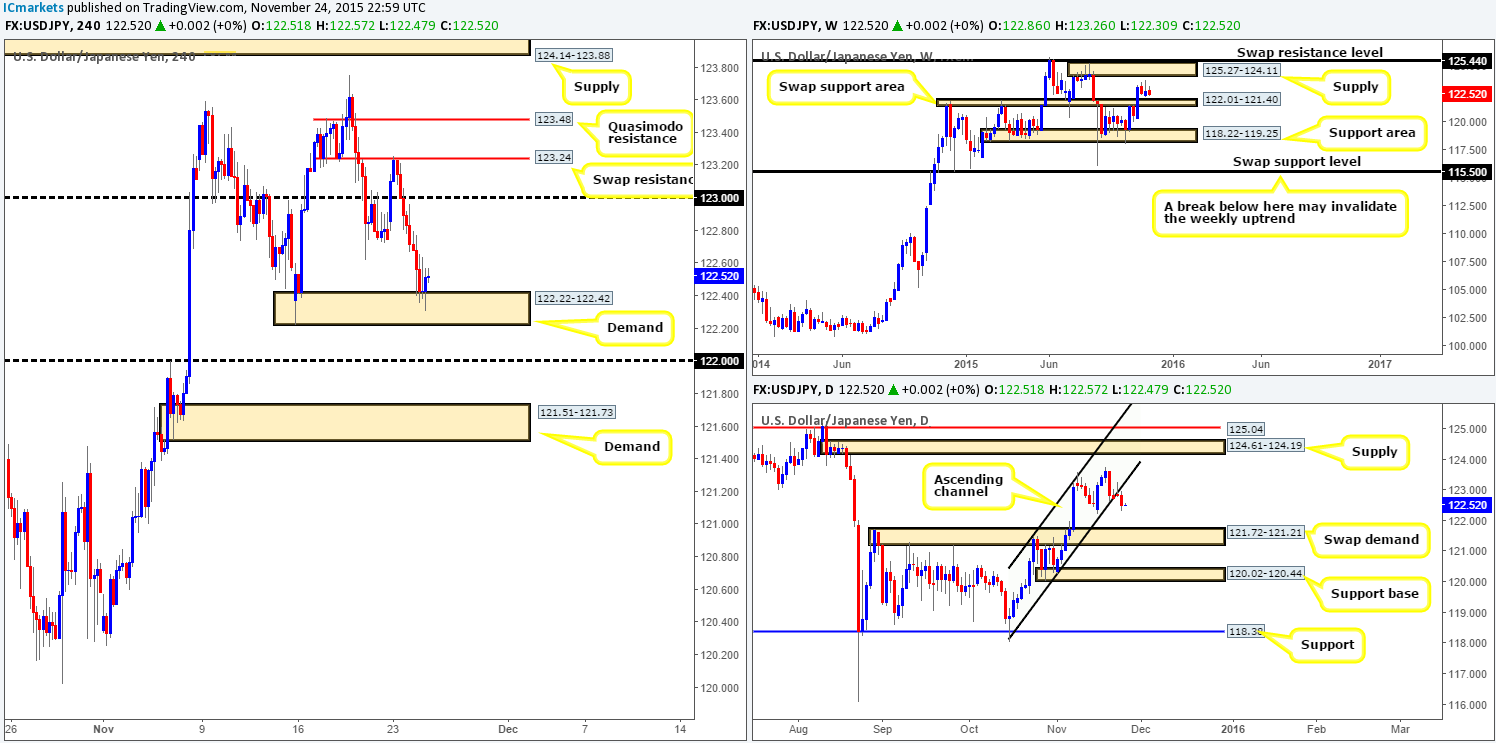
During the early hours of yesterday’s trade the USD/JPY sold off. This brought price down into the jaws of demand coming in at 122.22-122.42, which then saw this market enter into a phase of consolidation for the remainder of the day.
In regard to price trading at a particularly nice-looking demand area right now, would we consider this a stable enough platform to buy from today? Personally, no we would not. Here’s why: weekly action is offering little support to this zone as it continues to trade mid-range between a swap support area at 122.01-121.40 and a supply area seen at 125.27-124.11. Furthermore, there was also a clean break below the daily ascending channel support (118.06) yesterday, suggesting market weakness and possible further downside to the daily swap (support) area at 121.72-121.21.
So where does this leave us? Well as we mentioned in yesterday’s report, the only areas we are interested in trading right now are noted below – everything else in between is considered low probability in our book.
- The psychological number 122.00 and demand sitting below it at 121.51-121.73. Both of these areas are associated with the weekly support area mentioned above.
- Also, do keep a tab on the supply sitting at 124.14-123.88. Not only is this beauty glued to the underside of the weekly supply mentioned above at 125.27-124.11, but it is also positioned just below daily supply seen at 124.61-124.19.
Levels to watch/ live orders:
- Buys:122.00/121.51-121.73 (Keep these areas in mind).
- Sells:124.14-123.88 (Keep this area in mind).
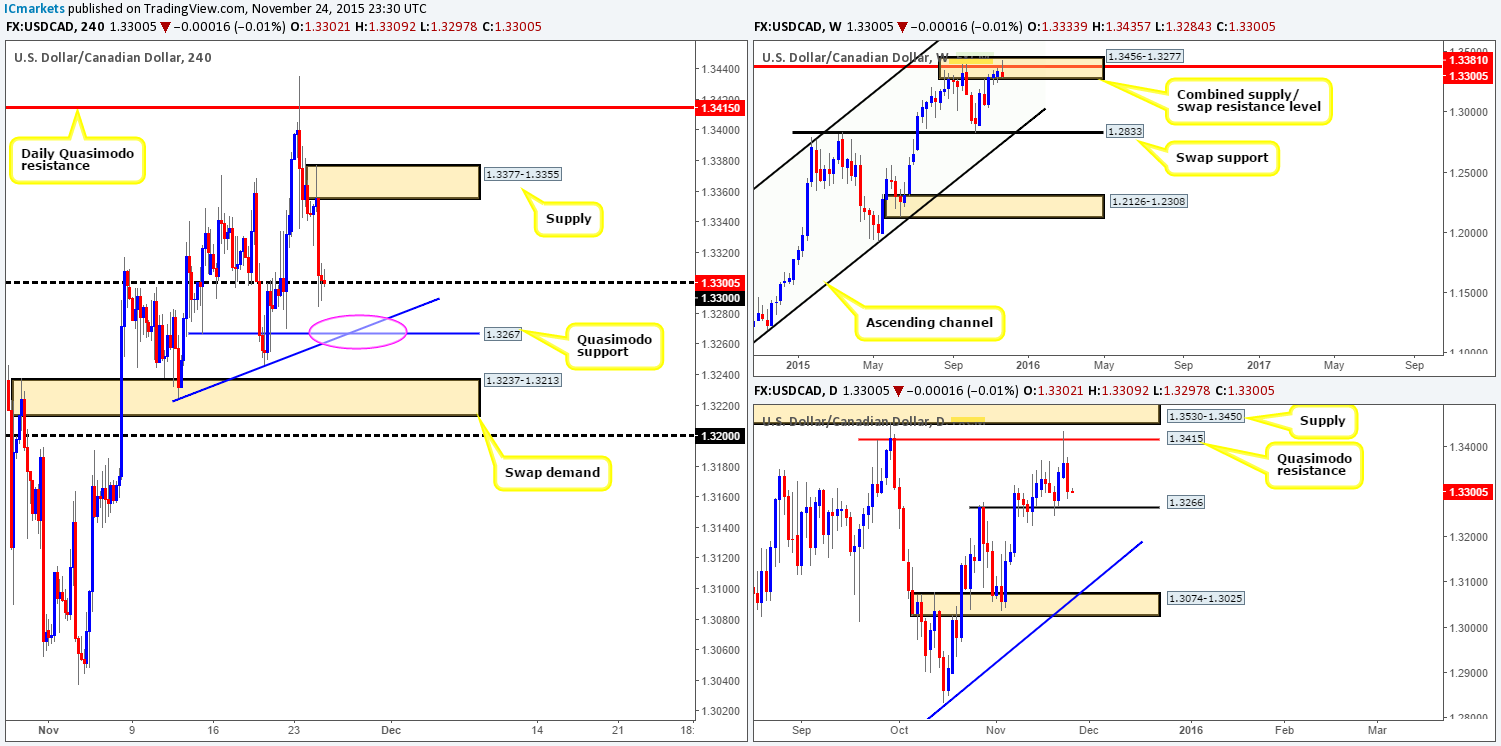
USD/CAD:
Consequent to a sharp sell-off going into the U.S. open yesterday, price is now seen teasing psychological support 1.3300. Should this level remain strong going into today’s more liquid sessions, we may see price reverse from here and test supply coming in at 1.3377-1.3355. On the other hand, a break below 1.3300 could force the Loonie to cross swords with Quasimodo support drawn from 1.3267.
Given that there is space to move lower on the daily timeframe down to swap support at 1.3266 (a pip’s difference to that of the H4 Quasimodo support), and the fact that the sellers nowappear strong from the combined weekly supply/swap resistance area at 1.3456-1.3277/1.3381, we’re going to be watching the above said Quasimodo support like a hawk today for confirmed longs into this market. In addition to the above, this Quasimodo level also converges beautifully with a trendline extended from the low 1.3224.
Should we manage to enter long around this region, we’ll be eyeing 1.3300 as our immediate take-profit target, followed by the supply area above at 1.3377-1.3355.
Levels to watch/ live orders:
- Buys:1.3267 [Tentative – confirmation required] (Stop loss: dependent on where one confirms this level).
- Sells: Flat (Stop loss: N/A).
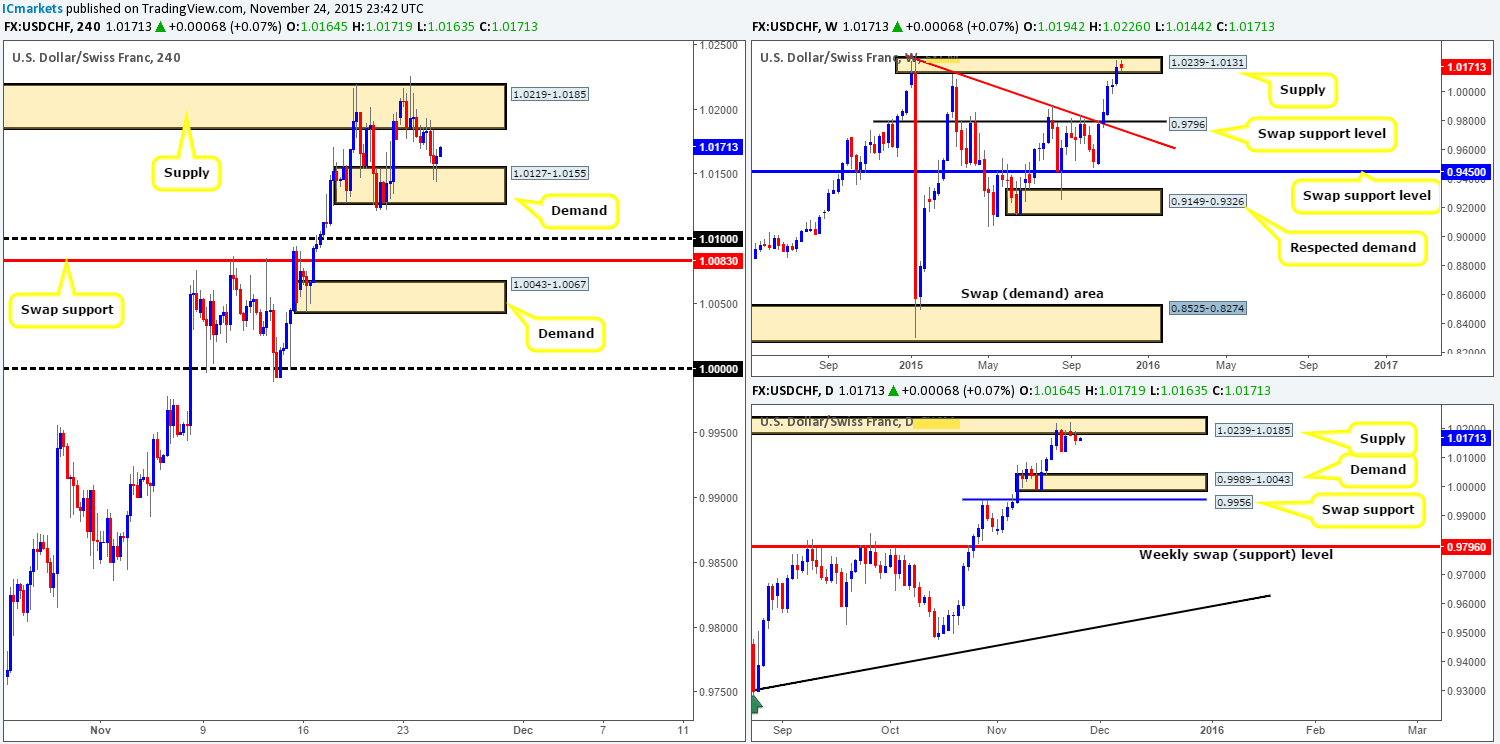
USD/CHF:
For those who read our previous report on the Swissy (http://www.icmarkets.com/blog/tuesday-24th-november-dollar-volatility-expected-in-the-afternoon-remain-vigilant/), you may recall that we were looking to short from the H4 supply at 1.0219-1.0185, but found M30 support around the 1.0175 mark to be in the way of a move lower. Well, early into yesterday’s trade, this support did in fact give way. However, the retracement was too deep for us to condone a short, which was a shame since price sold off down to demand seen at 1.0127-1.0155.
In the event that price rebounds from this demand back up into supply today, we would, once again, be very interested in shorting this market. The reason being is, at least from where we’re standing, this pair is trading within overall supply. Weekly supply can be found at 1.0239-1.0131, whilst down on the daily timeframe supply comes in at 1.0239-1.0185.
Levels to watch/ live orders:
- Buys:Flat (Stop loss: N/A).
- Sells:1.0219-1.0185 [Tentative – confirmation required] (Stop loss: dependent on where one confirms this area).
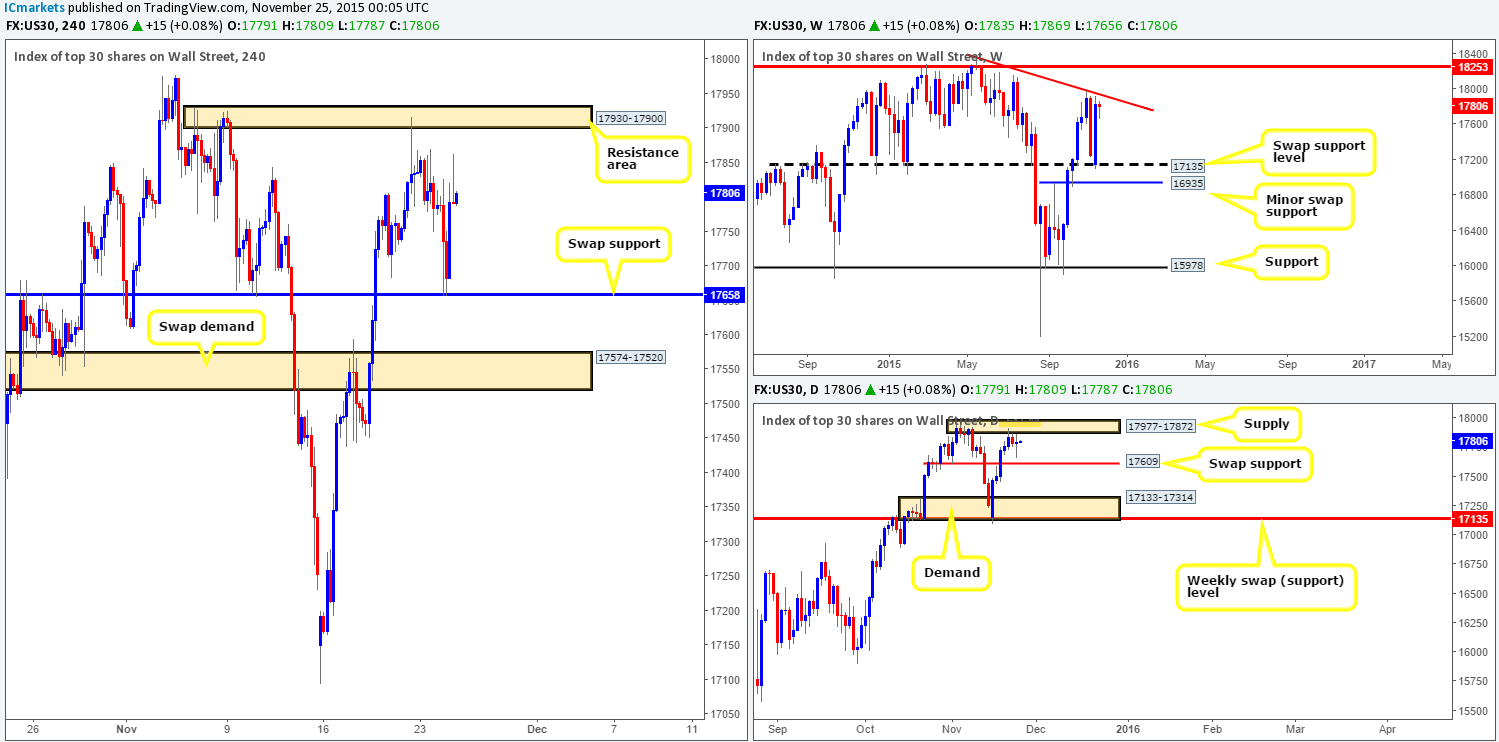
DOW 30:
Beginning with a look at the weekly timeframe this morning, we can see that price remains trading around the underside of the trendline resistance extended from the high 18365. In the event of a break above this line, we can likely expect a sharp rally up to the 18250 region. Down on the daily timeframe, however, the buyers and sellers appear indecisive as they battle for position beneath supply coming in at 17977-17872. Should the sellers come out victorious here, the next downside target to be aware of is the swap support barrier seen at 17609.
Moving down to the H4 timeframe, it’s pretty clear to see that price is currently trading mid-range between a resistance area drawn from 17930-17900 (positioned nicely around the weekly trendline barrier) and a swap support level seen at 17658.
To that end, our team is very interested in shorting from the current H4 resistance area today. However, we will not be placing a pending sell order here due to this zone being relatively small, thus prone to a possible fakeout. Regarding the current swap support, nonetheless, we would be extra careful here. Reason being is just below it sits a daily swap support barrier mentioned above at 17609, so the possibility of the current H4 support being consumed is potentially quite high.
Levels to watch/ live orders:
- Buys:17658 [Tentative – confirmation required] (Stop loss: dependent on where one confirms this level).
- Sells: 17930-17900 [Tentative – confirmation required] (Stop loss: dependent on where one confirms this area).
XAU/USD: (Gold)
As can be seen from the H4 chart, Gold recently rallied nicely from demand drawn from 1066.0-1070.4 for the second time, reaching highs of 1080.9 on the day. Now, with price effectively lingering between the above said demand, and the upper limit of the descending channel resistance (1097.9), where do we go from here?
Well, once again, weekly action appears to be holding firm above the weekly Quasimodo support level at 1074.6, and daily action continues to hover just above a daily swap (support) level at 1063.4. Therefore, what we’d really love to see today is the stops taken out from the aforementioned H4 demand, and price connect with the daily swap support below it before we look to buy this market.
In addition to this, we’re also going to be keeping an eye on the descending channel resistance line taken from the high 1098.0, as this could be a nice place to look to short. Just to be clear here though guys, we would only consider this a valid resistance line if price DOES NOT hit the daily swap support before touching here, and is confirmed by a lower timeframe sell signal.

Levels to watch/live orders:
- Buys:1063.4 [Tentative – confirmation required] (Stop loss: dependent on where one confirms this level).
- Sells: Channel resistance line [Tentative – confirmation required] (Stop loss: dependent on where one confirms this level).