EUR/USD:
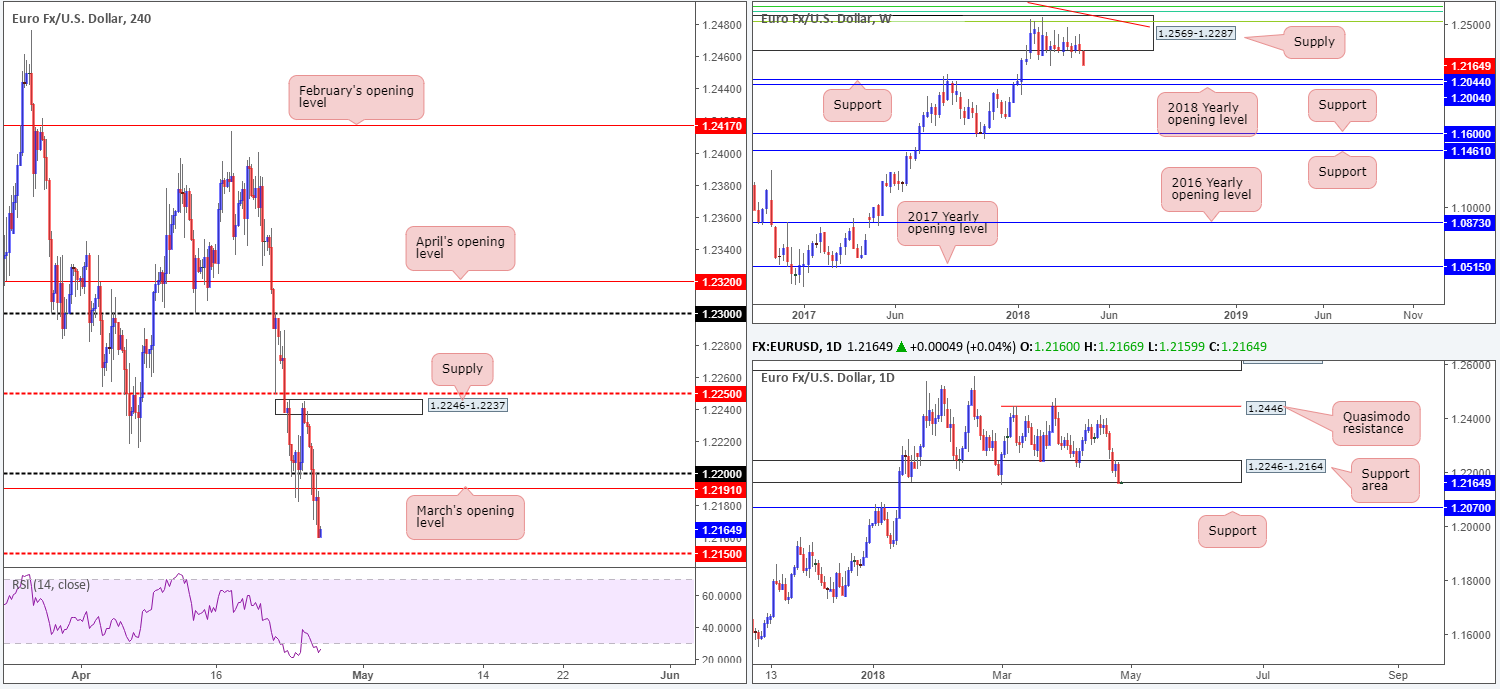
The shared currency declined in reasonably dominant fashion on Wednesday as the US dollar continued to surge on lifting US Treasury yields. The pair slipped through orders at 1.22 as well as March’s opening level at 1.2191 on the H4 timeframe, following a rejection off H4 supply posted at 1.2246-1.2237, consequently exposing the H4 mid-level support priced in at 1.2150. The H4 RSI remains oscillating in and out of oversold territory, which is common during selling phases such as this.
Assessing yesterday’s daily movement, we can see that the unit marginally closed beyond a rather significant daily support area at 1.2246-1.2164 in the form of a full-bodied daily bearish candle. Assuming sellers remain in the driving seat, the next destination could very well be daily support plotted at 1.2070. Supporting this idea is the weekly timeframe. Weekly price continues to tumble lower from a major-league weekly supply seen at 1.2569-1.2287. The next downside targets from this point fall in at weekly support drawn from 1.2044, shadowed closely by the 2018 yearly opening level at 1.2004.
Potential trading zones:
Today is likely to be tense for this market, with the ECB expected to deliver their latest interest rate decision. From a technical standpoint, though, the team has noted to keep fresh eyes on the H4 mid-level base line 1.2150. A H4 close beneath here followed up with a successful retest is, in our view, a strong sell signal, with an initial target objective set at the 1.21 handle, followed by H4 support at 1.2084 (not seen on the screen) and ultimately daily support mentioned above at 1.2070.
Data points to consider today: Spanish unemployment rate; EUR minimum bid rate; ECB press conference; US core durable goods m/m; US unemployment claims.
GBP/USD:
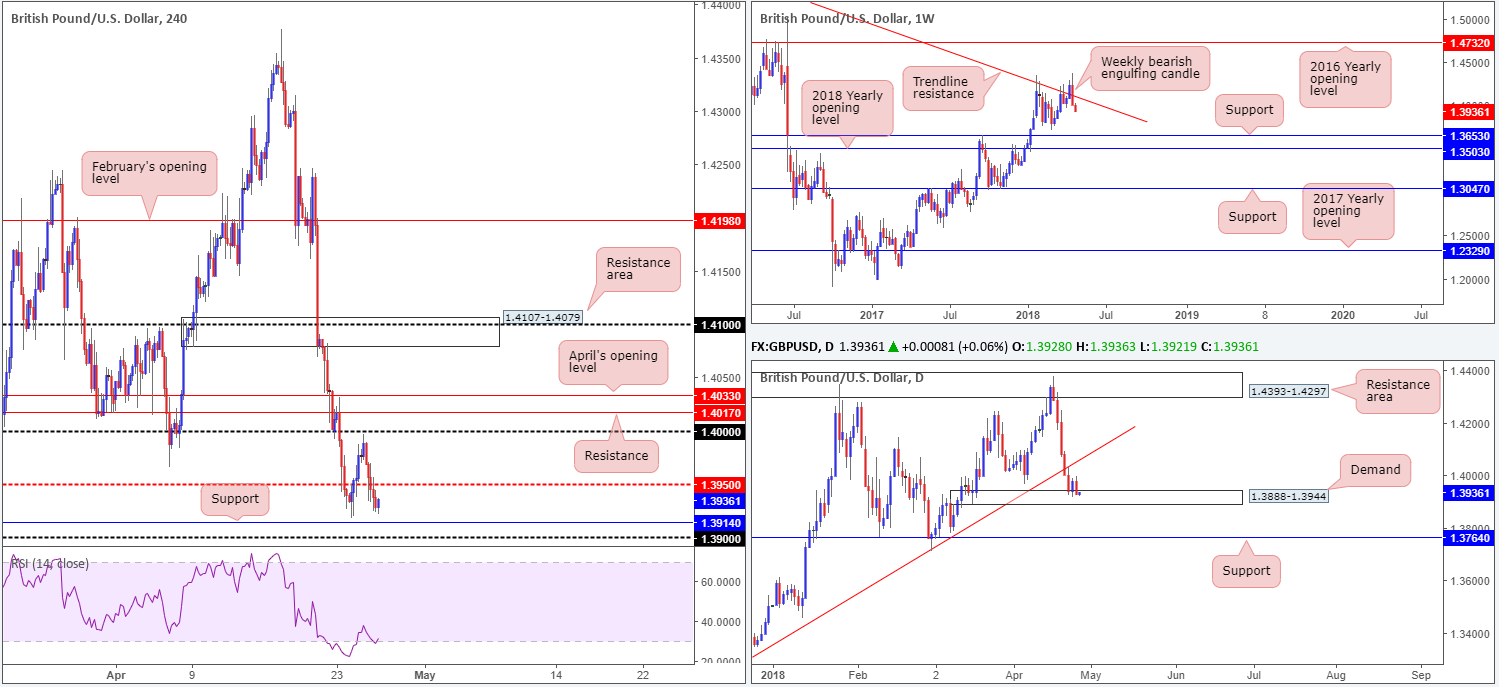
Following the euro’s movements, the British pound also declined in value on Wednesday after the H4 candles failed to pursue higher levels beyond 1.40. Higher US Treasury yields remains dollar supportive, consequently pressuring the GBP/USD beneath the H4 mid-level support at 1.3950 and back within striking distance of H4 support penciled in at 1.3914 by the day’s close.
As is shown on the daily chart, the response from the daily demand area at 1.3888-1.3944 was a short-lived one, with 100% of gains being reversed over the course of yesterday’s sessions. Technically, this could have something to do with the fact that last week’s action formed a striking weekly bearish engulfing candle that nose-dived back beneath a long-term weekly trend line resistance taken from the high 1.5930. A break of the current daily demand area could lead to an approach towards daily support priced in at 1.3764.
Potential trading zones:
Although we’re seeing weakness, attempting to sell on this action is problematic at the moment. Not only do we have the aforementioned H4 support to contend with, there’s also 1.39 as well as the noted daily demand. Should one witness a decisive close beneath 1.39, however, shorts on the retest of this number down to 1.38, followed by the daily support could be an option. The idea behind this is a close beyond 1.39 would likely trigger stop-loss orders beneath the current daily demand and therefore weaken buyers further.
Data points to consider today: US core durable goods m/m; US unemployment claims.
AUD/USD:
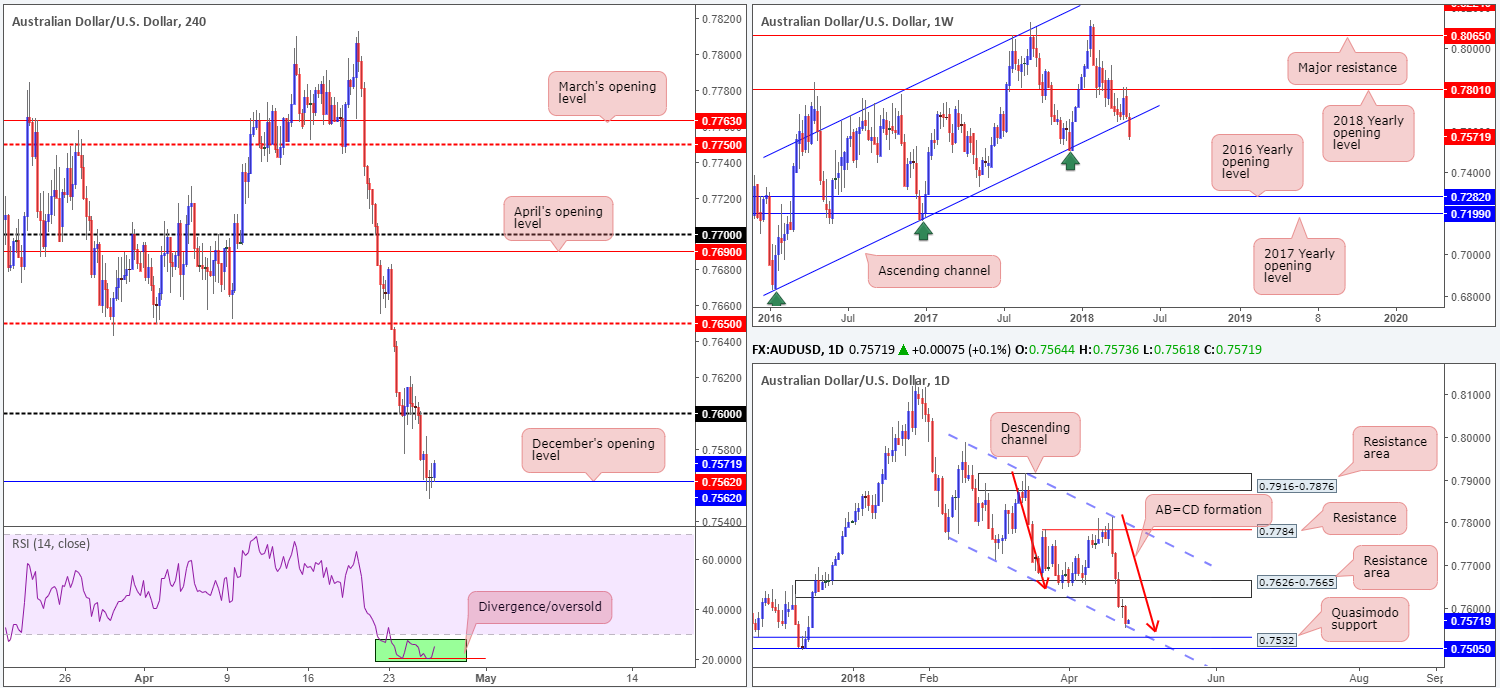
In early Asia, H4 movement forcefully dipped below 0.76 and eventually made its way down to December’s opening level seen on the H4 timeframe at 0.7562 going into London trading. As you can see, the Australian dollar defended this level in reasonably strong fashion, not allowing a H4 close to form beneath it.
Supporting longs from this region is the H4 RSI indicator currently seen chalking up a divergence reading within oversold terrain. Further adding to this, however, we can see that daily price recently shook hands with a daily channel support drawn in from the low 0.7758 (below we also see a daily Quasimodo support at 0.7532). Also worth noting on this timeframe is the potential AB=CD correction that terminates just ahead of the daily Quasimodo level (see red arrows).
Further buying from 0.7562 places intraday resistance at 0.76, while on the daily scale the next upside target falls in at the underside of a daily resistance area seen at 0.7626-0.7665.
Potential trading zones:
For those looking to long December’s opening level, constant monitoring is recommended. We say this simply because not only do we currently see a somewhat robust USD, but we also see that weekly price recently broke out of a long-term weekly ascending channel formation (taken from the low 0.6827). For that reason, reducing risk to breakeven and taking partial profits off the table once 0.76 is achieved is advised.
Data points to consider today: US core durable goods m/m; US unemployment claims.
USD/JPY:
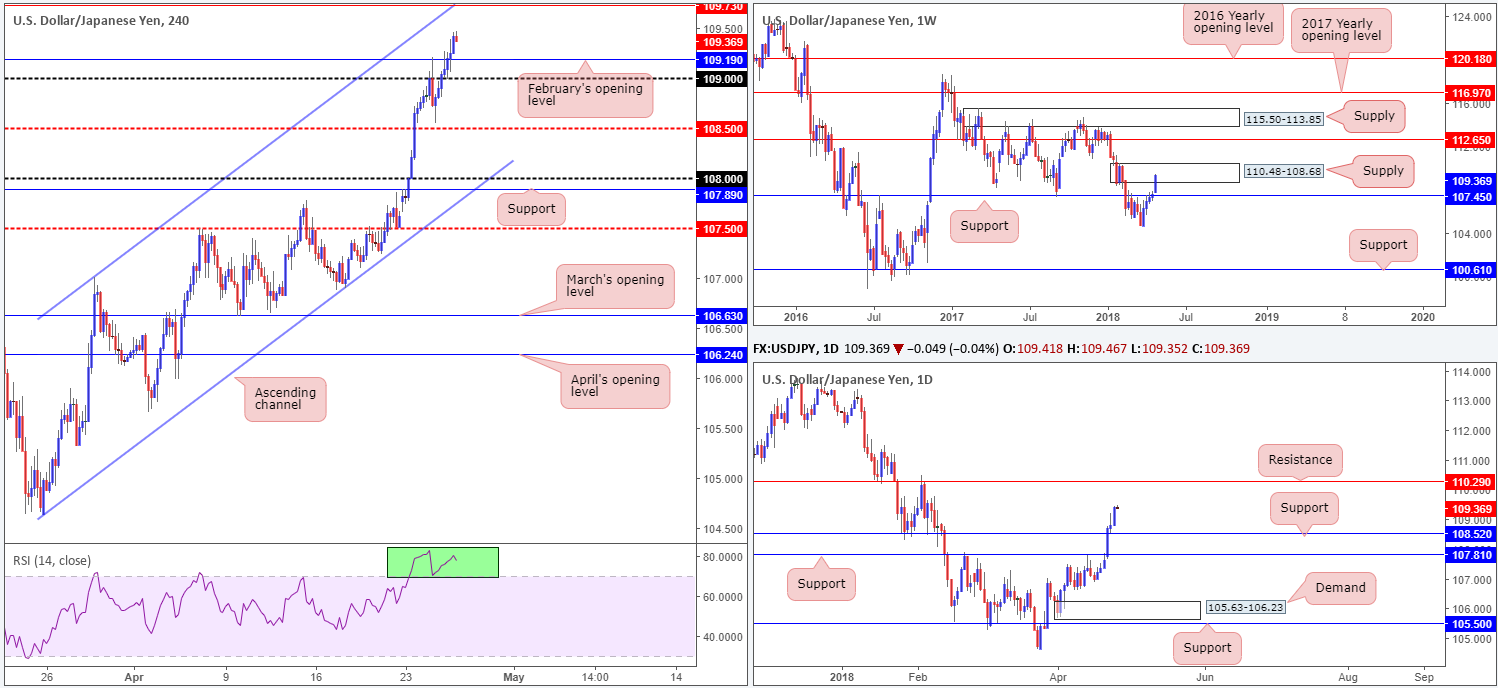
Robust US Treasury yields kept the USD/JPY on the winning side of the table on Wednesday, despite limited upside seen in US equities. H4 action sliced above orders at the 109 handle and also above February’s opening level placed at 109.19, reaching a high of 109.45. This has exposed a potential H4 sell zone at 109.73: a H4 resistance level – could also be labeled a Quasimodo resistance – that fuses beautifully with a H4 channel resistance etched from the high 107.01 (not seen on the screen).
The story over on the bigger picture places weekly flow within the walls of a weekly supply zone pictured at 110.48-108.68. Given current buying pressure, we have yet to see anything meaningful to the downside from here. Daily movement, on the other hand, highlights room to potentially climb as high as daily resistance seen at 110.29 (seen within the current weekly supply).
Potential trading zones:
Trading this market medium-term may be a challenge, given we have daily price holding above support and weekly action trading from supply.
Intraday, nonetheless, could see H4 price retest February’s opening level at 109.19 for a possible long (remain cognizant of a potential fakeout below here to 109), targeting the aforementioned H4 resistance at 109.73. This, given the H4 confluence merging with this resistance and the fact that it’s positioned within weekly supply, is not only considered a take-profit target to the upside, but also, as highlighted above, a potential sell zone.
Data points to consider today: US core durable goods m/m; US unemployment claims.
USD/CAD:
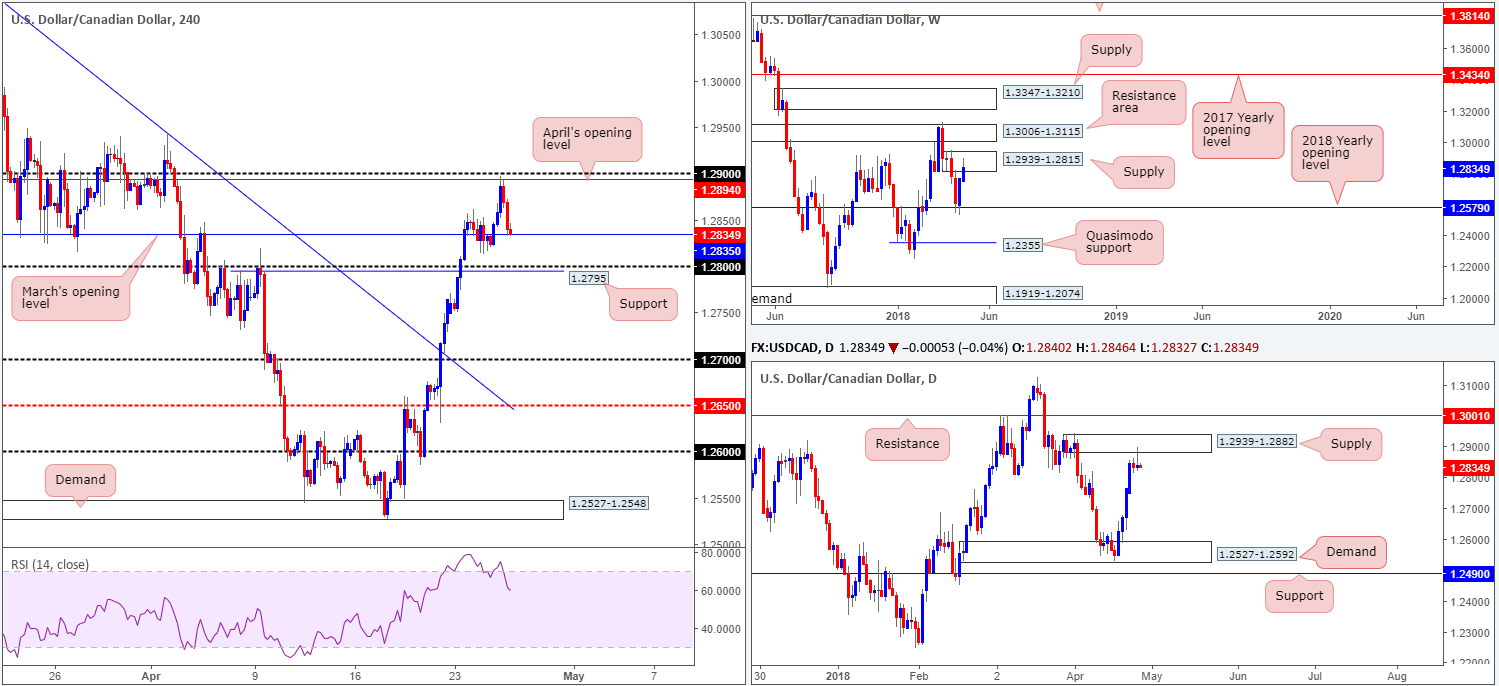
The Canadian dollar was able to push back during Wednesday’s movement and bring the USD/CAD lower from April’s opening level at 1.2894 seen on the H4 timeframe. The pair managed to print a mild bottom (seen clearer on H1) around March’s opening level at 1.2835 in US hours following BoC’s Gov. Poloz’s comments.
For those who read Wednesday’s report you may recall the team highlighting April’s opening level as a potential sell zone. Our reasoning behind selecting this level was simply because of where it was positioned on the higher timeframes (within weekly supply at 1.2939-1.2815 and also within the lower limits of daily supply plotted at 1.2939-1.2882). Well done to any of our readers who managed to take advantage of this move.
On account of the daily bearish pin-bar formation printed off of the daily supply yesterday, and given the room for both weekly and daily price to drive lower, further selling could be in store.
Potential trading zones:
Intraday shorts beyond March’s opening level could be an option, with downside targets sitting at 1.28, followed by a fresh H4 demand at 1.2749-1.2770 (we’d be very surprised not see a bounce materialize from here). Eventually, though, we may see lower levels, as the higher timeframes suggest.
Data points to consider today: US core durable goods m/m; US unemployment claims.
USD/CHF:
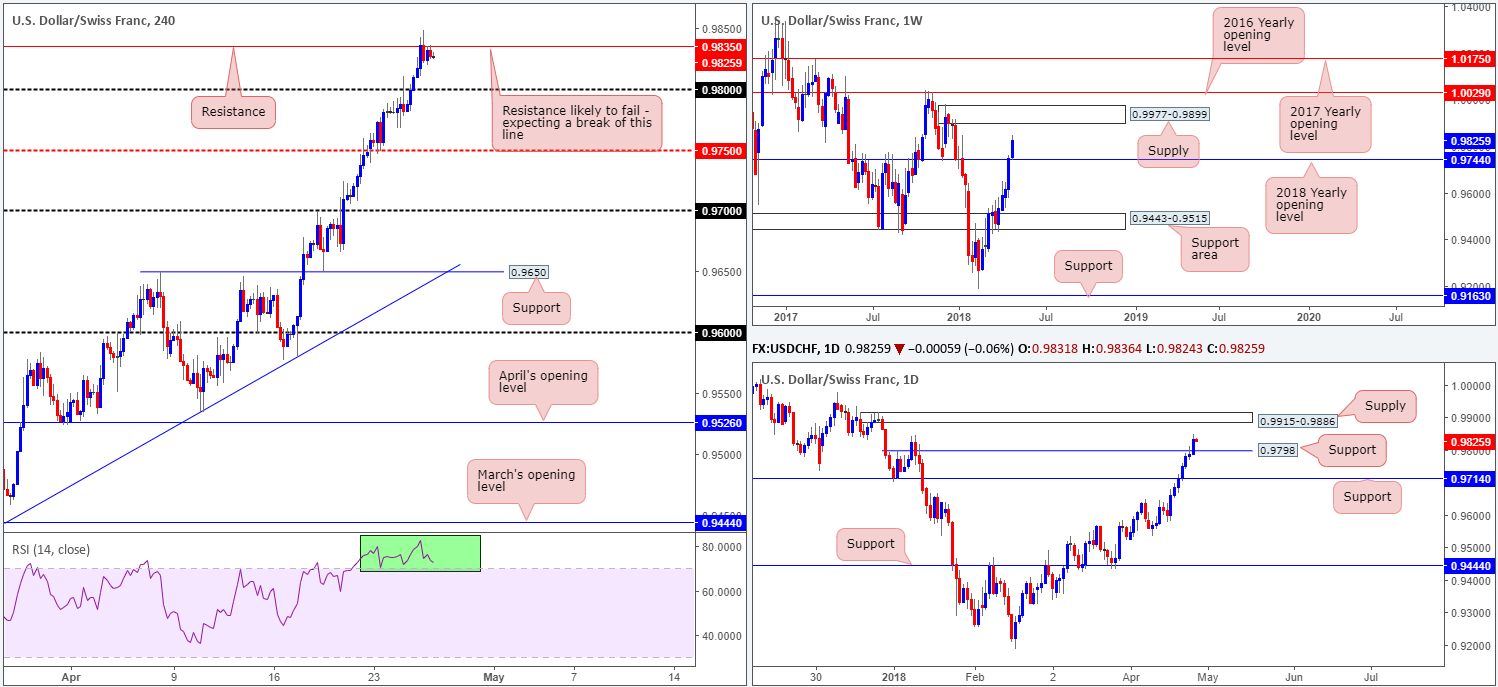
The US dollar continued to advance against its Swiss counterpart on the back of higher US Treasury yields. The 0.98 handle was taken out in reasonably strong fashion in early Asia on Wednesday, which, as you can see, generated further buying and brought the H4 candles up to a H4 resistance priced in at 0.9835. A break of this level could spark further buying up to a H4 Quasimodo resistance plotted at 0.9885 (not seen on the screen).
After weekly flow closed above the 2018 yearly opening level at 0.9744, the pair has remained on a strong upwardly path, with the next upside objective set at a weekly supply zone printed from 0.9977-0.9899. Lower down on the daily timeframe, the daily candles chalked up their seventh consecutive bullish gain, firmly closing above a daily Quasimodo resistance level at 0.9798. On this scale, we see little stopping the pair from extending higher until we reach daily supply at 0.9915-0.9886, which happens to be glued to the underside of the noted weekly supply.
Potential trading zones:
As both weekly and daily flow suggests further upside may be on the cards, shorting from the current H4 resistance is not something we’d label high probability. Instead, the team recommends waiting for a decisive H4 close above this H4 line. This – followed up with a retest as support – would, according to the technicals, be enough to consider taking long positions, targeting the H4 Quasimodo resistance mentioned above at 0.9885, which merges beautifully with the underside of the noted daily supply!
Data points to consider today: US core durable goods m/m; US unemployment claims.
DOW 30:
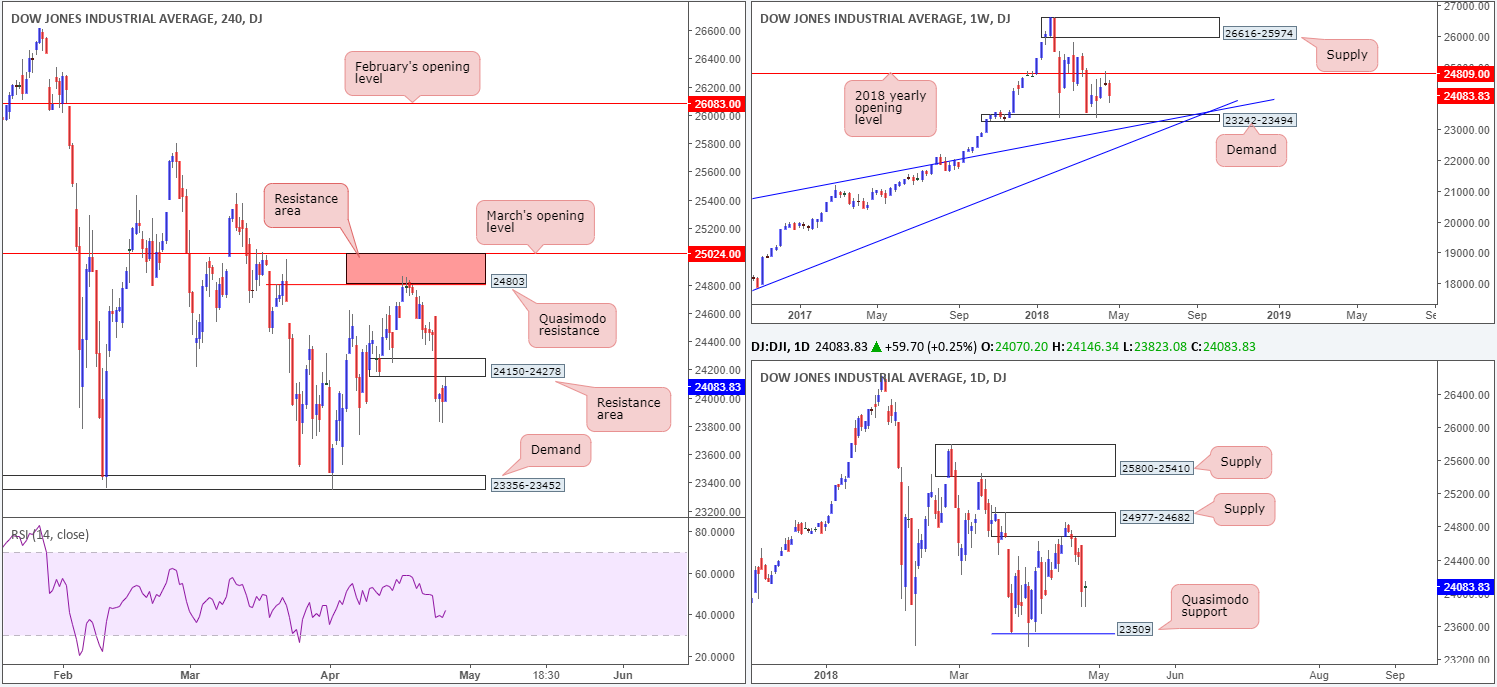
As can be seen from the H4 timeframe this morning, the Dow Jones Industrial Average was reasonably quiet amid Wednesday’s session. H4 price briefly pressed below Tuesday’s low at 23828 and ended the segment topping just south of a H4 resistance area at 24150-24278 (prior demand).
In view of the lackluster performance, the desk still remains bearish this market. As highlighted in previous reports, this is largely due to higher-timeframe structure. Weekly activity recently extended to the downside following a weekly bearish pin-bar formation off of the 2018 yearly opening level baked in at 24809, and has a support target of 23242-23494: weekly demand. Alongside this, daily price is seen driving lower from daily supply noted at 24977-24682 and shows room to continue south until we connect with a daily Quasimodo support at 23509 (located just ahead of the current weekly demand).
Potential trading zones:
The break of 24150-24278 on the H4 timeframe has potentially provided a favorable opportunity to sell this market and target the lower H4 demand at 23356-23452. As mentioned in yesterday’s report, an ideal sell signal would be for a retest to the underside of 24150-24278 in the shape of a full or near-full-bodied H4 bearish candle. With stops planted above the wick of the rejection candle, reasonably attractive risk/reward could be achieved here.
Data points to consider today: US core durable goods m/m; US unemployment claims.
GOLD:
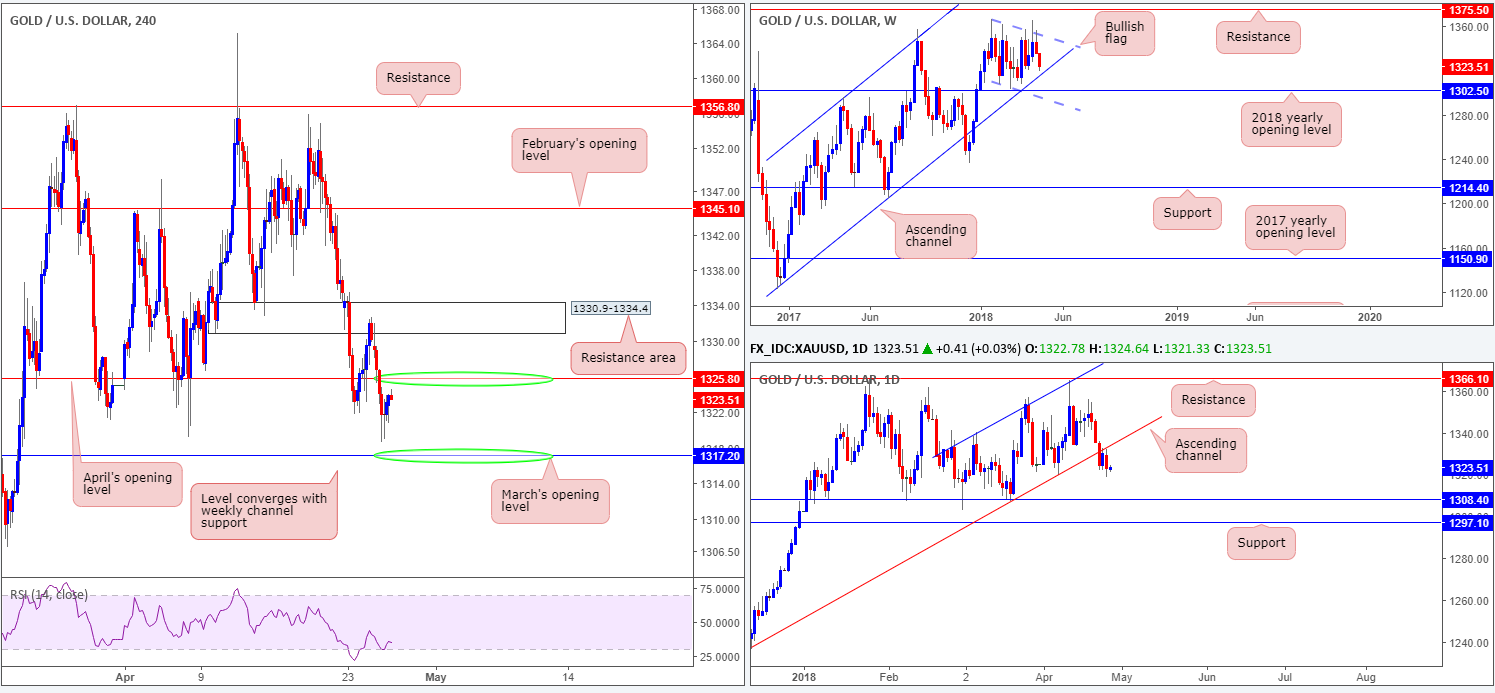
Driven by robust US Treasury yields (recently cracked through the 3% mark), the US dollar remains buoyant above the 91.00 point. A generally well-bid dollar placed the price of gold under pressure on Wednesday, extending the bounce seen from the underside of a H4 resistance area at 1330.9-1334.4 and breaking through orders at April’s opening level at 1325.8. Well done to any of our readers who managed to jump aboard this train, since this was a noted move to watch for in Wednesday’s report.
Supporting downside, we can clearly see the aforementioned H4 resistance area intersecting with the recently broken daily channel support-turned resistance taken from the low 1236.6. On the weekly timeframe, downside also remains favored until we shake hands with a long-term weekly channel support taken from the low 1122.8 (the next downside target on the weekly scale).
Potential trading zones:
On account of the above structure, here’s what we’ve noted going forward:
- Potential shorts off of 1325.8 are possible, given where the market is positioned on the bigger picture. Ultimately, this is an intraday setup as the take-profit angle sits at March’s opening level drawn from 1317.2, which converges with the noted weekly channel support.
- With the above in mind, not only is March’s opening level a take-profit barrier, it is also a point of consideration for potential longs, on the basis of it merging with weekly structure. The first upside objective from here would, of course, be 1325.8, followed then by the said H4 resistance area. However, seeing the connection with weekly structure, this could understandably evolve into a medium-term position, given enough time.
This site has been designed for informational and educational purposes only and does not constitute an offer to sell nor a solicitation of an offer to buy any products which may be referenced upon the site. The services and information provided through this site are for personal, non-commercial, educational use and display. IC Markets does not provide personal trading advice through this site and does not represent that the products or services discussed are suitable for any trader. Traders are advised not to rely on any information contained in the site in the process of making a fully informed decision.
This site may include market analysis. All ideas, opinions, and/or forecasts, expressed or implied herein, information, charts or examples contained in the lessons, are for informational and educational purposes only and should not be construed as a recommendation to invest, trade, and/or speculate in the markets. Any trades, and/or speculations made in light of the ideas, opinions, and/or forecasts, expressed or implied herein, are committed at your own risk, financial or otherwise.
The use of the site is agreement that the site is for informational and educational purposes only and does not constitute advice in any form in the furtherance of any trade or trading decisions.
The accuracy, completeness and timeliness of the information contained on this site cannot be guaranteed. IC Markets does not warranty, guarantee or make any representations, or assume any liability with regard to financial results based on the use of the information in the site.
News, views, opinions, recommendations and other information obtained from sources outside of www.icmarkets.com.au, used in this site are believed to be reliable, but we cannot guarantee their accuracy or completeness. All such information is subject to change at any time without notice. IC Markets assumes no responsibility for the content of any linked site. The fact that such links may exist does not indicate approval or endorsement of any material contained on any linked site.
IC Markets is not liable for any harm caused by the transmission, through accessing the services or information on this site, of a computer virus, or other computer code or programming device that might be used to access, delete, damage, disable, disrupt or otherwise impede in any manner, the operation of the site or of any user’s software, hardware, data or property.


