EUR/USD:
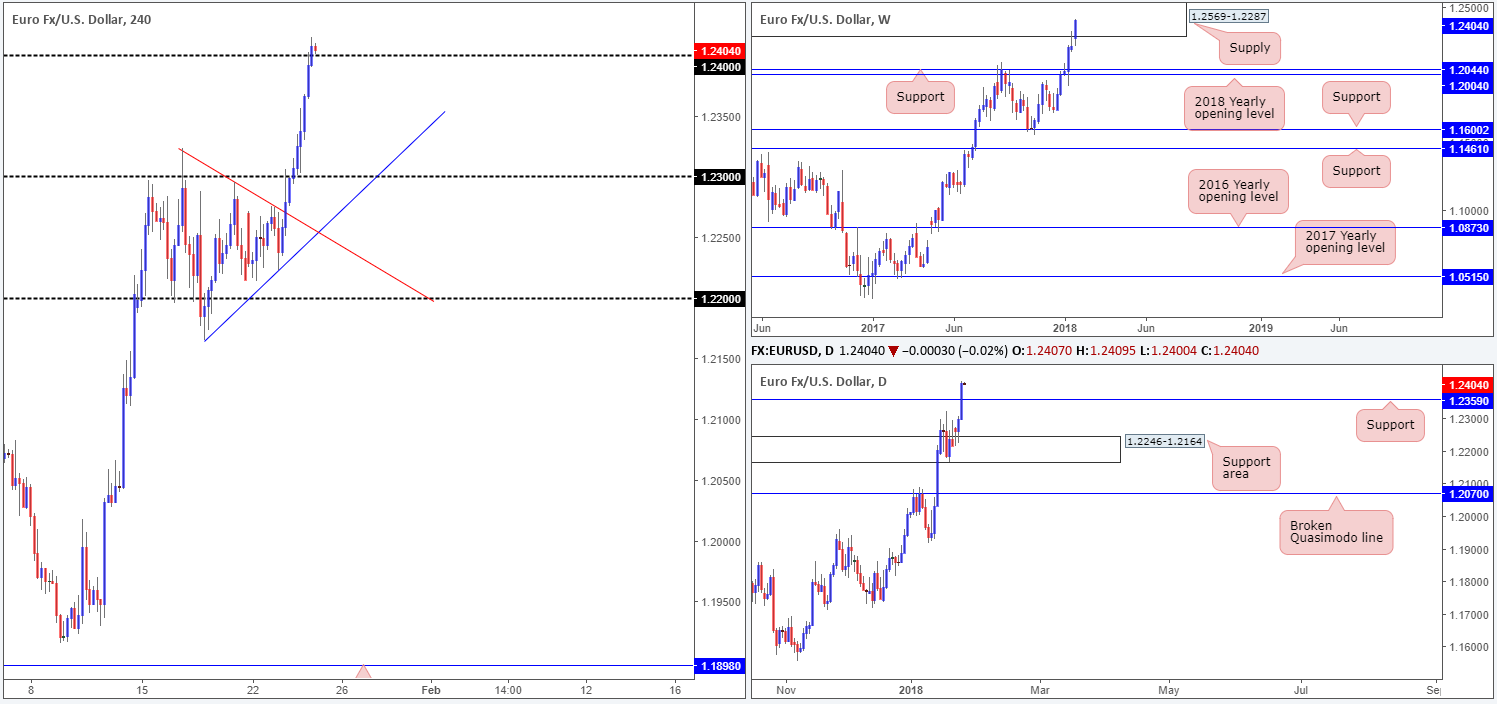
Across the board, we saw the US dollar plummet against the majority of its trading peers on Wednesday, consequently lifting the EUR/USD above the 1.24 handle to fresh highs of 1.2415.
In the shape of a near-full-bodied daily bull candle, the pair also thumped its way through daily resistance at 1.2359, potentially setting the stage for a continuation move up to a daily Quasimodo resistance band at 1.2495. Up on the weekly timeframe, however, the euro finds itself confined within the walls of a weekly supply zone marked at 1.2569-1.2287 formed back in late 2014.
Market direction:
As we write, the H4 candles appear to be establishing some ground above 1.24. Continued buying from this angle could lead to a move being seen up to the aforementioned daily Quasimodo resistance level. While we are aware of the H4 mid-level resistance at 1.2450 (not seen on the screen), it’s not likely to offer much resistance given its history.
For traders looking to enter long above 1.24, it’s important to remain aware of the current weekly supply. With this in mind, we would watch how H4 price behaves above 1.24 before pulling the trigger. A H4 full or near-full-bodied bull candle printed on the retest of 1.24 would, in our view, be enough evidence to indicate buyer intent and likely force the unit up to at least 1.2450/1.2495.
Data points to consider: Spanish unemployment rate at 8am; German IFO business climate at 9am; EUR minimum bid rate at 12.45pm; ECB press conference at 1.30pm; US unemployment claims at 1.30pm; US new home sales at 3pm GMT.
Areas worthy of attention:
Supports: 1.24 handle; 1.2359.
Resistances: 1.2569-1.2287; 1.2495.
GBP/USD:
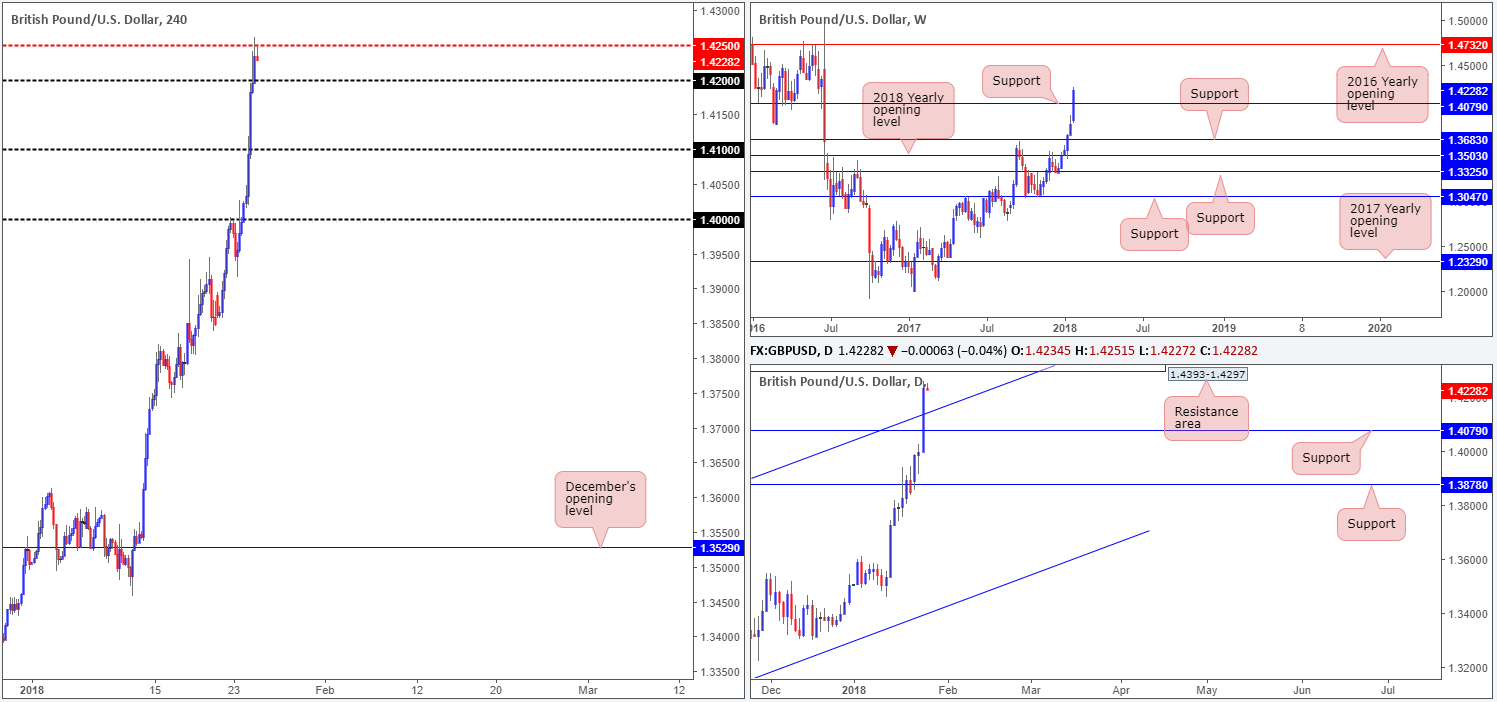
GBP bulls, once again, were seen flexing their financial muscle on Wednesday. Up 1.66% on the day, the pair managed to chew through offers around a weekly resistance level plotted at 1.4079 (now acting support). Technically speaking, this move has possibly unlocked the door for the unit to challenge the 2016 yearly opening level at 1.4732.
Looking down on daily structure, the daily channel resistance extended from the high 1.2673 was also taken out amid yesterday’s advance. This has placed a daily resistance area at 1.4393-1.4297 in the spotlight. We believe the market is likely to find active selling here, with it having been a strong demand back in 2016.
Economic data from the UK showed the claimant count rate increased from 2.3% up to 2.4%. The Unemployment rate remained unchanged, as did average earnings. At the time of this release, price was teasing the underside of 1.41, and as far as we can see, was largely ignored.
Market direction:
Despite H4 price fading the H4 mid-level resistance 1.4250 at the moment, further buying up to at least the daily resistance area mentioned above at 1.4393-1.4297 (houses a H4 resistance within at 1.4382) is likely going to be seen according to our technicals.
As of now, though, we do not see much to hang our hat on as far as technical setups go. That is unless you trade round numbers and like the look of buying 1.42 without any confluence other than a rising market?
Data points to consider: US unemployment claims at 1.30pm; US new home sales at 3pm GMT.
Areas worthy of attention:
Supports: 1.42 handle; Daily channel support; 1.4079.
Resistances: 1.4250; 1.4382; 1.4732; 1.4393-1.4297.
AUD/USD:
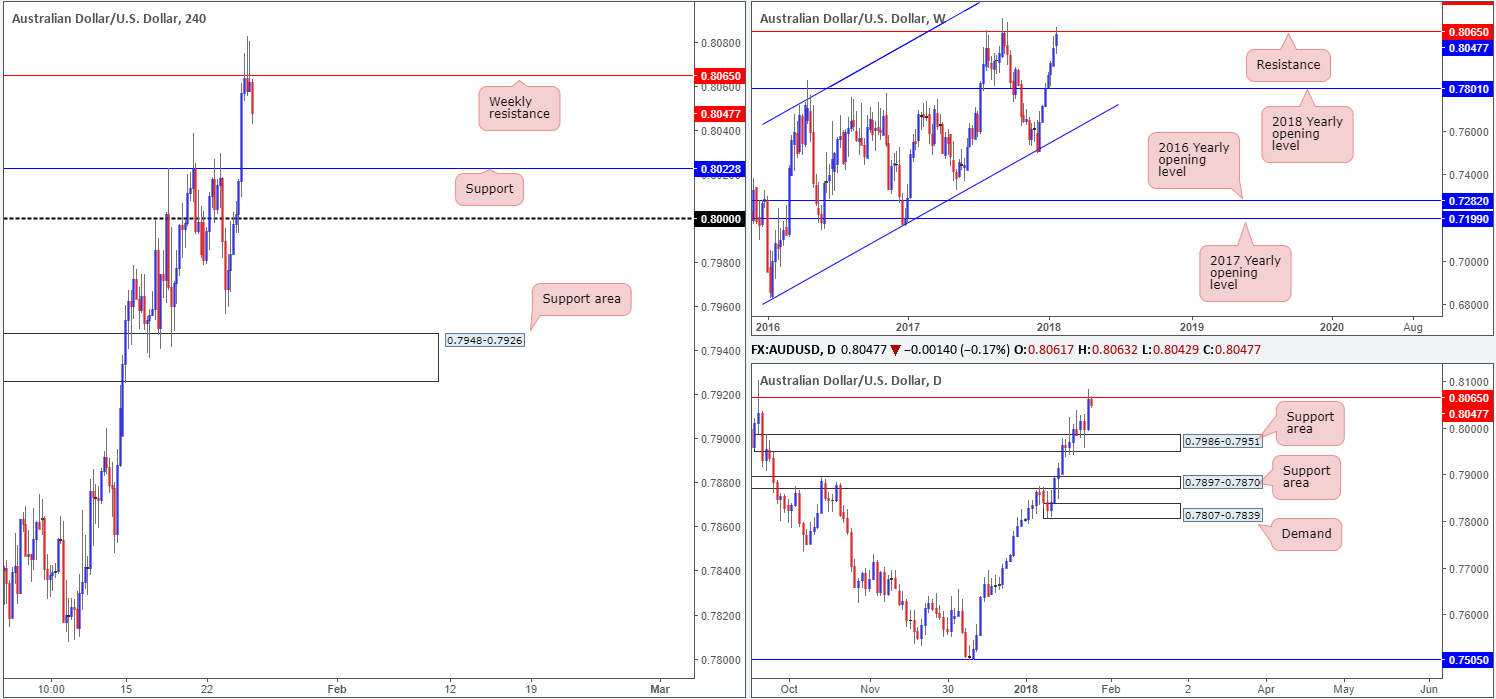
Along with the price of gold, the Aussie dollar moved into a higher gear on Wednesday and forced the unit to shake hands with a weekly resistance line at 0.8065. So far, this level has held firm, pulling back from highs of 0.8082. In the event that the commodity-linked currency retreats, the next support target on the weekly scale is seen at 0.7801: the 2018 yearly opening level. Down on the daily timeframe, however, the next downside target can be seen nearby at 0.7986-0.7951: a daily support area. H4 action, on the other hand, shows potential support coming in from the 0.8022 neighborhood.
Market direction:
The weekly resistance currently in play boasts a robust history, and therefore could possibly cap upside this week. The collection of H4 selling wicks seen around the weekly level were clear signs of bearish intent, in our opinion. Well done to any of our readers who managed to catch this! You might want to consider trailing H4 price down to 0.8022 and look to reduce risk to breakeven and take some profits off the table. Beyond here, traders are likely eyeing the large psychological number 0.80.
Data points to consider: Aussie banks closed in observance of Australia Day; US unemployment claims at 1.30pm; US new home sales at 3pm GMT.
Areas worthy of attention:
Supports: 0.80 handle; 0.8022; 0.7986-0.7951.
Resistances: 0.8065.
USD/JPY:
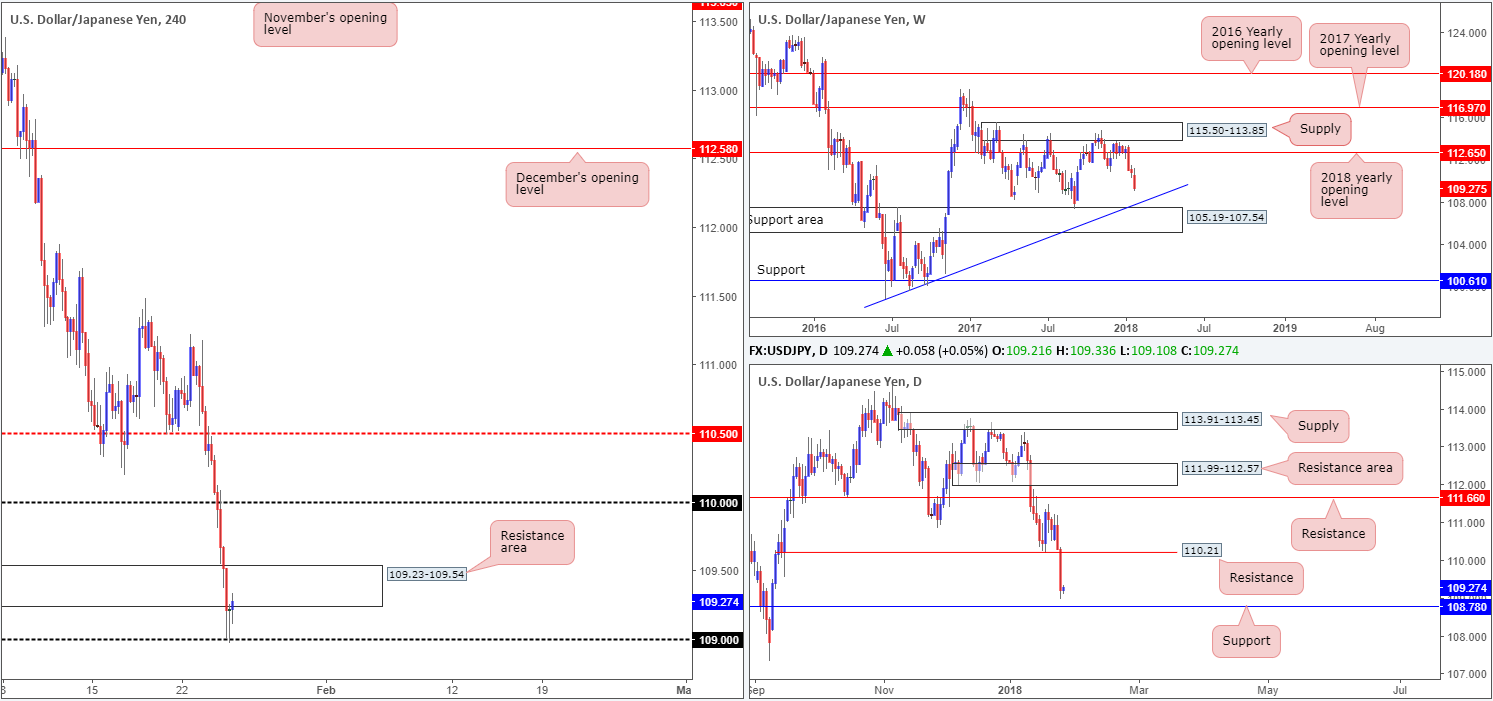
Weekly price, as you can see, continues to trade in the direction of a weekly trendline support etched from the low 98.78, followed closely by a weekly support area at 105.19-107.54. Turning our attention to the daily timeframe, however, we can see that price is currently trading within shouting distance of support at 108.78, thanks to yesterday’s break of daily support (now acting resistance) at 110.21.
Across the pond on the H4 timeframe, the candles are seen attempting to recover from the 109 handle. However, there’s also a H4 resistance area in play at 109.23-109.54 which could potentially hinder upside. Also something to keep an eyeball on today is a possible (deep) fakeout through 109 to test daily support at 108.78.
Market direction:
A correction from 108.78/1.09 is likely on the cards. How high price will reach, however, is difficult to judge, since let’s keep in mind that weekly sellers threaten lower prices.
With the H4 candles seen sandwiched between the noted H4 resistance area and round number, there’s not much on offer as far as trading setups go. Even with a break below 109, one is immediately placed in direct conflict with daily support. The same can be said for a break above the current H4 resistance area, as 110 lurks just ahead.
Data points to consider: US unemployment claims at 1.30pm; US new home sales at 3pm GMT.
Areas worthy of attention:
Supports: 109 handle; 108.78; Weekly trendline support; 105.19-107.54.
Resistances: 109.23-109.54; 110 handle; 110.21.
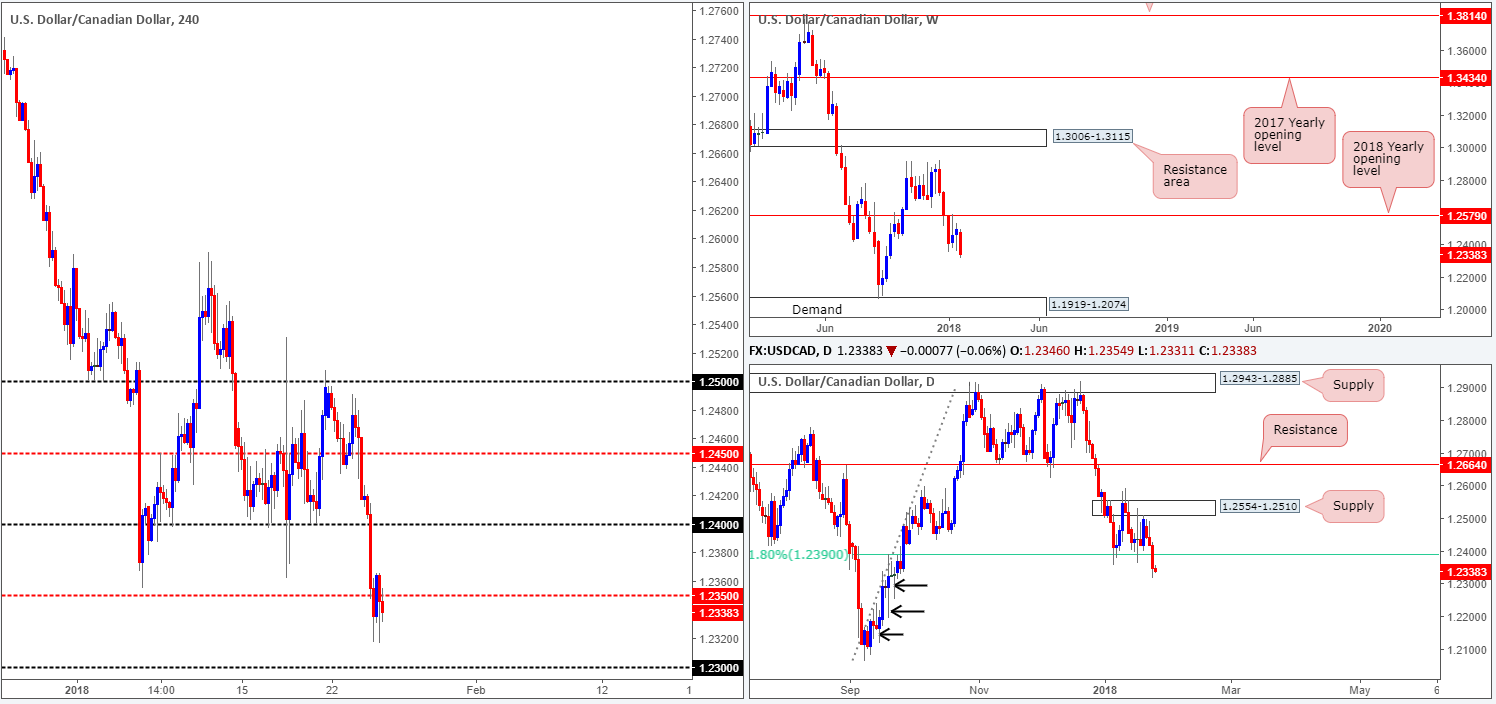
USD/CAD:
Looking at this market from the weekly timeframe, it is clear to see that downside is reasonably free of support. We know there’s a lot of ground to cover, but the unit could potentially stretch as far south as the weekly demand base coming in at 1.1919-1.2074.
Zooming in for a closer look at the daily timeframe, the daily 61.8% Fib support at 1.2390 was consumed during yesterday’s session. As we highlighted in Monday’s weekly outlook, below 1.2390 there’s little support in view. Note the clear daily buying tails marked with black arrows at 1.2253, 1.2194 and 1.2118. These, to us, resemble consumption of unfilled buy orders.
H4 price, as you can see, busted through the H4 mid-level support at 1.2350 after a strong bout of selling amid the London morning segment. The unit then bottomed around the 1.2320 neighborhood and found resistance a tad above 1.2350 during the US session.
Market direction:
With both weekly and daily structure indicating further selling could be on the cards, we expect the 1.23 handle to enter the fray sometime today. A break beyond 1.23 would, in our book, be considered a bearish cue. A retest of this number as resistance, followed up with a H4 full or near-full-bodied candle, would likely be enough evidence to warrant a sell trade.
Data points to consider: US unemployment claims at 1.30pm; US new home sales at 3pm; CAD retail sales m/m at 1.30pm GMT.
Areas worthy of attention:
Supports: 1.23 handle; 1.1919-1.2074.
Resistances: 1.24 handle; 1.2350.
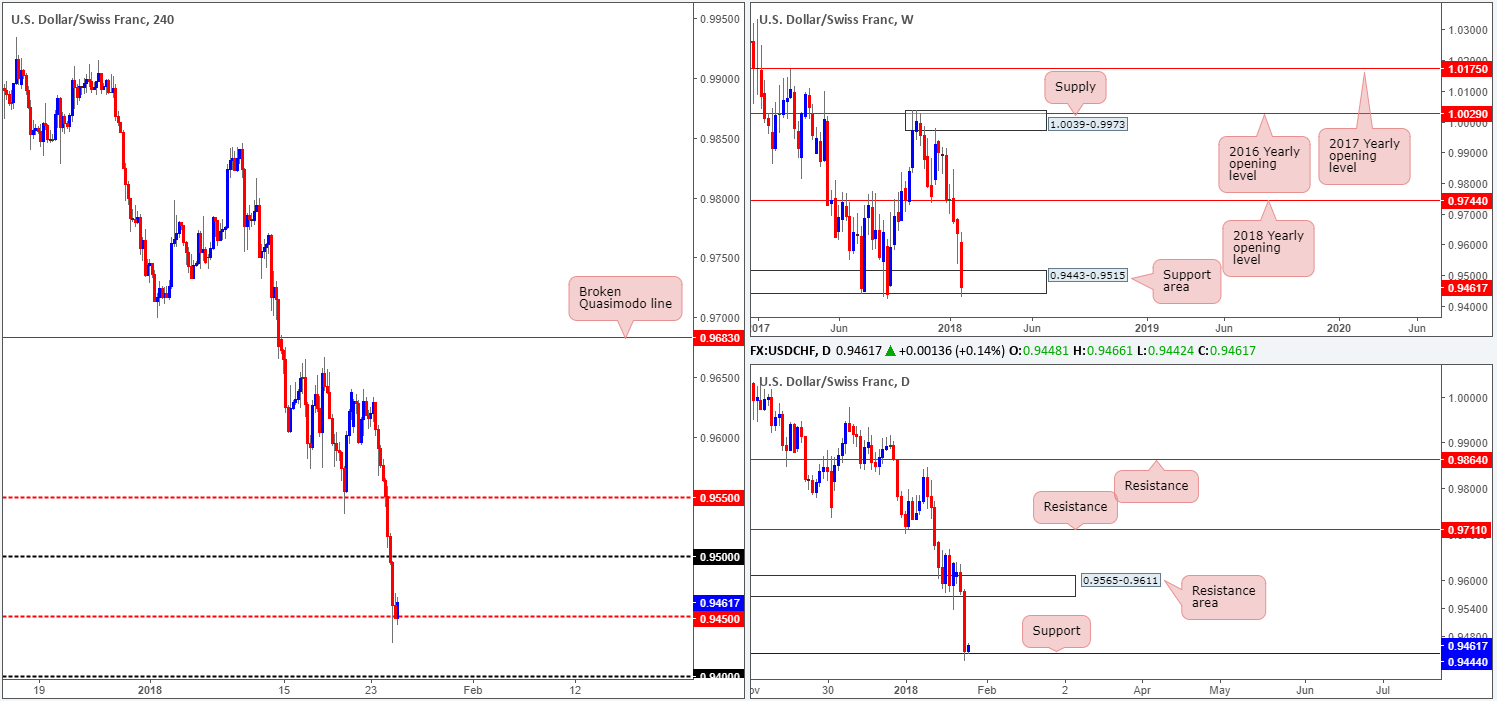
USD/CHF:
After a near-seven week selloff, the weekly candles shook hands with a weekly support area coming in at 0.9443-0.9515 on Wednesday. This area has been in motion since late 2015, so the bears will likely have their work cut out for them! In the event that this area yields to the selling pressure, however, the next objective seen on this scale is drawn from 0.9163.
Also seen bolstering the current weekly support area is a near-two year daily support level penciled in at 0.9444. As you can see, the unit is presently responding to this angle and could potentially send the pair back up to revisit the daily resistance area at 0.9565-0.9611.
Over on the H4 scale, the H4 mid-level support at 0.9450 came into the fray after a solid bout of selling yesterday. A recovery from this number opens up the 0.95 handle as a possible resistance, followed by the H4 mid-level point 0.9550 and then the aforementioned daily resistance area.
Market direction:
At current price, this market is trading around strong support on both the weekly and daily timeframes (see above). Therefore, despite the current downtrend, we would avoid entering into a sell trade just yet.
A solid H4 close below 0.9450 could be interpreted as a bearish cue down to 0.94. With this, one might also assume that buyers from the current daily support have been weakened. Ultimately though, we’d like to see the 0.94 handle consumed before selling becomes a possibility. This will, in our view, confirm that both weekly and daily supports are out of the picture.
Data points to consider: US unemployment claims at 1.30pm; US new home sales at 3pm GMT.
Areas worthy of attention:
Supports: 0.9450; 0.94 handle; 0.9444; 0.9443-0.9515.
Resistances: 0.95 handle; 0.9565-0.9611.
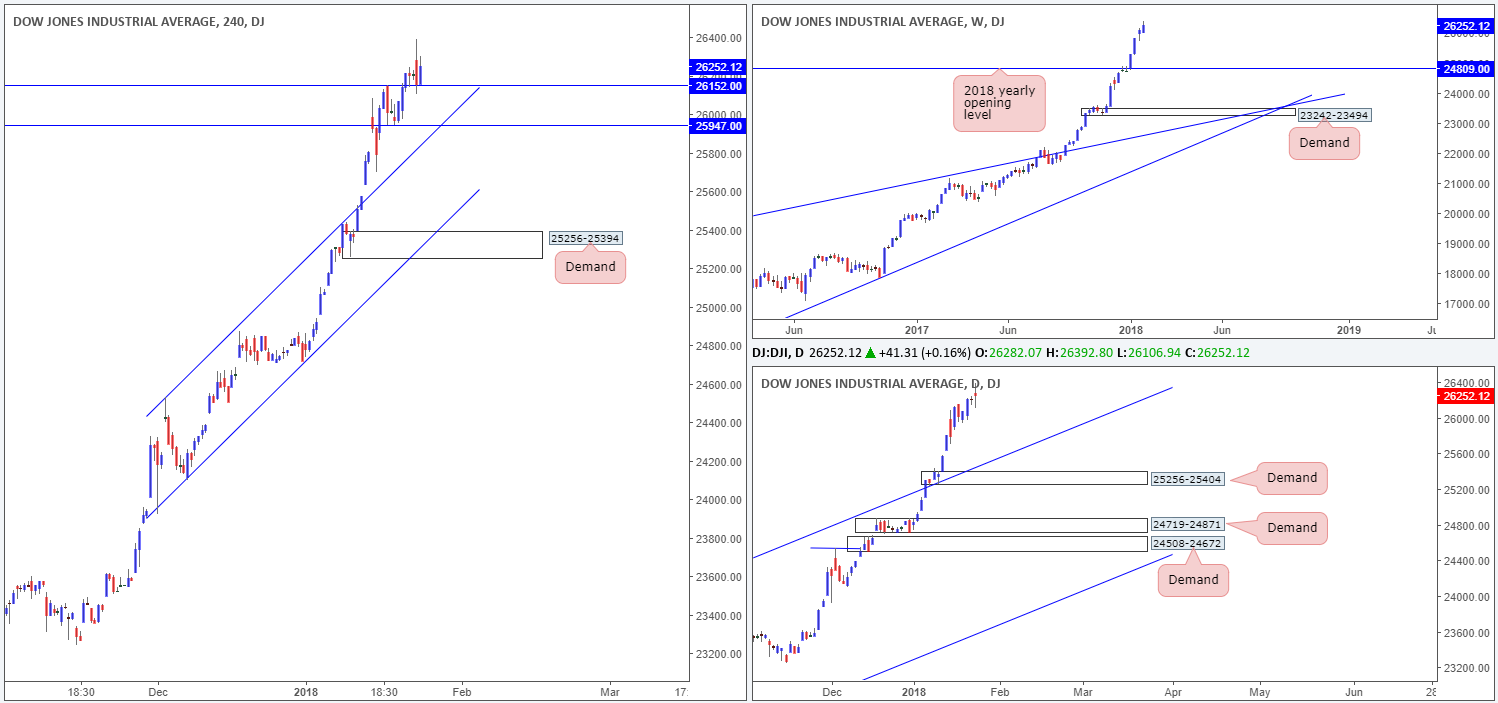
DOW 30:
US equities failed to set any form of clear direction for a second day yesterday, as concerns over a trade war between the US and China escalates. Consequent to this, the index formed an additional daily indecision candle.
H4 price, as you can see, established a support off of last Thursday’s high 26512. If this level should fail, H4 support seen below at 25947, coupled with a H4 channel support extended from the high 24534, will likely come into range.
As for the higher timeframes, there is little change in structure:
A pullback on the weekly timeframe could see the index dip as low as the 2018 yearly opening level at 24809. The next port of support on the daily timeframe, however, can be seen in the form of a daily channel resistance-turned support extended from the high 21169. A violation of this line would open the floor to a potential test of daily demand marked at 25256-25404.
Market direction:
Further upside remains favored.
Near term, the following levels are of interest for potential buying opportunities are as follows:
- The current H4 support at 26152. Yesterday’s H4 buying candle off of this level could be interpreted as a buy signal by many investors.
- The broken H4 channel resistance-turned support taken from the high 24535 and H4 support at 25947.
Data points to consider: US unemployment claims at 1.30pm; US new home sales at 3pm GMT.
Areas worthy of attention:
Supports: 26152; 25947; H4 channel support; 24809; Daily channel support.
Resistances: …
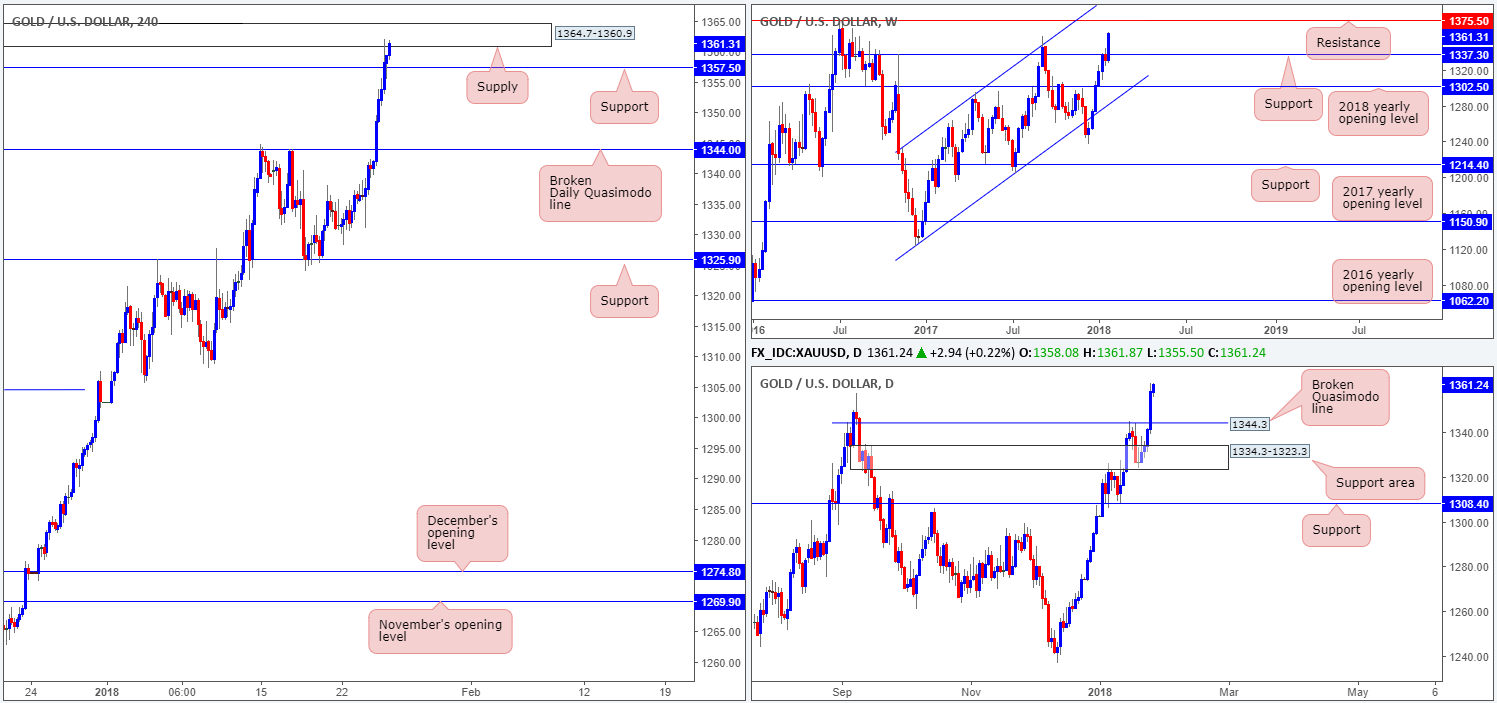
GOLD:
With the dollar continuing to press lower, gold prices remain in a bullish stance. Up over 1% on Wednesday, the move brought weekly price into within close distance of a weekly resistance base at 1375.5. This level has a history dating back to as far as early 2014, so be prepared for sellers to make an appearance!
Following the break of the daily Quasimodo resistance at 1344.3, we do not see much active supply to the left of current price (check it out for yourself – note the wicks stabbing into supply before dropping lower). As a result, this leaves the noted weekly resistance as the next upside target on this scale.
H4 price recently crossed above 1357.5 (Sep 8 2017 high) and entered into the jaws of a H4 supply formed back on the 4/8/16 at 1364.7-1360.9. This is the only remaining fresh H4 supply we see until the aforesaid weekly resistance.
Market direction:
Given that both weekly and daily price indicates further buying could be on the cards, selling from the H4 supply zone noted above at 1364.7-1360.9 may not be the best path to take. Should the H4 candles close beneath nearby H4 support at 1357.5, on the other hand, this could be interpreted as a bearish play to move price back down to the daily broken Quasimodo line at 1344.0. Therefore a break below 1357.5 and retest is something we’ll be keeping an eye on today.
Areas worthy of attention:
Supports: 1357.5; 1344.3.
Resistances: 1364.7-1360.9; 1375.5.
This site has been designed for informational and educational purposes only and does not constitute an offer to sell nor a solicitation of an offer to buy any products which may be referenced upon the site. The services and information provided through this site are for personal, non-commercial, educational use and display. IC Markets does not provide personal trading advice through this site and does not represent that the products or services discussed are suitable for any trader. Traders are advised not to rely on any information contained in the site in the process of making a fully informed decision.
This site may include market analysis. All ideas, opinions, and/or forecasts, expressed or implied herein, information, charts or examples contained in the lessons, are for informational and educational purposes only and should not be construed as a recommendation to invest, trade, and/or speculate in the markets. Any trades, and/or speculations made in light of the ideas, opinions, and/or forecasts, expressed or implied herein, are committed at your own risk, financial or otherwise.
The use of the site is agreement that the site is for informational and educational purposes only and does not constitute advice in any form in the furtherance of any trade or trading decisions.
The accuracy, completeness and timeliness of the information contained on this site cannot be guaranteed. IC Markets does not warranty, guarantee or make any representations, or assume any liability with regard to financial results based on the use of the information in the site.
News, views, opinions, recommendations and other information obtained from sources outside of www.icmarkets.com.au, used in this site are believed to be reliable, but we cannot guarantee their accuracy or completeness. All such information is subject to change at any time without notice. IC Markets assumes no responsibility for the content of any linked site. The fact that such links may exist does not indicate approval or endorsement of any material contained on any linked site.
IC Markets is not liable for any harm caused by the transmission, through accessing the services or information on this site, of a computer virus, or other computer code or programming device that might be used to access, delete, damage, disable, disrupt or otherwise impede in any manner, the operation of the site or of any user’s software, hardware, data or property.