A note on lower timeframe confirming price action…
Waiting for lower timeframe confirmation is our main tool to confirm strength within higher timeframe zones, and has really been the key to our trading success. It takes a little time to understand the subtle nuances, however, as each trade is never the same, but once you master the rhythm so to speak, you will be saved from countless unnecessary losing trades. The following is a list of what we look for:
- A break/retest of supply or demand dependent on which way you’re trading.
- A trendline break/retest.
- Buying/selling tails/wicks – essentially we look for a cluster of very obvious spikes off of lower timeframe support and resistance levels within the higher timeframe zone.
- Candlestick patterns. We tend to stick with pin bars and engulfing bars as these have proven to be the most effective.
We search for lower timeframe confirmation between the M15 and H1 timeframes, since most of our higher-timeframe areas begin with the H4. Stops are usually placed 5-10 pips beyond confirming structures.
EUR/USD:
Across the board, the US dollar advanced against the majority of its major peers yesterday, according to the US dollar index. This – coupled with a hotter-than-expected US ADP nonfarm employment reading (offers a unique perspective on the labor market because of its payroll services) saw the single currency plummet from the H4 resistance area at 1.0646-1.0689. Psychological support at 1.06 was taken out, along with price momentarily whipsawing through the H4 double-bottom support at 1.0568 and coming within an inch of connecting with the H4 mid-way support 1.0550.
At the time of writing, the pair is seen within striking distance of retesting the underside of 1.06. Now, as far as we can see, 1.06 holds little meaning on the higher-timeframe picture. Daily price is seen loitering mid-range between a beaten-up supply at 1.0657-1.0626 and a triple-bottom support formation at 1.0520.Along the same vein, weekly action is also seen lurking mid-range between a long-term trendline resistance extended from the low 0.8231 and a support area coming in at 1.0333-1.0502.
Our suggestions: Considering the above points, and taking into account that our desk prefers to take trades that align with higher-timeframe structure, here’s what we’ve noted:
- For longs, we have our eye on the 1.05 handle still. On the account that 1.05 molds beautifully with the daily Quasimodo support at 1.0494 and also the top edge of the weekly support area at 1.0502, the 1.05 handle is, at least in our book of technical setups, stable enough to permit a pending buy order at 1.0495 with a stop placed below the head of the current daily Quasimodo formation at 1.0459.
- For shorts, the 1.07 neighborhood is reasonably striking. Granted, price will have to tackle the current H4 resistance area before reaching this level, but think of all those buy stops sitting just above this zone after the market has respected this zone three consecutive times! Additionally, 1.07 sits just 10 pips below a daily resistance at 1.0710, fuses with a nearby H4 AB=CD bearish formation at 1.0715 and a H4 61.8% Fib resistance (green line) at 1.0703.
Data points to consider: US Jobless claims at 1.30pm, followed by the US ISM manufacturing release at 3pm GMT.

Levels to watch/live orders:
- Buys: 1.0495 ([pending order] stop loss: 1.0459).
- Sells: 1.07 region ([waiting for lower timeframe confirming action is preferred since psychological boundaries are prone to fakeouts] stop loss: dependent on where one confirms the area).
GBP/USD:
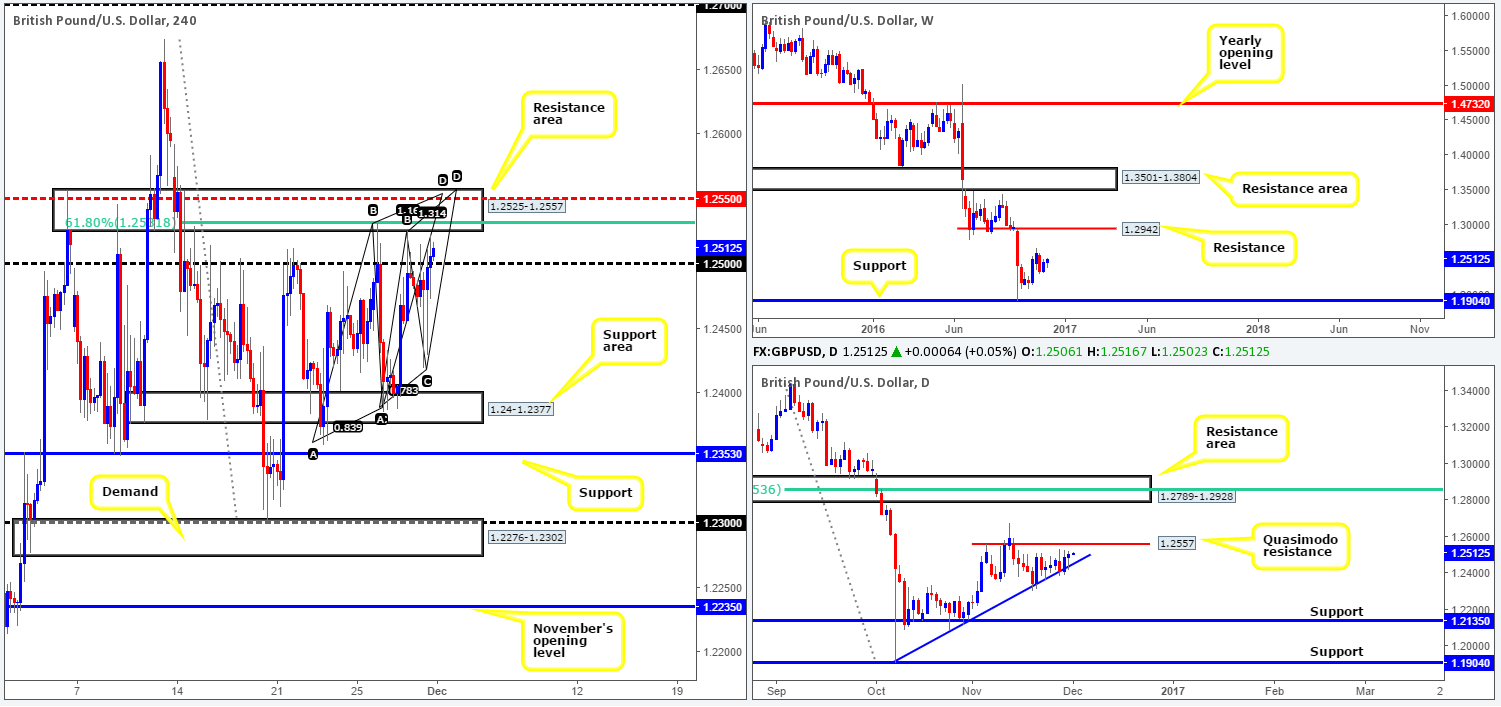
Diving straight into the (technical) action this morning, we can see that price finally conquered the 1.25 handle by yesterday’s close, which had capped downside since mid-Nov. With that being said, the team’s focus is now on the H4 resistance area planted just above at 1.2525-1.2557. The area boasts a H4 61.8% Fib resistance at 1.2531, a H4 mid-way resistance at 1.2550, TWO H4 AB=CD bearish completion points at 1.2553/1.2555 and the top edge of the H4 zone represents a daily Quasimodo resistance at 1.2557. Now, as we mentioned in previous reports, in view of the last point, this does mean there’s a chance that price could fake through our H4 resistance zone, so traders need to be prepared for that.
Our suggestions: While a fakeout above the aforementioned H4 resistance barrier is a possibility, we can still trade from here. Instead of placing a pending sell order and positioning stops just above the zone (not a good idea when a fakeout is likely), waiting for a reasonably sized H4 bearish candle to form within the walls of this region is by far, the safer, more conservative route to take here. This will, of course, not guarantee a winning trade, but will show that sellers have taken an interest here before we pull the trigger!
Data points to consider: UK manufacturing PMI at 9.30am. US Jobless claims at 1.30pm, followed by the US ISM manufacturing release at 3pm GMT.
Levels to watch/live orders:
- Buys: Flat (stop loss: N/A).
- Sells: 1.2557-1.2525 ([reasonably sized H4 bearish close required prior to pulling the trigger] stop loss: ideally beyond the trigger candle).
AUD/USD:
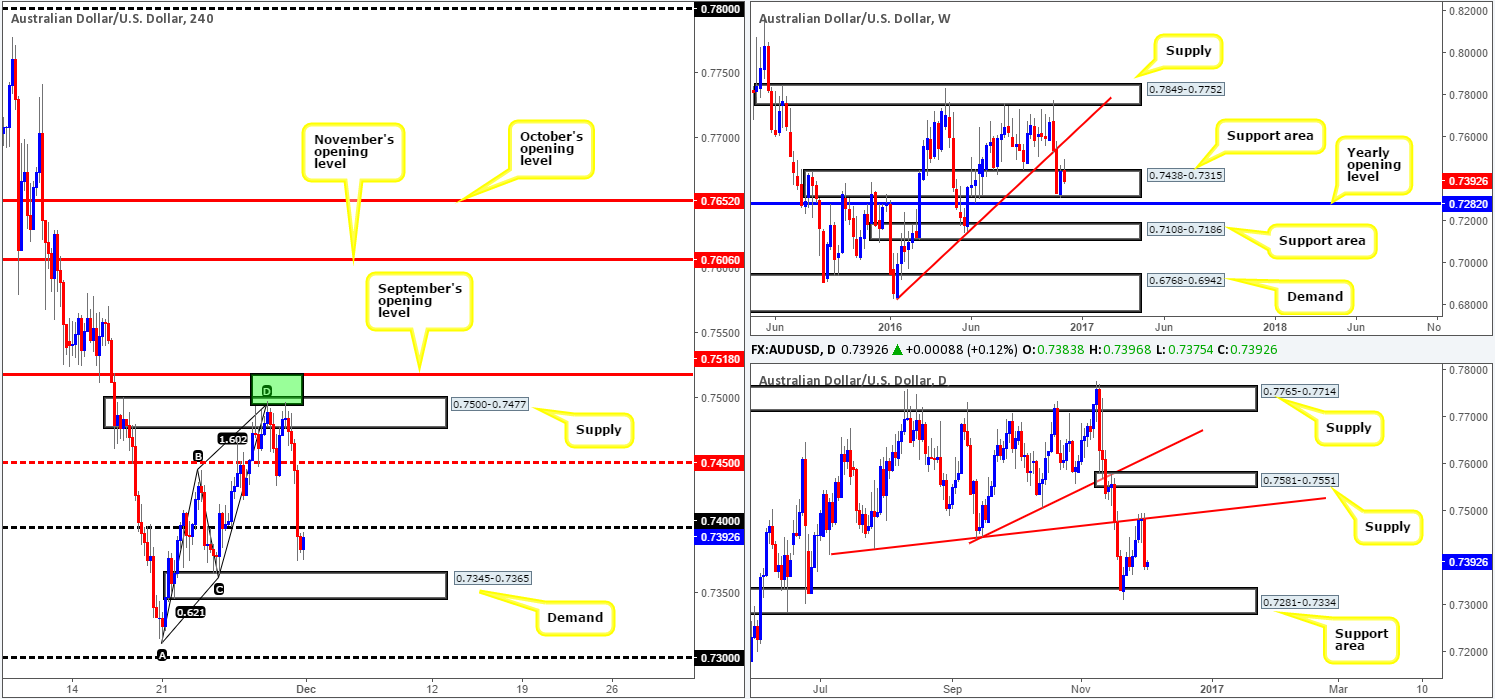
The AUD/USD experienced a significant downside move yesterday after retesting our pre-determined H4 sell zone at 0.7518/0.7494 (green area) for a second time. Apart from Aussie building approvals data released in early trading, which came in worse than expected, the pair looks to have also been affected by falling Chinese iron-ore futures that plunged over 8%!
H4 mid-way support 0.7450 and the psychological band 0.74 were both wiped out during this 100-pip depreciation. This begs the question, where does one go from here? Well, daily flow shows that there’s room to extend losses today down to a support area coming in at 0.7281-0.7334, while up on the weekly chart, the unit remains firmly fixed within a support area drawn from 0.7438-0.7315.
Our suggestions: Trading long from the immediate H4 demand seen at 0.7345-0.7365 is dicey according to the daily chart. Yes, it is supported by the current weekly support area, but it sits a little over 10 pips above the top edge of the aforementioned daily support area, thus suggesting a fakeout through this zone may be on the cards.
The next barrier beyond this H4 base can be seen at 0.73. A psychological hurdle that not only sits within the depths of the weekly support area, but it is also positioned nearby the 2016 yearly opening level at 0.7282 (seen just below the weekly support zone). In view of this, the 0.73 handle – coupled with the yearly opening level, in our estimation, offers enough confluence to consider trading long. Be that as it may, this is a rather small area and is potentially liable to being faked. Therefore, we would strongly recommend waiting for a reasonably sized H4 bullish candle to form here before pressing the buy button.
Data points to consider: Aussie private capital expenditure at 12.30am, Chinese manufacturing PMI at 1am/Caixin manufacturing PMI at 1.45am. US Jobless claims at 1.30pm, followed by the US ISM manufacturing release at 3pm GMT.
Levels to watch/live orders:
- Buys: 0.7282/0.73 ([reasonably sized H4 bullish close required prior to pulling the trigger] stop loss: ideally beyond the trigger candle).
- Sells: Flat (stop loss: N/A).
USD/JPY:
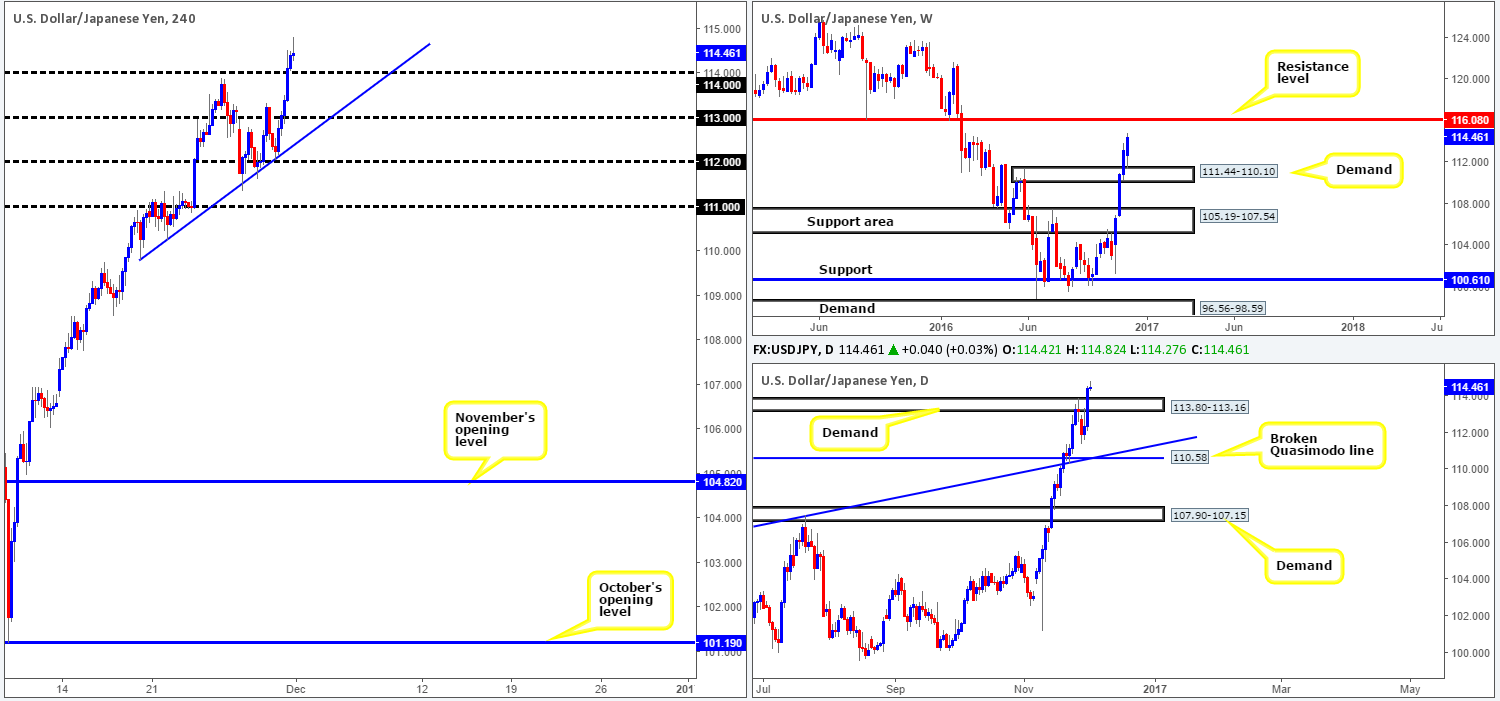
Coming in from the top, we can see that the current weekly candle looks in fine form this morning. Following the retest of a supply-turned demand seen at 111.44-110.10, the unit looks poised to attack the weekly resistance level penciled in at 116.08. Sliding down to the daily chart, the last fresh supply area at 113.80-113.16 was engulfed (now acting demand) during yesterday’s session, suggesting that the path, at least on the daily timeframe, is likely clear up to the aforementioned weekly resistance level. By the same token, H4 action, apart from the psychological hurdle 115 of course, shows little standing in the way of a move north to 116/H4 resistance at 116.29.
Our suggestions: The 114 handle along with the top edge of the recently broken daily supply at 113.80 offers a stable enough area to consider longs from today, targeting 115 and then eventually the 116/H4 resistance at 116.29. Setting a pending buy order here would not really be something we’d feel comfortable with simply for the fact that psychological barriers are, as we’re sure you’re already aware, prone to fakeouts.
Data points to consider today: US Jobless claims at 1.30pm, followed by the US ISM manufacturing release at 3pm GMT.
Levels to watch/live orders:
- Buys: 113.80/114 ([reasonably sized H4 bullish close required prior to pulling the trigger] stop loss: ideally beyond the trigger candle).
- Sells: Flat (stop loss: N/A).
USD/CAD:
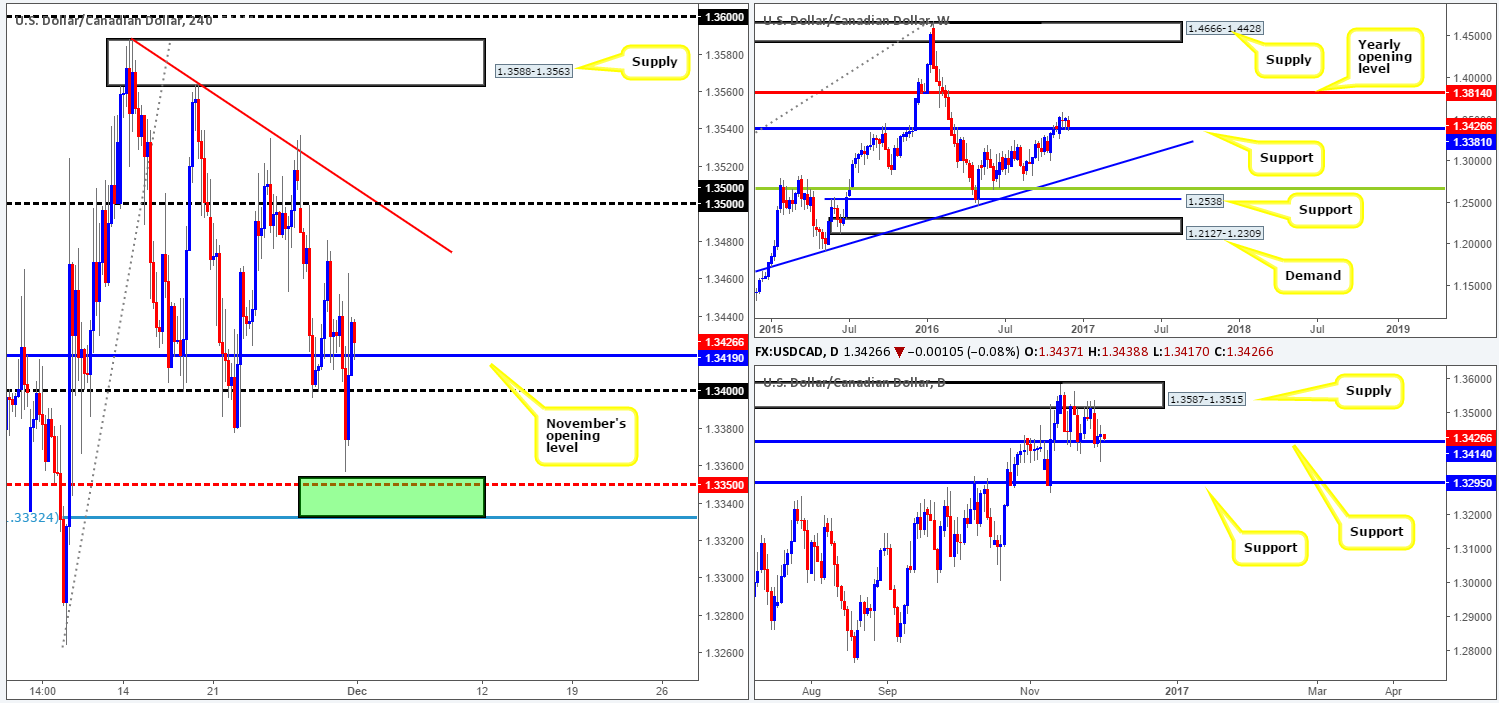
The oil market surged to highs of 49.87 yesterday, following OPEC’s recent deal to cut output. This, as you can see, sent the USD/CAD southbound going into the London morning segment and brought price to within a hair of our pre-determined H4 buy zone at 1.3332/1.3354 (green rectangle). The rebound from this area aggressively punched the unit back above 1.34 as well as November’s opening level at 1.3419, and now looks all set to extended further north up to the 1.35 neighborhood. 1.35 not only sits 15 pips below a daily supply barrier at 1.3587-1.3515, it also intersects soundly with a H4 trendline resistance taken from the high 1.3588.
Our suggestions: In essence the nuts and bolts of this pair can be summed up as follows: weekly price trading from support at 1.3381, daily price also trading from support at 1.3414 along with the H4 candles currently seen kissing the top edge of November’s opening hurdle. Therefore, with this in mind, our prime focus today will be driven toward looking for longs between 1.34/1.3419 (psychological handle/November’s opening line), targeting the 1.35 region.
Data points to consider today: US Jobless claims at 1.30pm, followed by the US ISM manufacturing release at 3pm GMT.
Levels to watch/live orders:
- Buys: 1.34/1.3419 ([reasonably sized H4 bullish close required prior to pulling the trigger] stop loss: ideally beyond the trigger candle).
- Sells: Flat (stop loss: N/A).
USD/CHF:
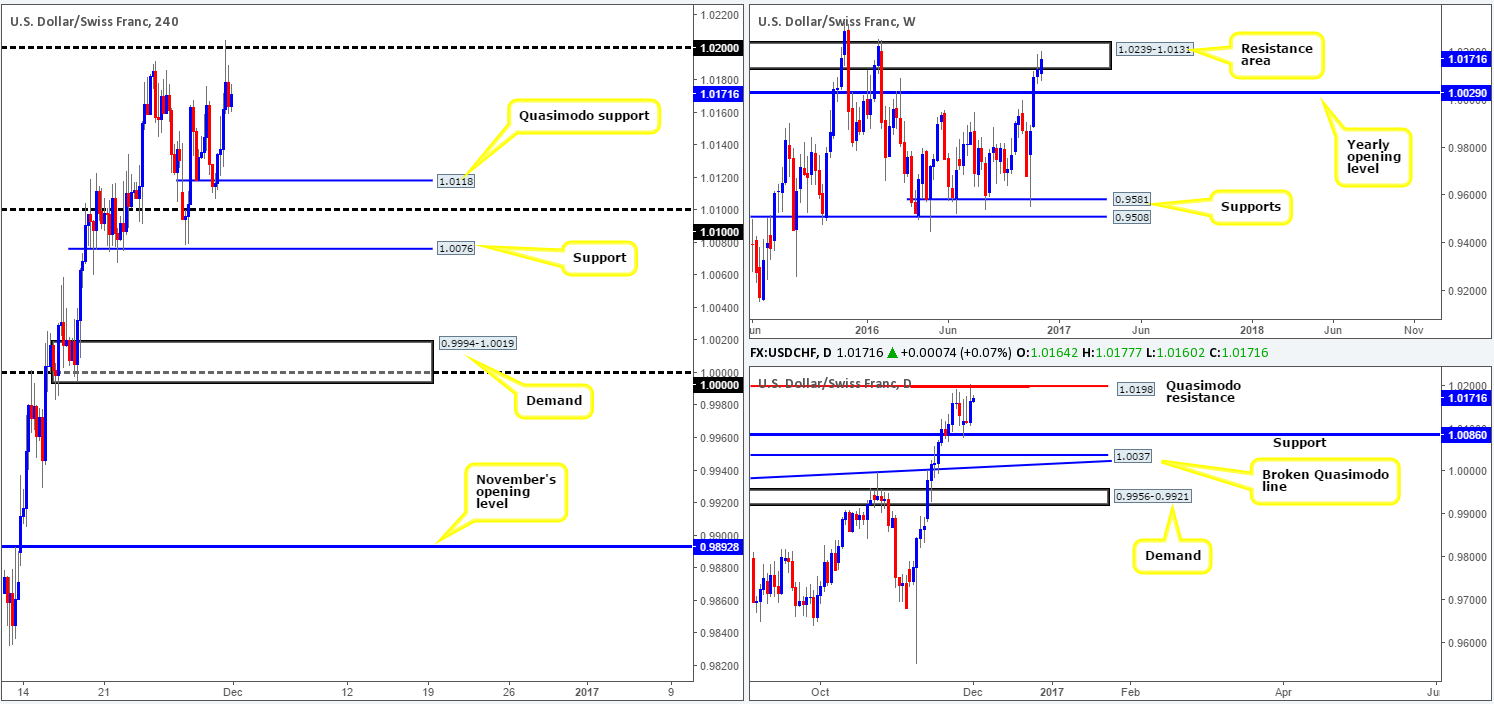
For those who read Wednesday’s report on the Swissy you may recall that our desk underscored the 1.02 boundary as a potential sell zone. 1.02 converges beautifully with a daily Quasimodo resistance at 1.0198, which is also positioned within a weekly resistance area at 1.0239-1.0131. Unfortunately, we were unable to pin down a lower timeframe confirming sell setup here, so well done to any of our readers who took the short! The next downside target according to the H4 scale falls in at 1.0118: a Quasimodo support, followed closely by the 1.01 handle. Since we know that price recently traded from a daily Quasimodo resistance as well as a weekly resistance area, we’re confident that the pair will very likely reach the H4 support targets mentioned above.
Our suggestions: In that we missed the first touch of 1.02 yesterday, we may get another chance today if price retests 1.02 for a second time. However, should this come to fruition, be prepared for a fakeout here, as a stop run is highly likely in order to achieve the liquidity required to sell (buy stops above 1.02 provide sellers liquidity to sell). As a result, we would only consider a trade from 1.02 on the basis that a reasonably sized H4 bearish candle forms beforehand.
Data points to consider today: US Jobless claims at 1.30pm, followed by the US ISM manufacturing release at 3pm GMT.
Levels to watch/live orders:
- Buys: Flat ([stop loss: N/A).
- Sells: 1.02 region ([reasonably sized H4 bearish close required prior to pulling the trigger] stop loss: ideally beyond the trigger candle).
DOW 30:
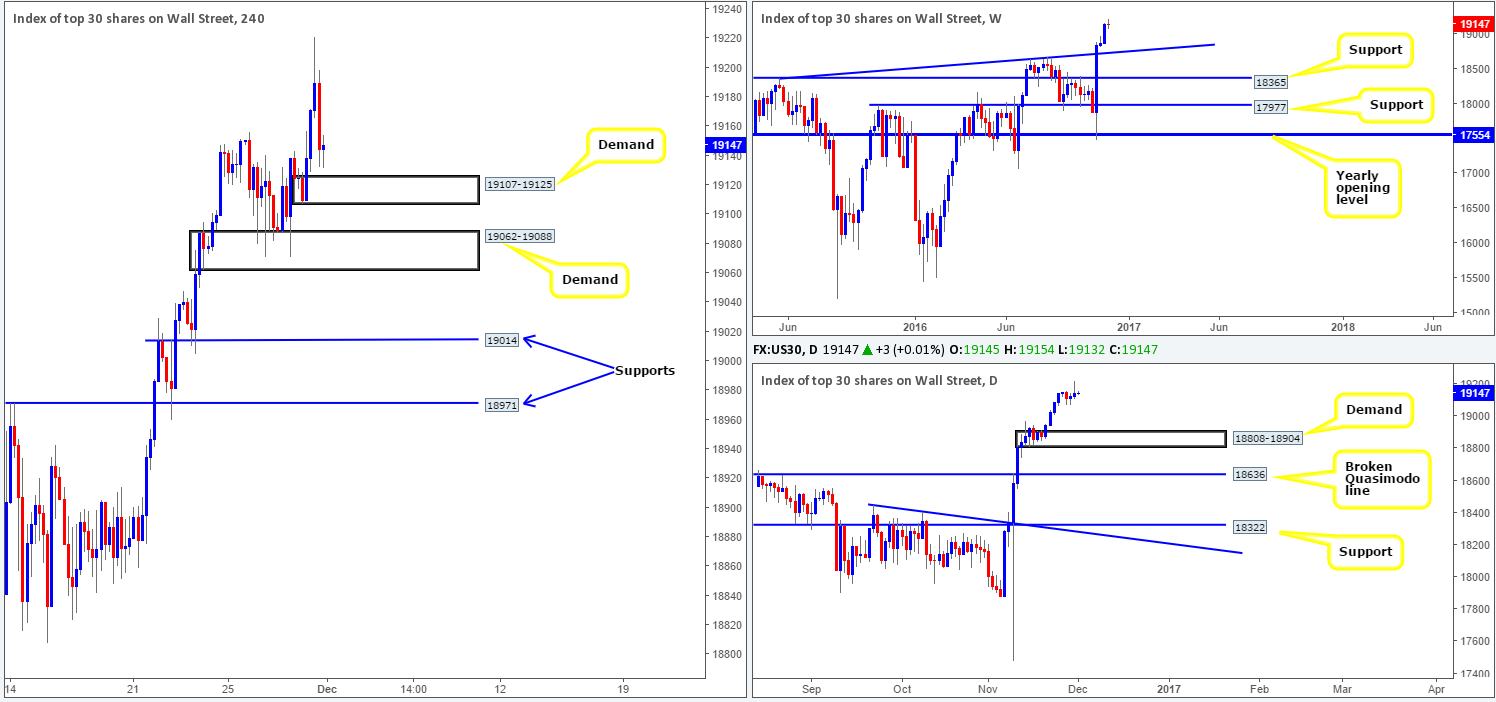
Equities began yesterday’s segment robustly, clocking a record high of 19221. However, shortly after this, risk appetite turned sour with the index spending the remainder of the day receding lower (consequently forming a daily bearish selling wick), despite a strong contribution by energy shares following open’s agreement to cut oil output.
In light of this recent movement, there are now two H4 demands in view. The first, the lower of the two, comes in at 19062-19088, which has already proven its valor by holding the market higher on Monday/Tuesday. The second is planted a little higher at 19107-19125 and has yet to be tested. Given the fact that there is absolutely no higher-timeframe resistance seen on the horizon, both zones are possible areas to consider for longs today. However, seeing as how neither barrier has any connection to higher-timeframe structure, we would strongly advise against placing pending orders here, despite how tempting it is to try and join the current uptrend! Rather, be patient and wait for a H4 bullish candle to form prior to pulling the trigger. This, of course, will not guarantee a winning trade, but will strengthen one’s chances at avoiding an unnecessary loss!
Data points to consider today: US Jobless claims at 1.30pm, followed by the US ISM manufacturing release at 3pm GMT.
Levels to watch/live orders:
- Buys: 19107-19125 ([reasonably sized H4 bullish close required prior to pulling the trigger] stop loss: ideally beyond the trigger candle). 19062-19088 ([reasonably sized H4 bullish close required prior to pulling the trigger] stop loss: ideally beyond the trigger candle).
- Sells: Flat (stop loss: N/A).
GOLD:
Gold took a hit to the mid-section during the course of yesterday’s sessions as dollar bulls pushed to higher ground. The H4 demand at 1178.5-1182.4 was consumed (now acting supply) as well as, in recent hours, daily support at 1169.8. Supposing that this level now offers the market resistance, the next downside target seen on the H4 chart comes in at 1145.1-1150.9: a H4 demand. Be that as it may, should a close be seen beyond the daily support on a daily basis, the bears could theoretically push the yellow metal down as far as the daily demand area seen at 1108.2-1117.8. Looking up to the weekly candles, nevertheless, a weekly close below the current weekly support area at 1205.6-1181.3 could open up the floodgates to a longer-term support target of 1071.3-1097.2: a weekly demand area.
As you can see from the above notes, there is certainly scope for more downside in this market. When, and by how far is, of course, difficult to determine. Nonetheless, with a December rate hike now priced in at 94%, according to the CME group Fedwatch tool, this depreciation could very well become a reality in the near future!
Our suggestions: While the sellers are boasting incontrovertible strength at the moment, we would much prefer to see a daily close form beyond the current daily support before our desk feels comfortable hunting for shorts. Of course, a weekly close beyond the weekly support area would be an added bonus! Therefore, at least for today’s sessions, we’ll hit the sidelines and reassess going into tomorrow’s segment.
Levels to watch/live orders:
- Buys: Flat (stop loss: N/A).
- Sells: Flat (stop loss: N/A).