Waiting for lower timeframe confirmation is our main tool to confirm strength within higher timeframe zones, and has really been the key to our trading success. It takes a little time to understand the subtle nuances, however, as each trade is never the same, but once you master the rhythm so to speak, you will be saved from countless unnecessary losing trades. The following is a list of what we look for:
- A break/retest of supply or demand dependent on which way you’re trading.
- A trendline break/retest.
- Buying/selling tails/wicks – essentially we look for a cluster of very obvious spikes off of lower timeframe support and resistance levels within the higher timeframe zone.
We typically search for lower-timeframe confirmation between the M15 and H1 timeframes, since most of our higher-timeframe areas begin with the H4. Stops are usually placed 1-3 pips beyond confirming structures.
EUR/USD:
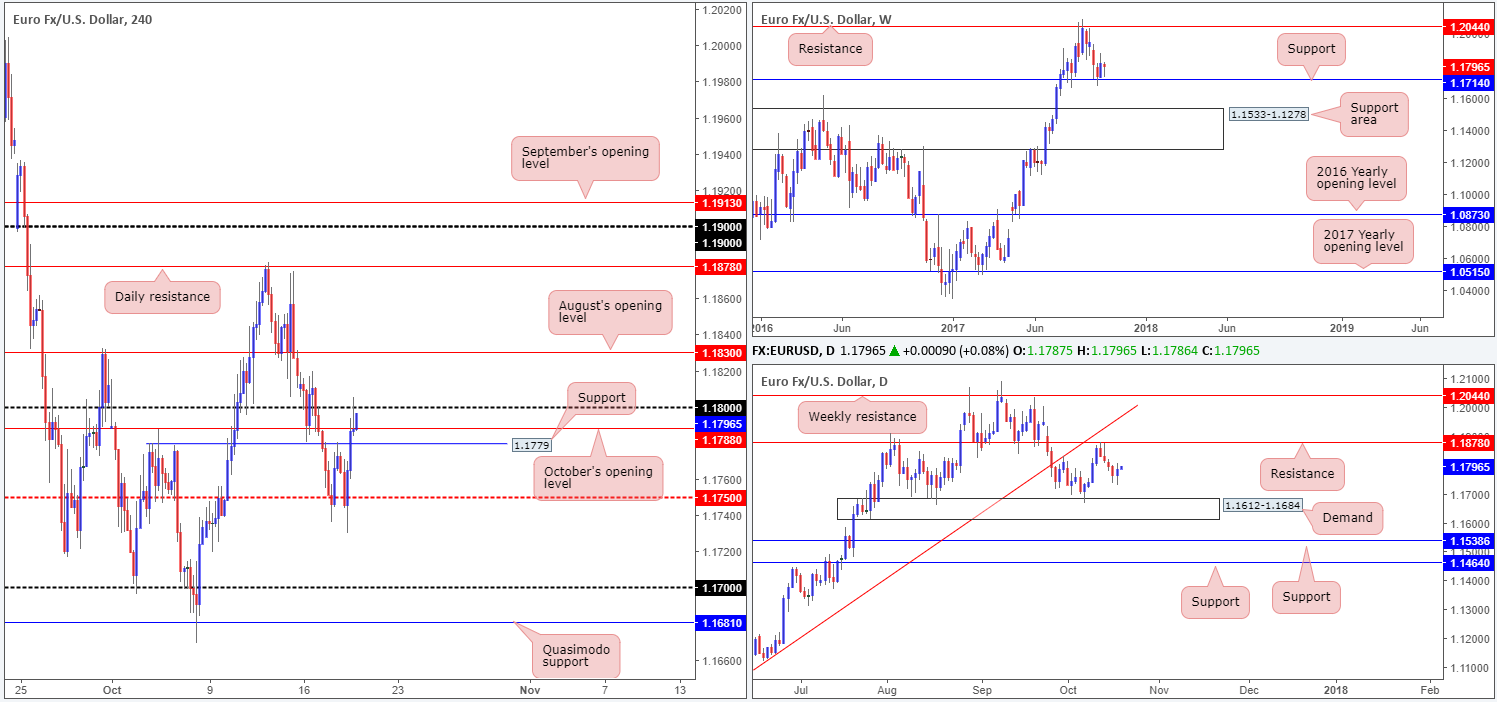
In recent trading, the EURUSD recovered some lost ground after failing to close outside the H4 mid-level support 1.1750. While a small 11-pip reaction was seen from the nearby H4 resistance at 1.1779 (see M30 chart), it wasn’t enough to stop price from gravitating to the 1.18 handle – it was just too much of a magnet for price, unfortunately.
As we write, the bulls appear to have a slight edge in this market this morning, despite the H4 bearish selling wick printed from 1.18 into the close. Daily price formed a bullish engulfing candle along with weekly bulls seen reinforced by support pegged at 1.1714.
Suggestions: In spite of 1.18 looking somewhat vulnerable right now, a long above this number is awkward since we have August’s opening level lurking just above at 1.1830. Beyond this line, however, 50 pips of space is seen to move up to daily resistance plotted at 1.1878.To that end, we feel that longs would be best placed above 1.1830.
Data points to consider: US unemployment claims and Philly Fed manufacturing index at 1.30pm GMT+1.
Levels to watch/live orders:
- Buys: Watch for H4 price to engulf 1.1830 and then look to trade any retest seen thereafter ([waiting for a lower-timeframe buy signal to form [see the top of this report] following the retest is advised] stop loss: dependent on where one confirms the area).
- Sells: Flat (stop loss: N/A).
GBP/USD:
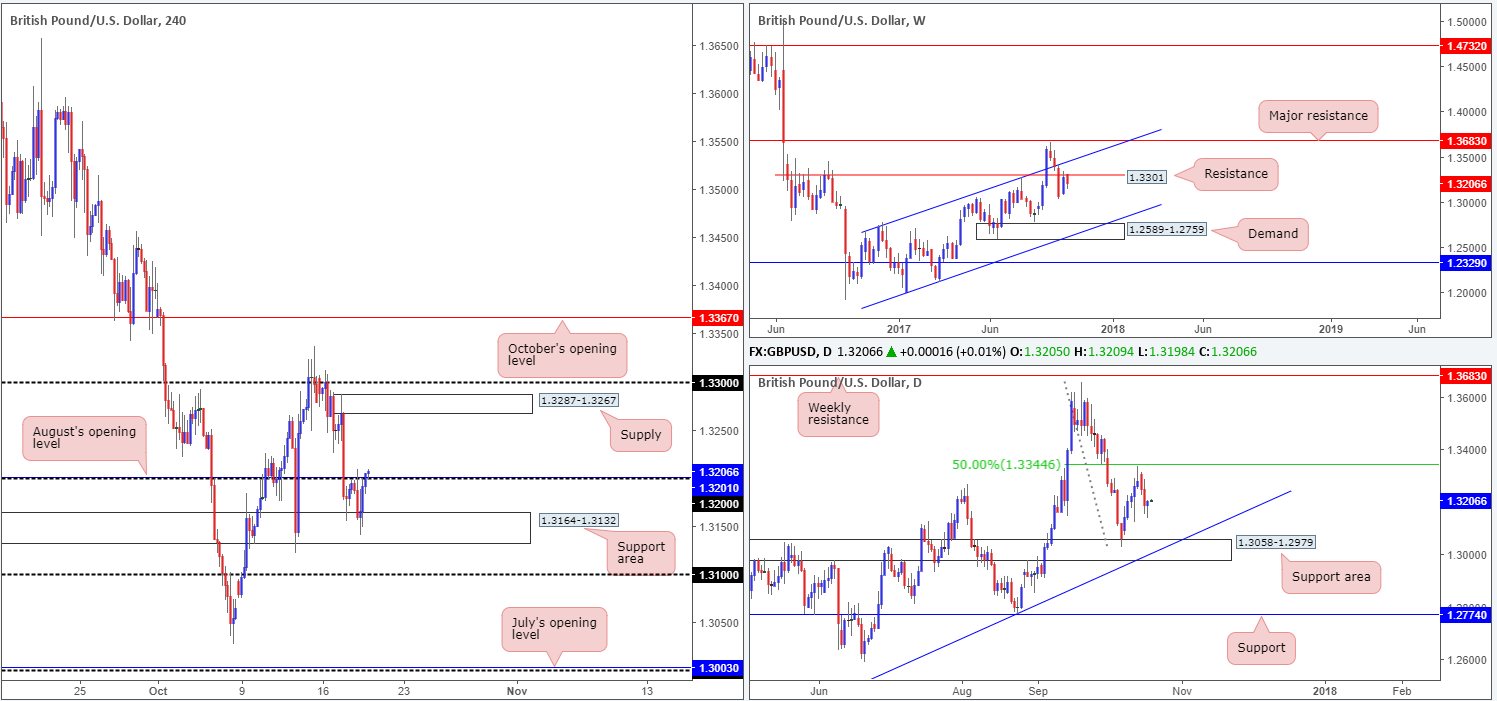
The impact of yesterday’s UK job’s data saw the British pound fall to a low of 1.3140, following an aggressive upside move to a high of 1.3208, which likely triggered stops sited above 1.32. As is evident from the H4 timeframe though, the move was unable to push below the support area pegged at 1.3164-1.3132.
Moving forward, H4 price is now see peeking above the 1.32 handle/August’s opening level at 1.3201. With sellers likely weakened here from yesterday’s spike, this should not come as a surprise. In the event that price holds firm beyond this number, the next upside objective can be seen at supply drawn from 1.3287-1.3267, shadowed closely by the 1.33 handle.
Supporting this move is a recently formed daily buying tail. With that being said, however, it might be worth noting that the candle formation was formed without any credible support on the daily scale. In addition to this, let’s not forget that weekly price is currently trading from resistance marked at 1.3301!
Suggestions: Although H4 price shows room to press higher, we really do not like where weekly price is trading from at the moment. For that reason, we’re going to refrain from initiating a buy at 1.32.
Data points to consider: UK retail sales m/m at 9.30am; US unemployment claims and Philly Fed manufacturing index at 1.30pm GMT+1.
Levels to watch/live orders:
- Buys: Flat (stop loss: N/A).
- Sells: Flat (stop loss: N/A).
AUD/USD:
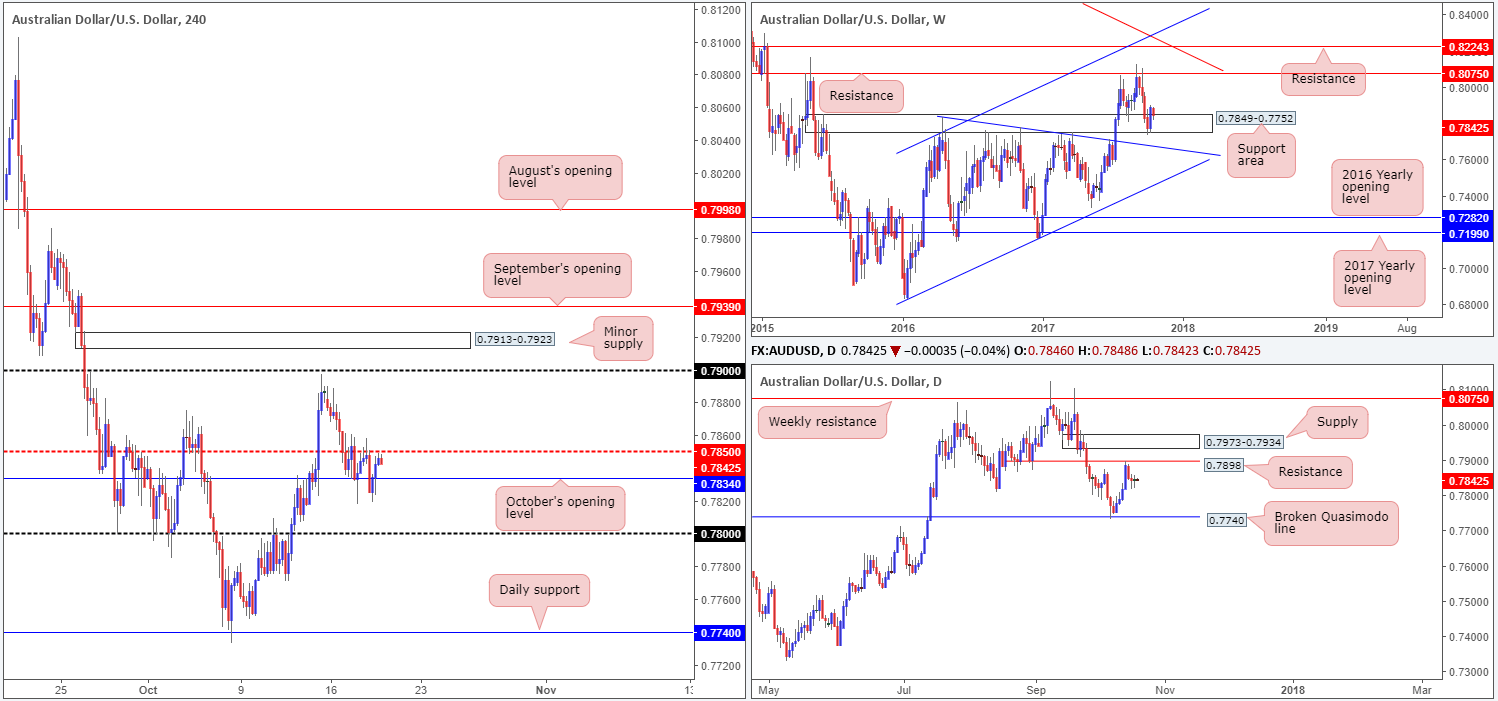
The Aussie dollar is effectively unchanged this morning.
Despite a drop to lows of 0.7819 during yesterday’s London morning segment, the H4 candles are, once again, seen kissing the underside of mid-level resistance 0.7850. Technically speaking, we feel that 0.7850 is incredibly vulnerable at this point and a move up to the 0.79 handle may be on the cards. We say this not because of the amount of times 0.7850 has been challenged and may be weak, but because of where weekly price is trading from. The weekly support area pegged at 0.7849-0.7752 boasts strong historical significance that stretches back as far as April 2016. Also of particular interest is the daily picture. While daily price is not trading from a support right now, it does show room to move north up to resistance at 0.7898, which happens to conveniently sit a few pips below the 0.79 handle.
Suggestions: A decisive push above 0.7850, followed up with a retest and a lower-timeframe buy signal (see the top of this report) would be enough to validate an intraday long up to 0.79. Be that as it may, just around the corner is Australian employment and Chinese GDP/ industrial production figures, so a trade cautiously!
Data points to consider: AUD job’s figures at 1.30am; Chinese growth data q/y and industrial production y/y at 3am; US unemployment claims and Philly Fed manufacturing index at 1.30pm GMT+1.
Levels to watch/live orders:
- Buys: Watch for H4 price to engulf 0.7850 and then look to trade any retest seen thereafter ([waiting for a lower-timeframe buy signal to form following the retest is advised] stop loss: dependent on where one confirms the level).
- Sells: Flat (stop loss: N/A).
USD/JPY:
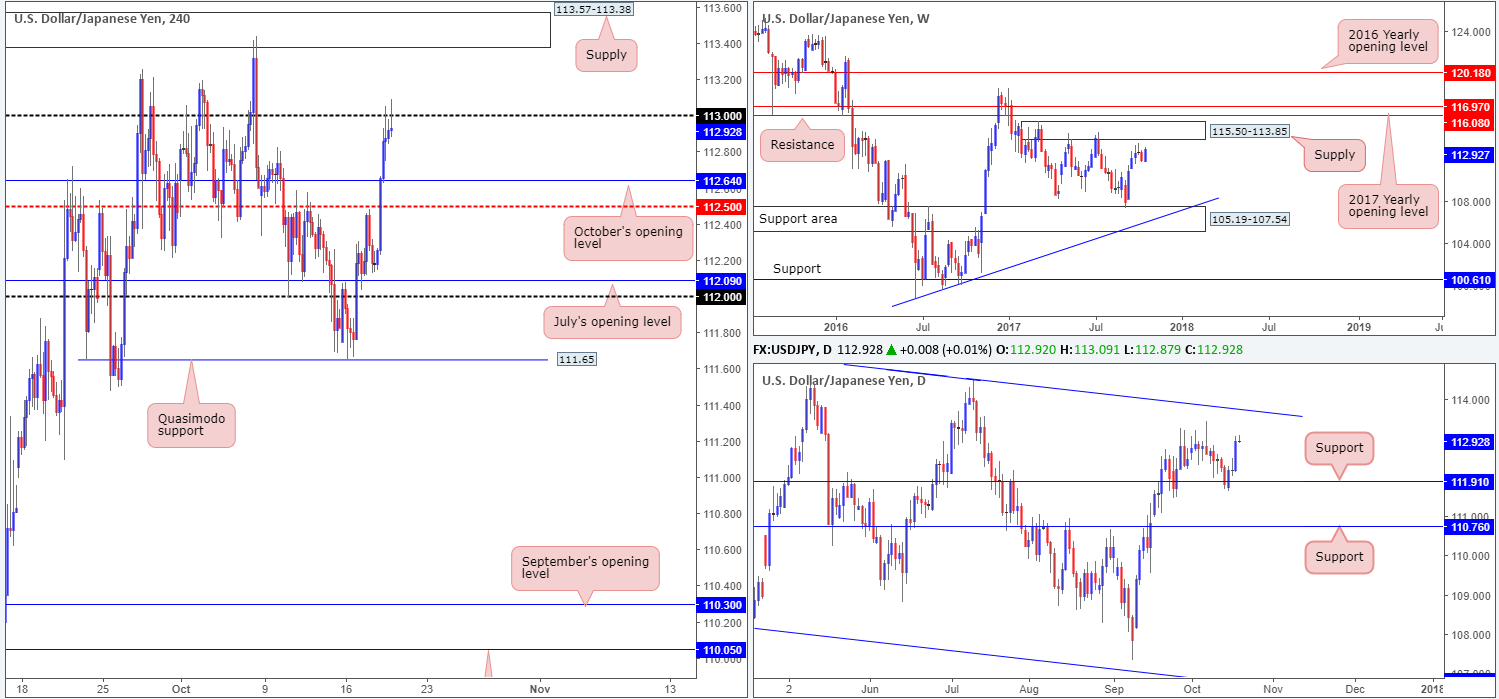
Kicking this morning’s report off with a look at the weekly timeframe, it’s clear to see that the candles are currently facing in the direction of supply at 115.50-113.85. In conjunction with weekly price, daily action also looks poised to gravitate up to a trendline resistance extended from the high 115.50, which happens to intersect with the noted weekly supply.
A little lower on the curve, however, H4 price is seen trading from the 113 handle. Before weekly buyers can lay claim to the aforementioned weekly supply, both 113 and the H4 supply at 113.57-113.38 will need to be taken out. This will, according to our analysis, open up the doors for price to challenge the 114 handle.
Suggestions: In view of both the weekly and daily charts showing further upside could be upon us, we have absolutely no interest in shorting from 113. Instead, we’re now watching for H4 price to print a close above this psychological band. A decisive move beyond here, along with a retest and a lower-timeframe confirming buy signal (see the top of this report) would, in our opinion, be enough to warrant a long position, with an ultimate take-profit level placed around the underside of weekly supply at 113.85/114 handle.
Data points to consider: US unemployment claims and Philly Fed manufacturing index at 1.30pm GMT+1.
Levels to watch/live orders:
- Buys: Watch for H4 price to engulf 113 and then look to trade any retest seen thereafter ([waiting for a lower-timeframe buy signal to form following the retest is advised] stop loss: dependent on where one confirms the level).
- Sells: Flat (stop loss: N/A).
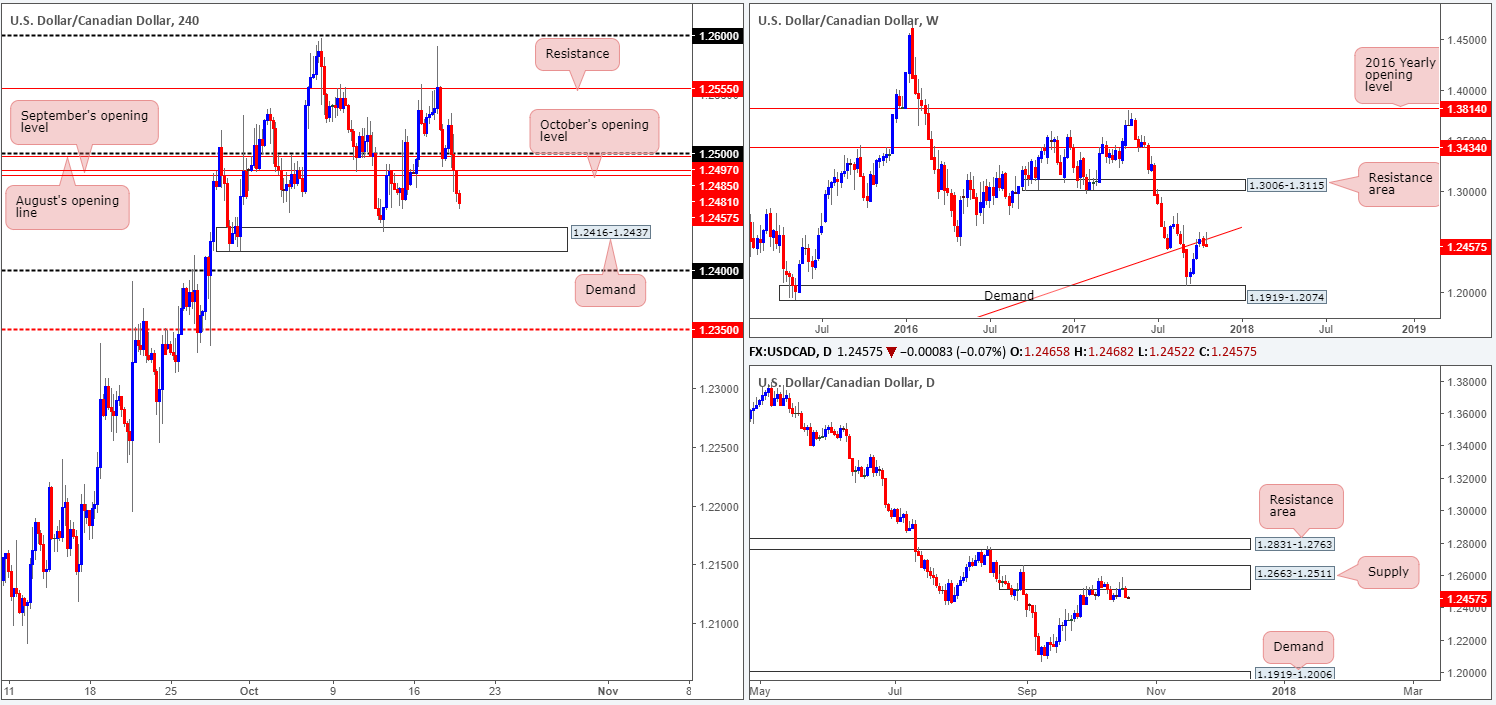
USD/CAD:
As anticipated, a bounce from 1.2481/1.25 (on the H4 timeframe) took shape, and even managed to reach a high of 1.2533. After the release of US and Canadian economic data, however, bullish sentiment quickly diminished and eventually pulled the USD/CAD below the noted H4 zone, ending the day touching a low of 1.2458. The next port of call on the H4 scale, should the bears continue to press lower, can be seen at demand drawn from 1.2416-1.2437, followed closely by the 1.24 handle.
As we underscored in several reports already, a move lower in this market should not come as a surprise to any technician who follows a multi-timeframe approach. On the weekly timeframe, we can see that the buyers and sellers are currently battling for position around the underside of a trendline resistance extended from the low 0.9633. In conjunction with the weekly timeframe, the daily timeframe shows that the candles remain fixed at supply drawn from 1.2663-1.2511.
Suggestions: With higher-timeframe structure in mind and the clear downtrend this market has been in since May, entering long in this market is not something we would stamp high probability.
Selling this unit on the other hand would, in our technical view, only be possible below 1.24 since there we have at least 50 pips of free running space down to the H4 mid-level support 1.2350. This gives one some breathing space before potential buyers enter the fray.
Data points to consider: US unemployment claims and Philly Fed manufacturing index at 1.30pm GMT+1.
Levels to watch/live orders:
- Buys: Flat (stop loss: N/A).
- Sells: Watch for H4 price to cross below 1.24 and then look to trade any retest seen thereafter ([waiting for a lower-timeframe sell signal to form [see the top of this report] following the retest is advised] stop loss: dependent on where one confirms the area).
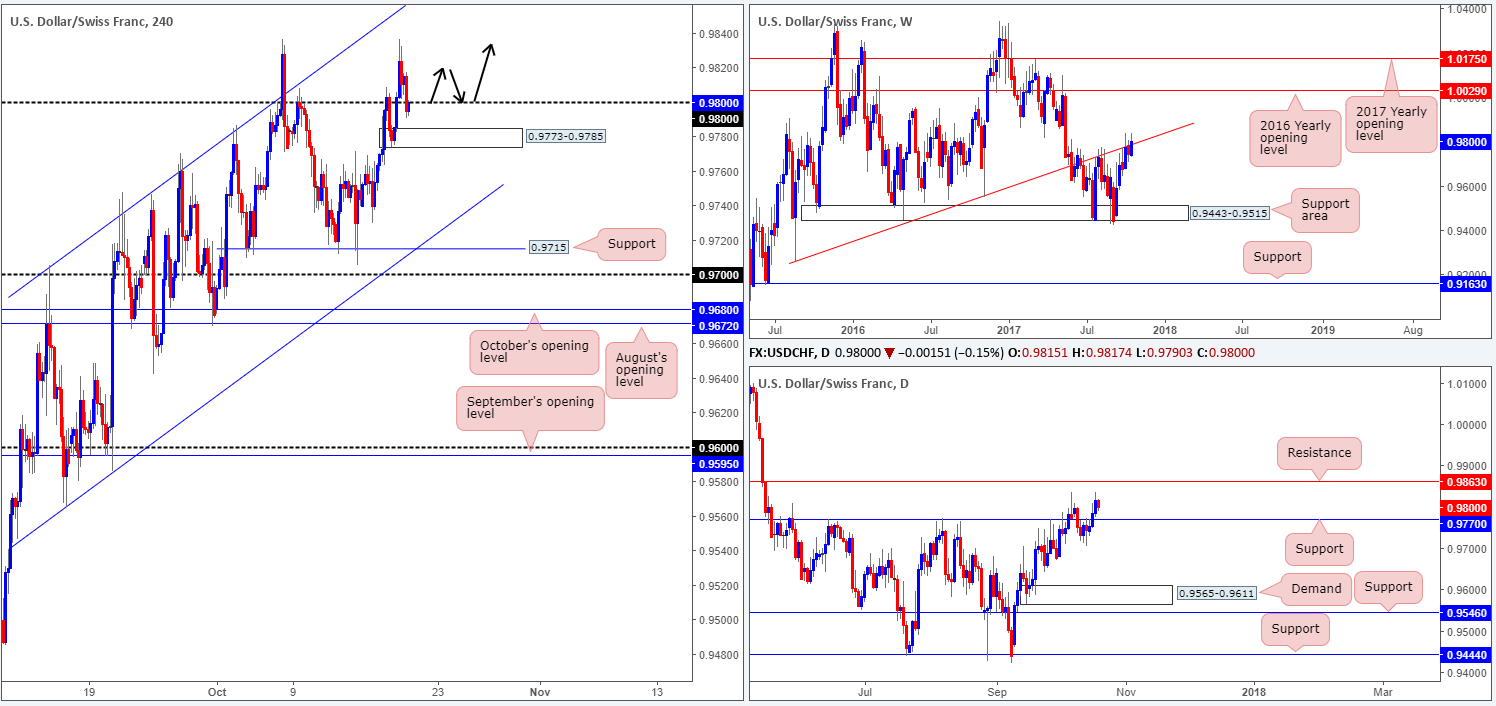
USD/CHF:
In recent hours, the USD/CHF run through bids at 0.98, after discovering a strong pocket of offers around the 6th Oct high (0.9836) amid early US trading on Wednesday. Stop-loss orders below 0.98, as we write, are currently being chewed up, consequently forcing the current H4 candle to retest the underside of 0.98 as resistance.
Looking at the higher-timeframe structure right now, daily bulls show spirit above support at 0.9770, with price registering its third consecutive bullish close on Wednesday and now likely heading for resistance at 0.9863. Also noteworthy is the weekly timeframe, as sellers appear to be weakening their stance from the underside of a trendline resistance carved from the low 0.9257.
Suggestions: With H4 demand loitering just beneath 0.98 at 0.9773-0.9785 (likely the decision point to initially push above 0.98) and daily price showing promise to the upside, a short from 0.98 is not something we’d involve ourselves in. On the flip side, a move back above 0.98, followed up with a retest and a H4 bullish candle (preferably in the shape of a full or near-full-bodied candle) would, in our book, be enough to warrant a buy trade, targeting daily resistance at 0.9863.
Data points to consider: US unemployment claims and Philly Fed manufacturing index at 1.30pm GMT+1.
Levels to watch/live orders:
- Buys: Watch for H4 price to close back above 0.98 and then look to trade any retest thereafter ([waiting for a reasonably sized H4 bullish candle to form – preferably a full, or near-full-bodied candle – is advised] stop loss: ideally beyond the candle’s tail).
- Sells: Flat (stop loss: N/A).
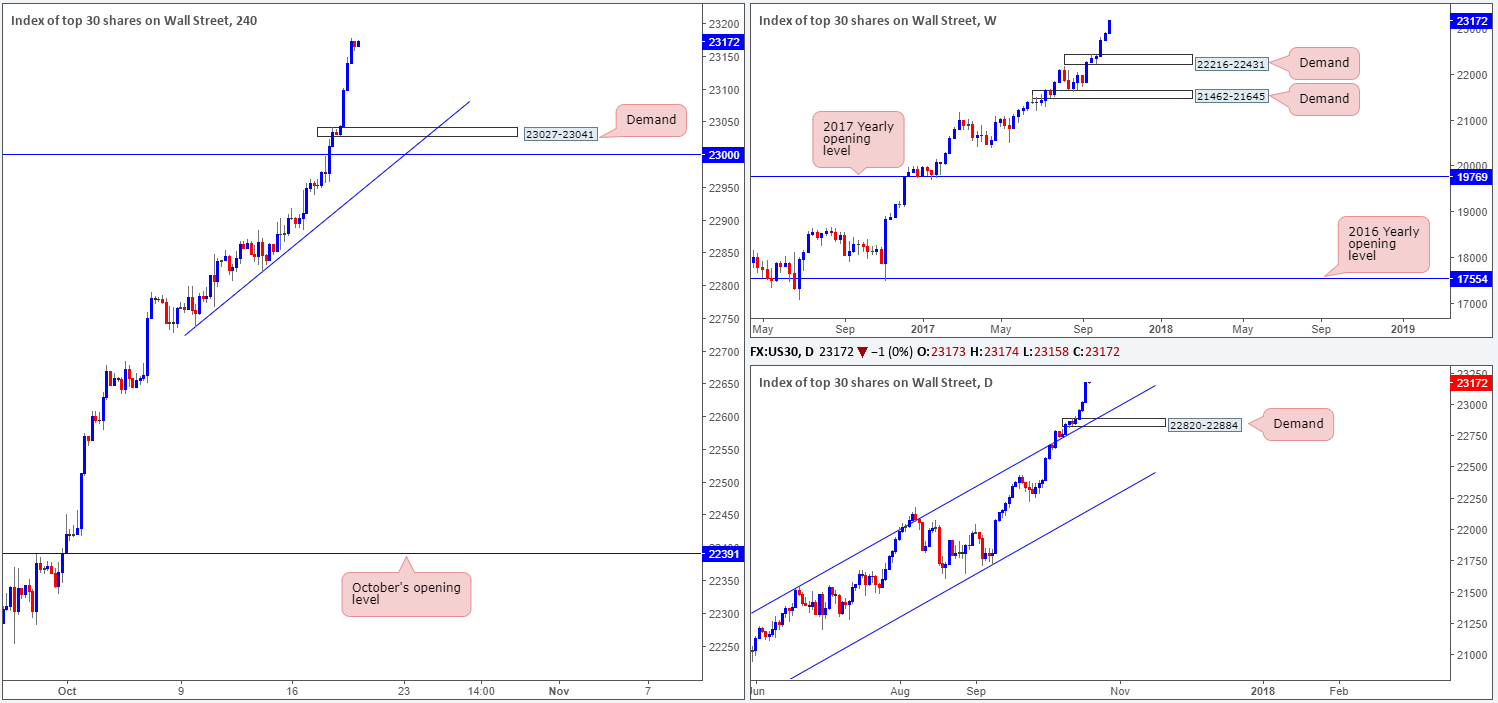
DOW 30:
The DJIA registered its biggest gain in five weeks on Wednesday, thumping its way to a record high of 23178. According to Bloomberg, US stocks were bolstered by IBM’s forecast for its first sales growth in five years, sending its shares to their biggest advance since 2009.
On the weekly timeframe, a pullback in this market could see demand drawn from 22216-22431 come into the picture. On the daily timeframe, however, the next demand in view is seen at 22820-22884, while on the H4 timeframe the closest demand is pegged just above the 23000 landmark at 23027-23041.
Suggestions: This is certainly a buyers’ market right now. As a result, any dips seen could be considered opportunities to enter long. For us though, we will want to see price reverse recent gains and cross swords with the aforementioned H4 demand zone before we contemplate buying. What's more, we would also recommend not setting pending buy orders at this area as a fakeout down to 23000 is highly likely to take place.
Data points to consider: US unemployment claims and Philly Fed manufacturing index at 1.30pm GMT+1.
Levels to watch/live orders:
- Buys: 23027-23041 ([waiting for a reasonably sized H4 bullish candle to form – preferably a full, or near-full-bodied candle – is advised] stop loss: ideally beyond the candle’s tail)
- Sells: Flat (stop loss: N/A).
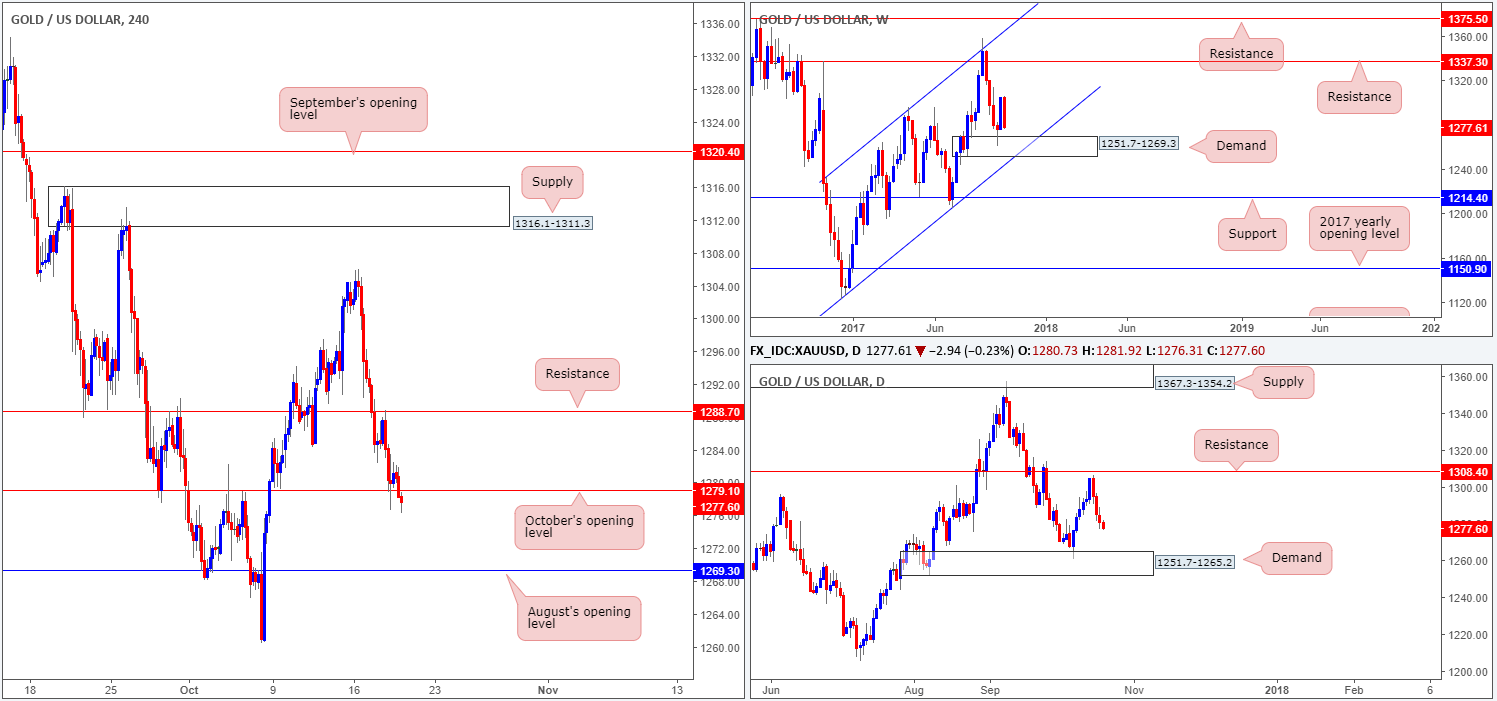
GOLD:
Since the beginning of the week, the yellow metal has been trading in the red. In fact, as we write, nearly all of last week’s gains have already been erased!
For those who read Wednesday’s report you may recall that a possible short was highlighted from H4 resistance at 1279.1. Initially we were looking for a lower-timeframe entry, but ended up entering short based on the H4 bearish engulfing candle at 1284.0. Stops were quickly moved to breakeven once price shook hands with October’s opening level at 1279.1. We came close to being stopped out following this, but managed to survive, with price now comfortably trading sub 1279.1.
With 1279.1 now likely out of the picture, the next downside target on the H4 scale can be seen at 1269.3: August’s opening level. In addition to this, daily price also shows room for further downside to demand plotted at 1251.7-1265.2.
Suggestions: Given the current landscape, we have little problem holding our current short position. Ultimately, we’ll be looking for the unit to strike August’s opening level/the top edge of daily demand before we take profits.
Levels to watch/live orders:
- Buys: Flat (stop loss: N/A).
- Sells: 1284.0 (stop loss: breakeven).