
A note on lower timeframe confirming price action…
Waiting for lower timeframe confirmation is our main tool to confirm strength within higher timeframe zones, andhas really been the key to our trading success. It takes a little time to understand the subtle nuances, however, as each trade is never the same, but once you master the rhythm so to speak, you will be saved from countless unnecessary losing trades. The following is a list of what we look for:
- A break/retest of supply or demand dependent on which way you’re trading.
- A trendline break/retest.
- Buying/selling tails – essentially we look for a cluster of very obvious spikes off of lower timeframe support and resistance levels within the higher timeframe zone.
- Candlestick patterns. We tend to only stick with pin bars and engulfing bars as these have proven to be the most effective.
For us, lower timeframe confirmation starts on the M15 and finishes up on the H1, since most of our higher timeframe areas begin with the H4.
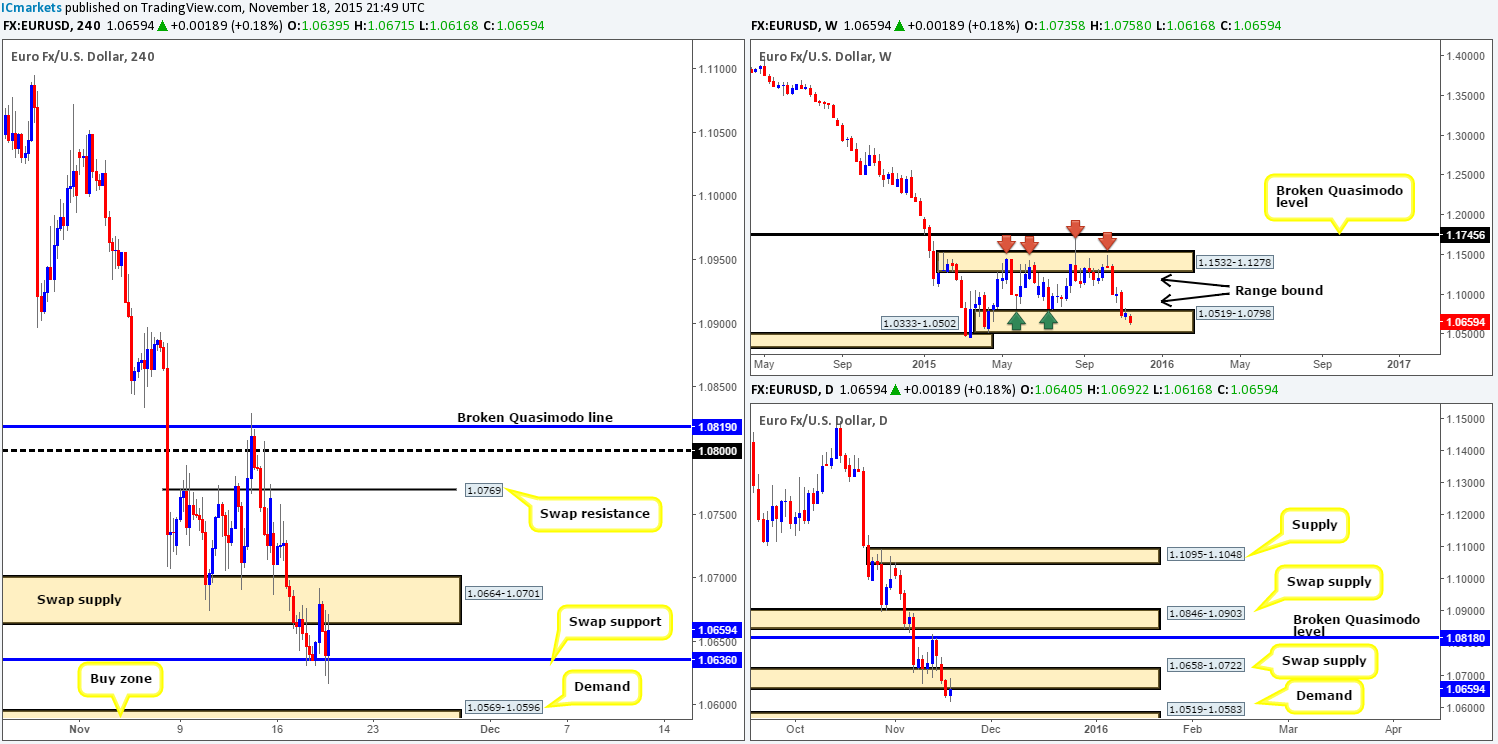
EUR/USD:
Throughout the course of yesterday’s trading, buying and selling remained fixed between a H4 swap support level coming in at 1.0636 and the H4 swap supply area seen at 1.0664-1.0701. Given this somewhat sluggish performance, here is what we have jotted down so far for today’s upcoming sessions…
- Weekly action is now buried deep within a weekly (range) demand at 1.0519-1.0798.
- Down on the daily chart, price has just retested the underside of a recently broken demand at 1.0658-1.0722, which, as you can see, shows room to push lower towards demand drawn from 1.0519-1.0583.
- Given the above, we have no interest in trading the current H4 swap support due to the possibility of further selling on the daily chart. In addition to this, we also believe the current H4 swap supply is too risky in light of where price is positioned on the weekly chart (see above). What we are interested in, however, is the H4 demand lurking just below at 1.0569-1.0596. Not only is this beast supported by both weekly and daily demand (1.0519-1.0798/1.0519-1.0583), it also boasts psychological support from 1.0600.Considering this area’s higher timeframe confluence, we would, dependent on what news was being released at the time, look to enter long here at market.
Levels to watch/live orders:
- Buys:1.0569-1.0596 (Stop loss: 1.0566).
- Sells:Flat (Stop loss: N/A).
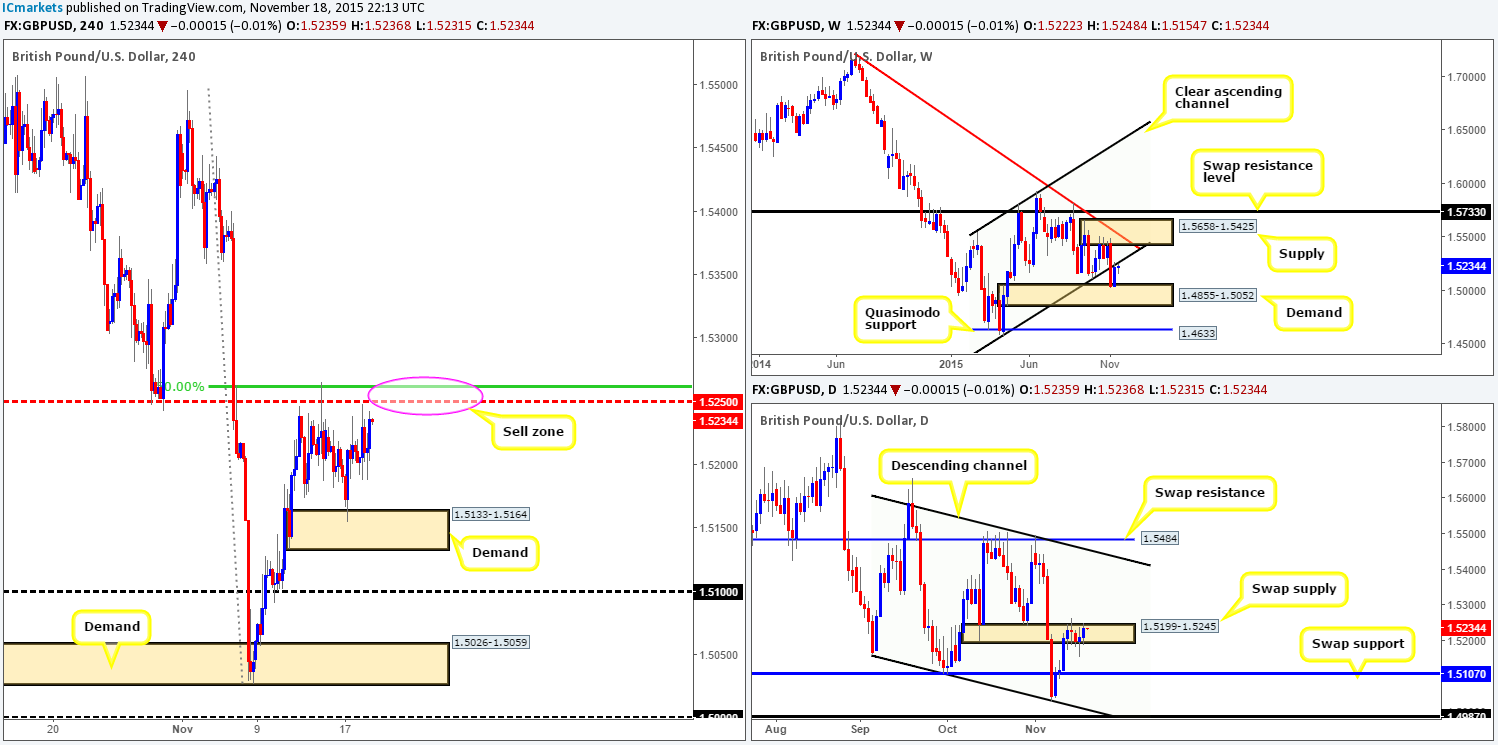
GBP/USD:
In our previous report (http://www.icmarkets.com/blog/wednesday-18th-november-heavy-volatility-possible-on-usd-related-pairs-at-1-30pm-and-also-at-7-00pm-gmt-remain-vigilant/), we mentioned that we had our eye on the mid-level barrier 1.5250 for a confirmed short yesterday. As can be seen from the H4 chart, price missed our sell zone by a mere 1.5 pips before selling off!
All is not lost here we believe. With price still kissing the underside of the recently broken weekly channel support-turned resistance line (1.4564), and daily action trading within a swap supply zone at 1.5199-1.5245, 1.5250 still remains a key reversal zone to watch going into today’s sessions.
However, given how close price came to 1.5250, and the fact that fixed levels such as these are prone to some very nasty fakeouts, we would highly recommend only trading this number should lower timeframe confirmation be seen beforehand.
Levels to watch/ live orders:
- Buys: Flat (Stop loss: N/A).
- Sells: 1.5250 [Tentative – confirmation required] (Stop loss: dependent on where one confirms this level).
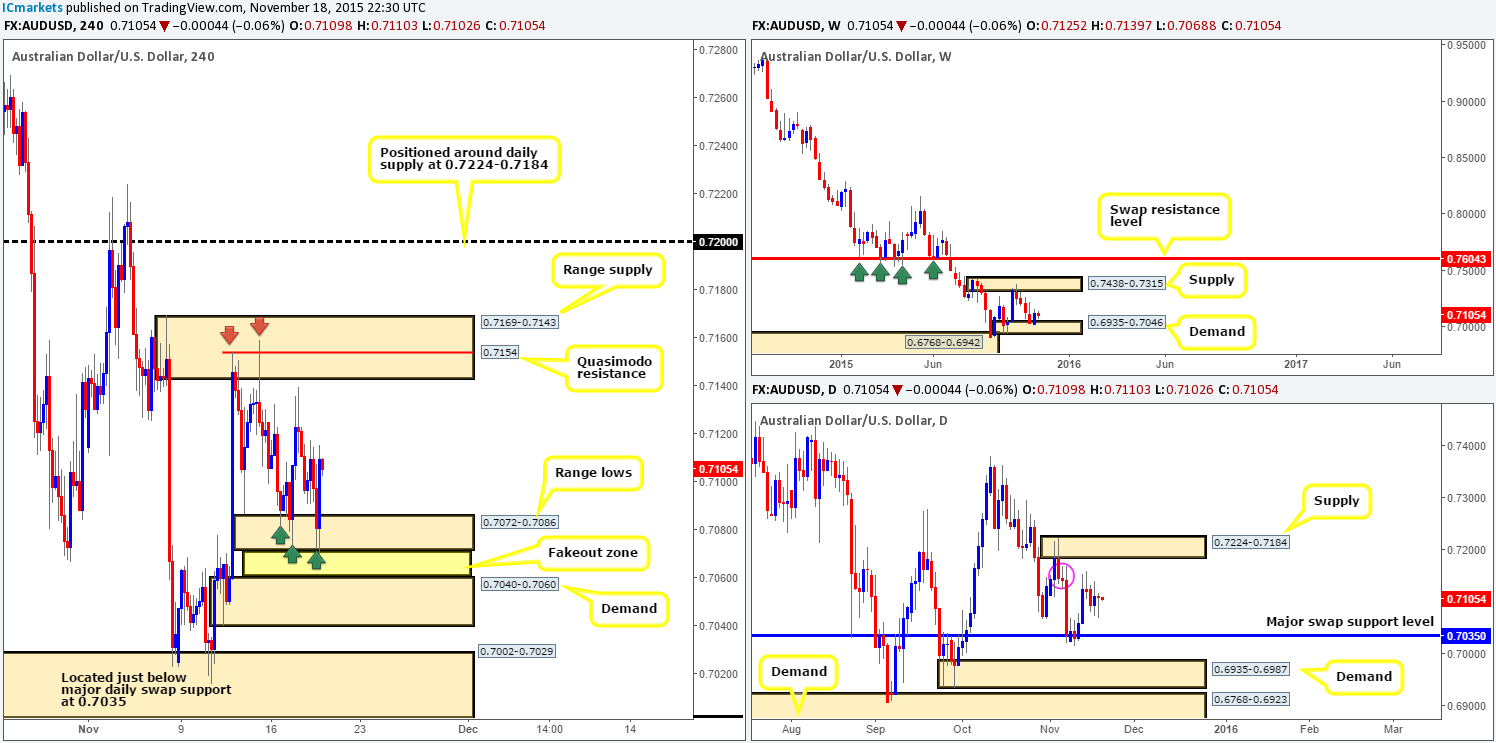
AUD/USD:
Coming at you directly from the top this morning, we can see that weekly trade remains hovering above demand coming in at 0.6935-0.7046. At the same time, however, daily action remains suppressed by a minor daily supply area circled in pink at 0.7168-0.7141.
Turning our attention to the H4 chart, price came alive mid-way through London trading and drove prices lower, momentarily surpassing the H4 range lows at 0.7072-0.7086, before aggressively rallying to highs of 0.7115 on the day.
Considering that this pair, at least on the H4, is considered range bound between the aforementioned range lows and range supply seen at 0.7169-0.7143, where do we see this market headed today? Well, considering the situation on the daily chart (see above), we would still, given the right lower timeframe setup, take a short from the Quasimodo resistance level seen within the current range supply at 0.7154.
With regards to buy trades, despite the fact that price responded beautifully to the H4 range lows, we would not feel comfortable buying at this region. Reason being is simply because there is a clean demand lurking just below it at 0.7040-0.7060, that sits five pips above a major daily swap (support) level at 0.7035 (downside target from the minor daily supply mentioned above). With that being said, we believe the range lows will eventually be faked, so do make a note of this demand below in your watch lists as a potential reversal zone.
Levels to watch/ live orders:
- Buys: Keep an eye out for a fake below range lows 0.7072-0.7086 into demand at 0.7040-0.7060.
- Sells: 0.7154 region [Tentative – confirmation required] (Stop loss: dependent on where one confirms this level).
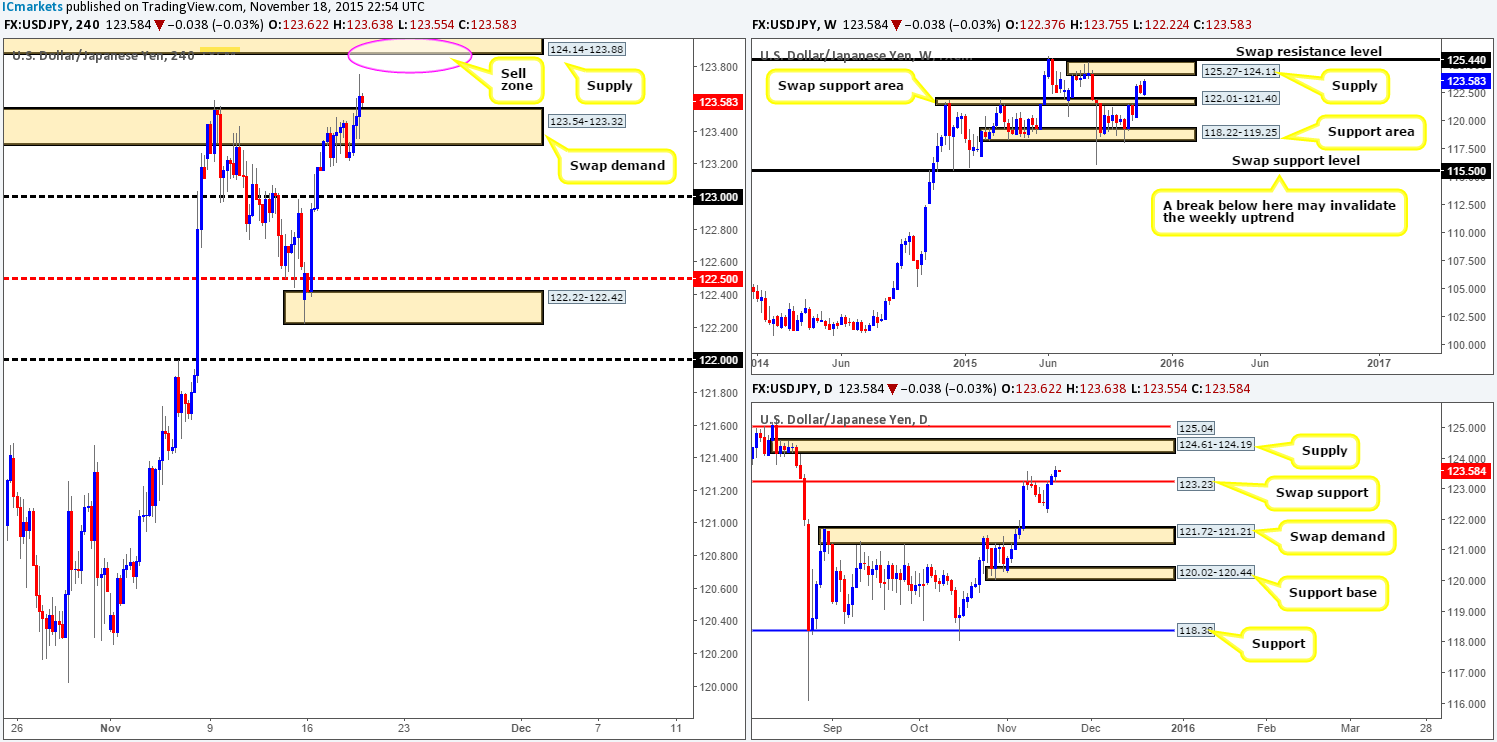
USD/JPY:
The USD/JPY shows that as London opened its business doors, bids begun to flow into this market. This, as you can see, continued into U.S. trade and consequently saw price close above supply at 123.54-123.32. With price now also seen retesting this supply as demand, we feel this pair will likely continue its upwardly path to connect with supply seen at 124.14-123.88.
Just to be clear here traders, our team has absolutely no interest in buying from the current swap demand base today. Instead, what we have our eye on is the supply area just mentioned above at 124.14-123.88. Our reasoning for why is as follows:
- Located just below the daily supply at 124.61-124.19.
- Also glued to the underside of a weekly supply at 125.27-124.11.
- Converges nicely with psychological resistance 124.00.
Due to the above technical convergence, we feel this area, dependent on where we are on the news docket of course, is stable enough to condone a market entry.
Levels to watch/ live orders:
- Buys:Flat (Stop loss: N/A).
- Sells: 124.14-123.88 (this area looks to be stable enough for a market short – no confirmation required).
USD/CAD:
Despite yesterday’s flurry of buying and selling during the London and American sessions, price remains fixed between the daily Quasimodo resistance level at 1.3352 and psychological support 1.3300. Therefore, much of the following analysis will be similar to the previous…
Surrounding the top-side of this range is a combined weekly supply/ swap resistance area seen at 1.3456-1.3277/1.3381, and directly beneath it sits is a daily swap (support) barrier at 1.3266. In our previous report, we mentioned that due to the clear weekly supply being seen on this pair, the best area to be looking to short (with confirmation) would be the above said daily Quasimodo level. Well done to any of our readers who managed to lock in some green pips from this move.
Given that price is trading around yesterday’s prices, we still believe the only logical trading point on this pair is the aforementioned daily Quasimodo resistance. Attempting to long from 1.3300 is too risky for us due to the higher timeframe resistances in play, and selling should price break below 1.3300 is out of the question owing to the daily swap support level lurking just below at 1.3266.
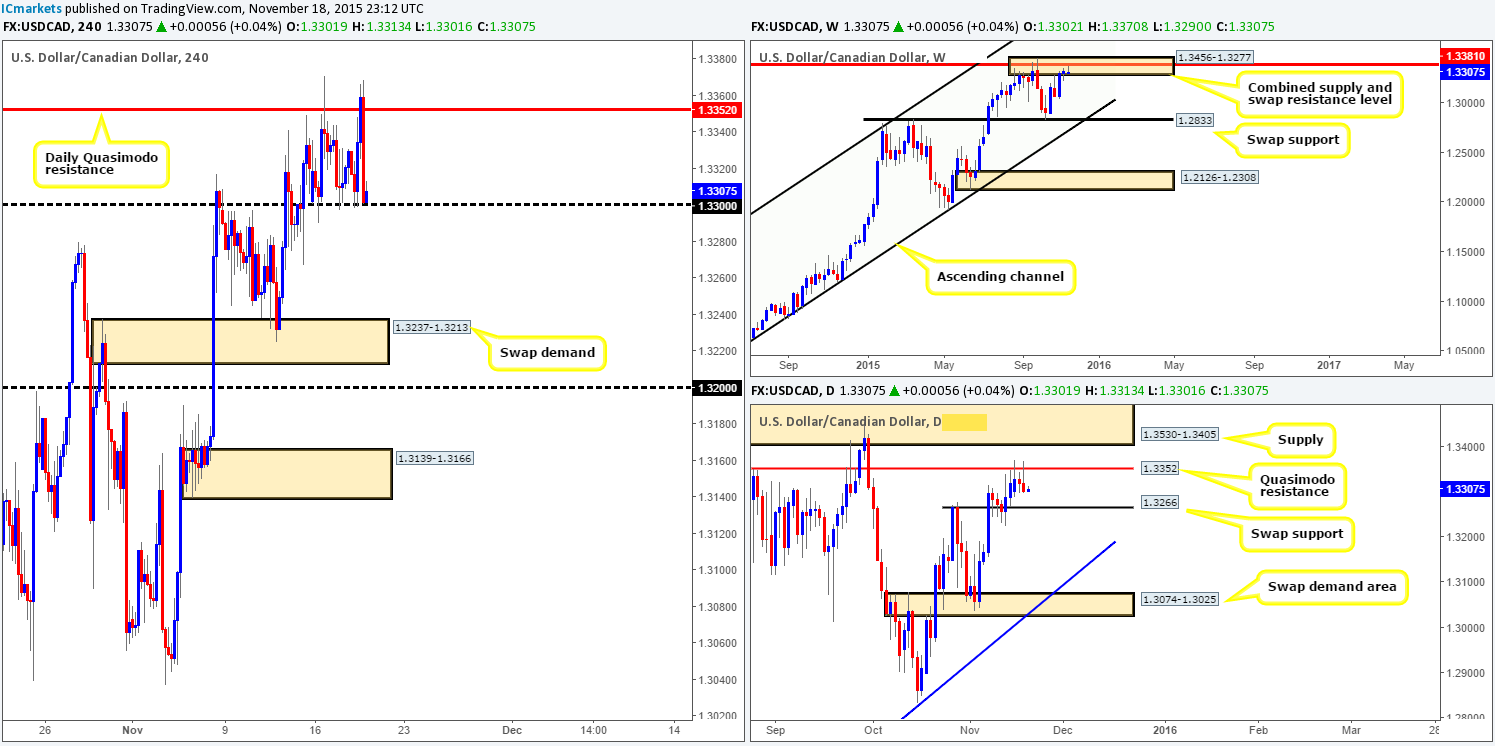
Levels to watch/ live orders:
- Buys:Flat (stop loss: N/A).
- Sells: 1.3352 [Tentative – confirmation required] (Stop loss: dependent on where one confirms this level).
USD/CHF:
For those who read our previous report (http://www.icmarkets.com/blog/wednesday-18th-november-heavy-volatility-possible-on-usd-related-pairs-at-1-30pm-and-also-at-7-00pm-gmt-remain-vigilant/) we mentioned that we were looking to short the near-term supply at 1.0219-1.0185. The main reasons for why were simply because price is currently trading within weekly supply at 1.0239-1.0131, and also, at that time, price was also kissing the underside of daily supply drawn from 1.0239-1.0185.
Our sell order was filled at 1.01882 at 3.30pm GMT, and as you can see came so very close to being stopped out since our stop is set at 1.0222! Ultimately, our team is eyeing the demand area seen below at 1.0127-1.0155 as an immediate take-profit target, followed closely by psychological support 1.0100 and then the swap support at 1.0083/demand at 1.0043-1.0067.
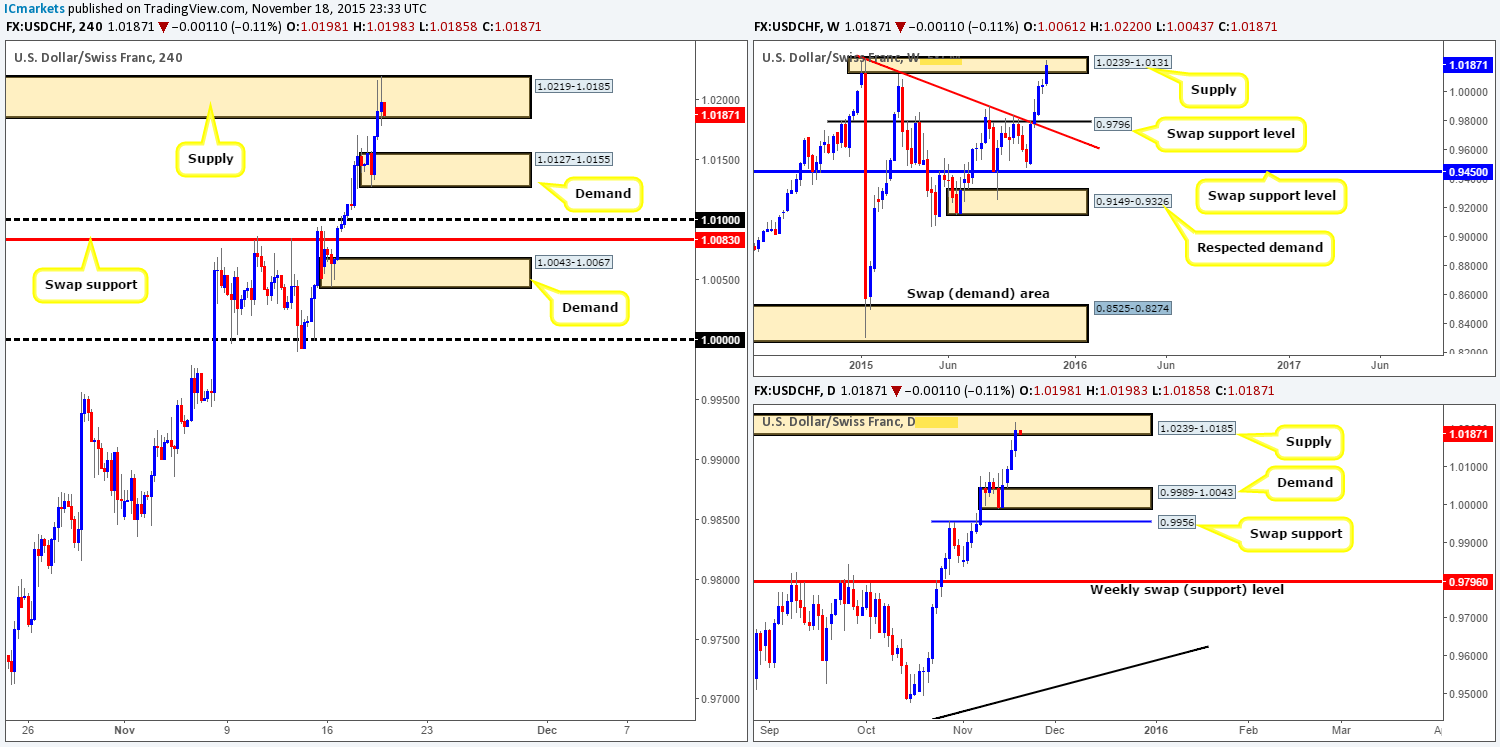
Levels to watch/ live orders:
- Buys:Flat (Stop loss: N/A).
- Sells:1.01882 [LIVE] (Stop loss: 1.0222).
DOW 30:
Kicking off this morning’s analysis with a look at the weekly chart shows that the bulls continue to press forward following the rebound from swap support at 17135. Should this upside momentum continue, it is likely we’ll see price touch gloves with 17900 very soon.
On the other side of the coin, however, this recent buying forced daily action to close above a swap resistance (now support) level at 17609, and jab into a supply coming in at 17843-17698.
Turning our attention to the H4 chart, we can see just how volatile the buy-side of the market was during yesterday’s sessions. This, as you can see, blasted through both the swap supply (now demand) zone at 17574-17520 and the broken Quasimodo level at 17664, before driving into supply drawn from 17761-17715 by the day’s end.
We would love to say that since price is lurking within daily supply right now that we’re looking for shorts within the current H4 supply, but we’re not! We’re hesitant due to weekly action showing room to move higher to 17900, and also the fact that price is in the process of completing the D-leg of a H4 AB=CDbearish pattern, which terminates deep within the H4 resistance area at 17930-17900 (coincides nicely with the aforementioned weekly level).
Therefore, unless we see some very attractive lower timeframe selling action at the current H4 supply or the one above it at 17843-17807 (located deep within daily supply mentioned above at 17843-17698), we’ll take a back seat on this one and watch to see if price reaches the AB=CD completion point before looking to trade.
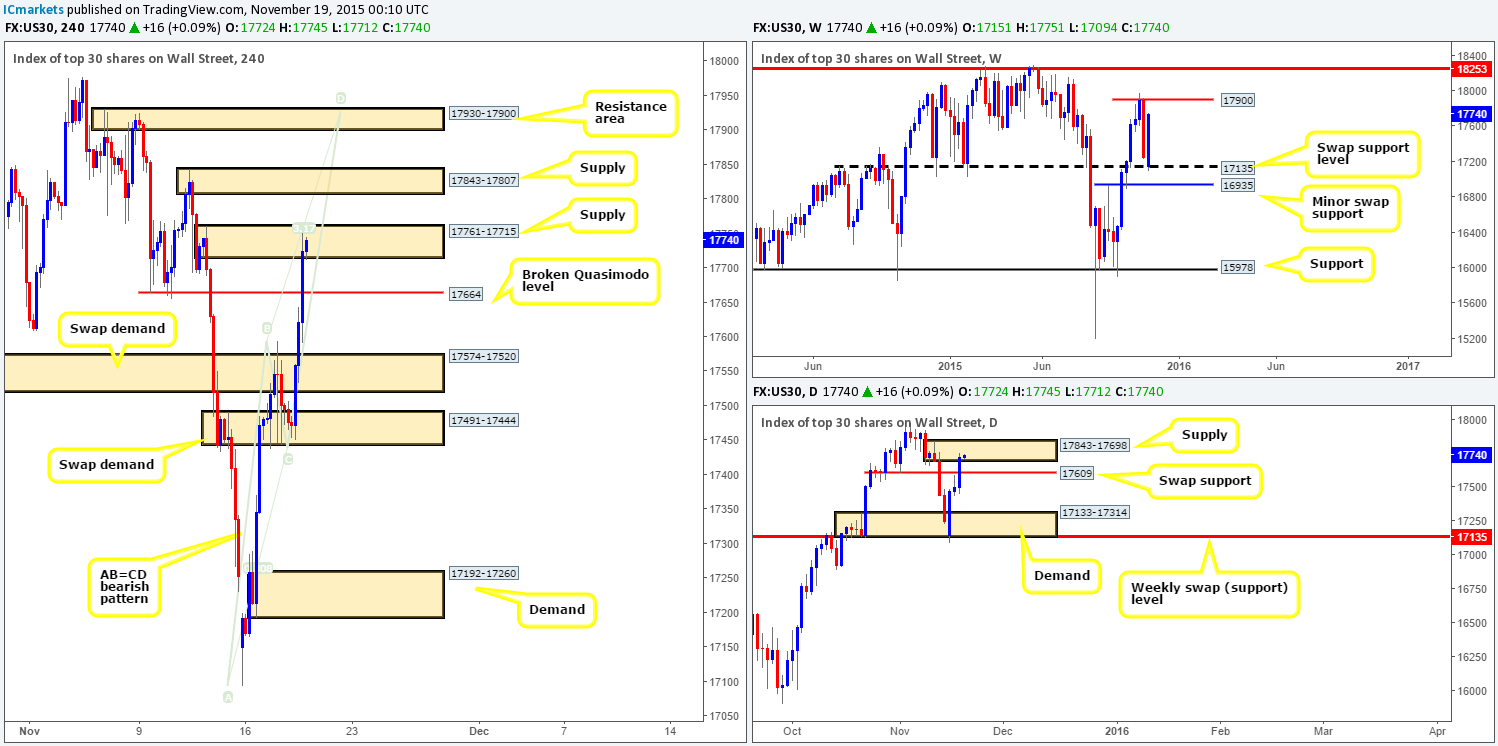
Levels to watch/ live orders:
- Buys:Flat (Stop loss: N/A).
- Sells:17761-17715 [Tentative – confirmation required] (Stop loss: dependent on where one confirms this area) 17843-17807 [Tentative – confirmation required] (Stop loss: dependent on where one confirms this area) 17930-17900 [Tentative – confirmation required] (Stop loss: dependent on where one confirms this area).
XAU/USD: (Gold)
Starting from the weekly timeframe this morning, we can clearly see that even though the bears drove through the Quasimodo support level at 1074.6, the bulls are not ready to throw in the towel just yet! Moving down a level to the daily timeframe, bid strength is being seen from just above the swap support barrier coming in at 1063.4, which pushed prices north up to the underside of the recently broken weekly Quasimodo support.
Moving down one more level brings us into the pits of the H4 timeframe. In our previous report (http://www.icmarkets.com/blog/wednesday-18th-november-heavy-volatility-possible-on-usd-related-pairs-at-1-30pm-and-also-at-7-00pm-gmt-remain-vigilant/), we mentioned that we were interested in buying from the above said daily swap (support) barrier. Such a shame it missed this level as it would have been a relatively profitable trade that hit target – the underside of the weekly Quasimodo support level, 1074.6.
With the above in mind, where do we see this market heading today? Well, in the event that 1074.6 holds as resistance, there could be a potential short (with confirmation) opportunity to be had here. Conversely, supposing this level fails to hold as resistance, the supply area directly above it at 1083.2-1078.4 will be the next zone to watch. Shorting at this areais possible in our opinion, but one would need to be cautious here… If price closes above 1074.6, and retests it as support, it is likely that this supply will fail and Gold will rally higher, which, will be our cue to begin looking for confirmed longs into this market.
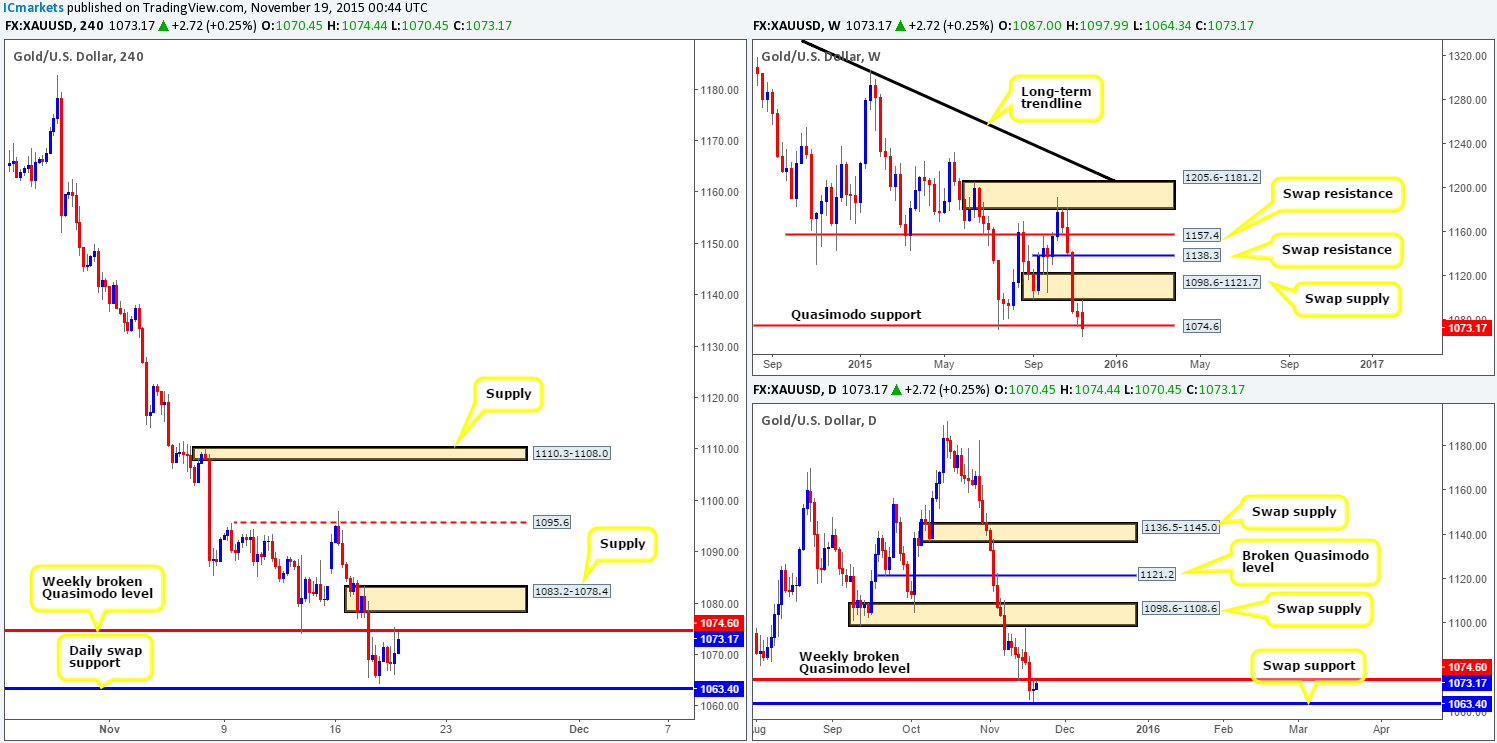
Levels to watch/live orders:
- Buys:Watch for offers to be consumed around 1074.6 and then look to trade any retest seen at this level (confirmation required).
- Sells: 1074.6 [Tentative – confirmation required] (Stop loss: dependent on where one confirms this level) 1083.2-1078.4 [Tentative – confirmation required] (Stop loss: dependent on where one confirms this area).


