Waiting for lower timeframe confirmation is our main tool to confirm strength within higher timeframe zones, and has really been the key to our trading success. It takes a little time to understand the subtle nuances, however, as each trade is never the same, but once you master the rhythm so to speak, you will be saved from countless unnecessary losing trades. The following is a list of what we look for:
- A break/retest of supply or demand dependent on which way you’re trading.
- A trendline break/retest.
- Buying/selling tails/wicks – essentially we look for a cluster of very obvious spikes off of lower timeframe support and resistance levels within the higher timeframe zone.
We typically search for lower-timeframe confirmation between the M15 and H1 timeframes, since most of our higher-timeframe areas begin with the H4. Stops are usually placed 1-3 pips beyond confirming structures.
EUR/USD:
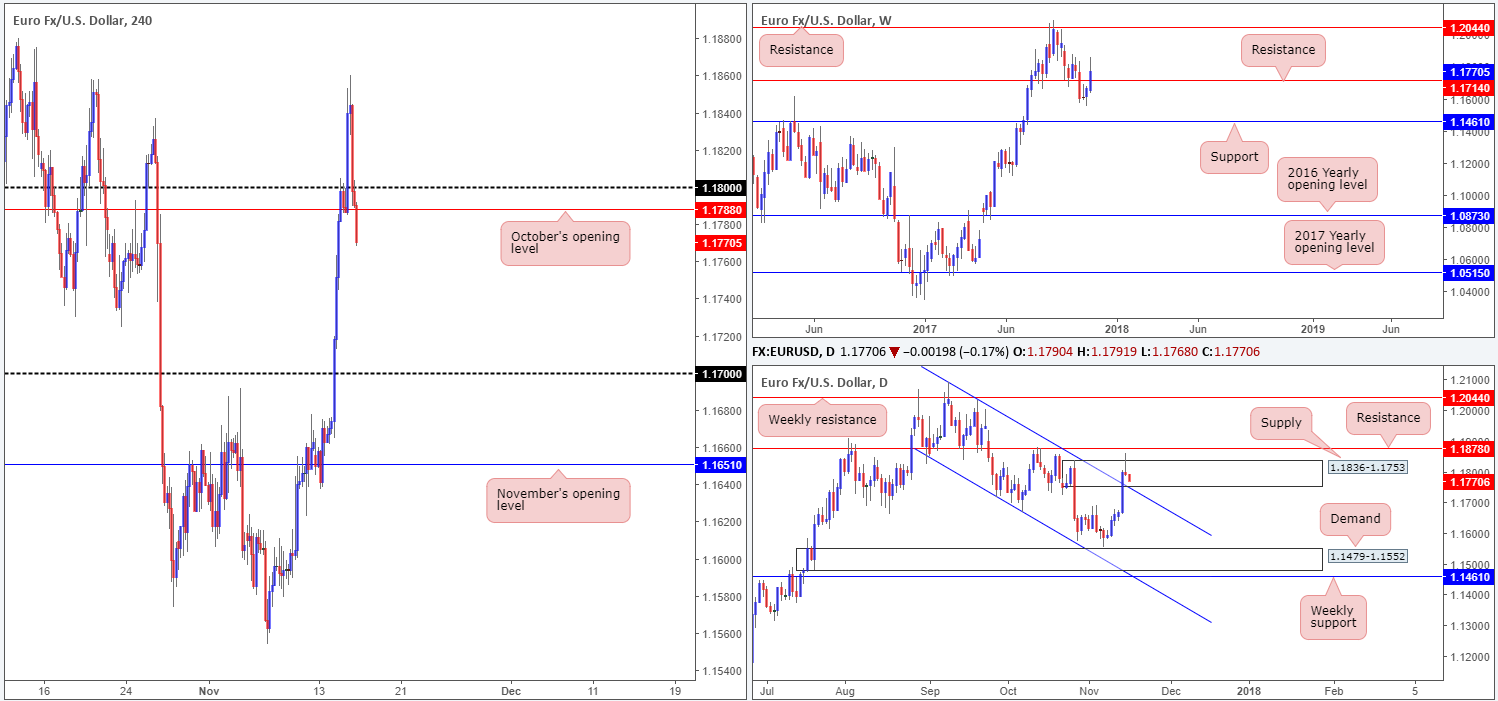
In recent sessions, the single currency elbowed its way above the 1.18 mark and aggressively rallied to a session high of 1.1860. Following mixed US data; price switched tracks and just as aggressively reclaimed recent gains, consequently forcing the H4 candles sub 1.18 into the closing bell. Over the last couple of hours the unit, as you can see, crossed below October’s opening level at 1.1788 and now shows room to decline down as far as the 1.17 band.
What’s also interesting about this move is that it formed a nice-looking selling wick over on the daily timeframe that pierced though the top edge of a supply zone at 1.1836-1.1753. While this could be interpreted as a sell signal, one might want to exercise caution here. Besides weekly price still seen lurking above weekly resistance at 1.1714, daily structure also shows that there’s a trendline support positioned nearby (taken from the high 1.2092).
Suggestions: As far as we can see, technical elements are mixed at the moment. A short beneath 1.1788 on the H4 timeframe looks fantastic on this scale, but somewhat chancy on the weekly and daily timeframes. Concerning a buy, a long in this market is also out of the question for us right now, given little support structure seen on the H4 timeframe.
Data points to consider: EUR final CPI y/y at 10am; US unemployment claims, Import prices m/m and Philly Fed manufacturing index at 1.30pm; Industrial production m/m and capacity utilization rate at 2.15pm; FOMC member Kaplan speaks (timing tentative); FOMC member Brainard speaks at 8.45pm GMT.
Levels to watch/live orders:
- Buys: Flat (stop loss: N/A).
- Sells: Flat (stop loss: N/A).
GBP/USD:
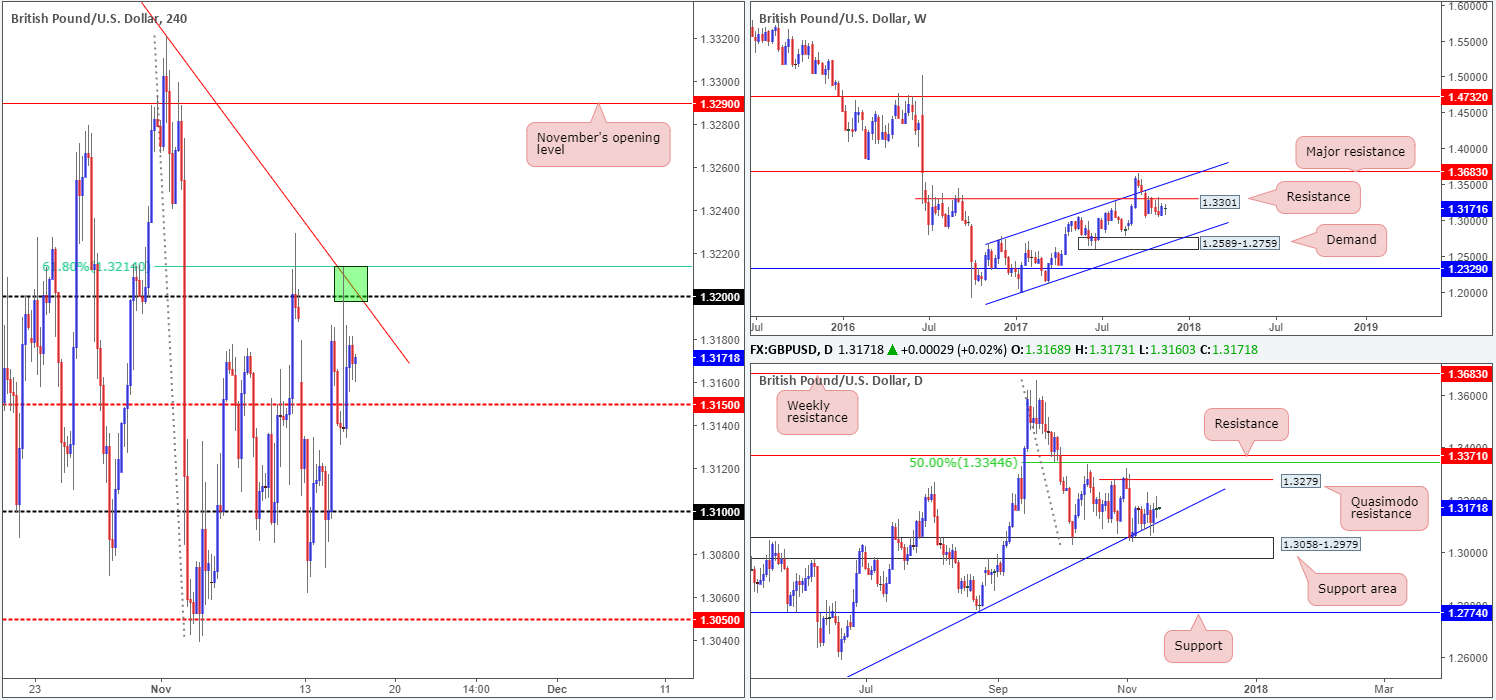
Despite Wednesday’s upbeat UK employment figures, the pair quickly lost traction above the 1.32 handle. In fact, for those who read yesterday’s report you may recall that between the 61.8% H4 Fib resistance at 1.3214 and 1.32, this was a highlighted sell zone. We passed on selling this area for the obvious reason that UK news could have easily wiped out orders from here!
Over on the weekly timeframe, we can see that the British pound has been consolidating beneath a resistance level at 1.3301 since early October. Capping downside in this market, however, is a daily trendline support extended from the low 1.2108 and a daily support area coming in at 1.3058-1.2979. One other thing to keep in mind here is the fact that the market, at least from current price on the daily scale, displays room to rally as far north as 1.3279: a daily Quasimodo resistance line.
Suggestions: With sellers likely weakened around the 1.32 neighborhood now, and weekly and daily structure struggling to find common ground, we will likely remain flat going into today’s segment.
Data points to consider: UK retail sales m/m at 9.30am; BoE Gov. Carney speaks sometime today; US unemployment claims, Import prices m/m and Philly Fed manufacturing index at 1.30pm; Industrial production m/m and capacity utilization rate at 2.15pm; FOMC member Kaplan speaks (timing tentative); FOMC member Brainard speaks at 8.45pm GMT.
Levels to watch/live orders:
- Buys: Flat (stop loss: N/A).
- Sells: Flat (stop loss: N/A).
AUD/USD:
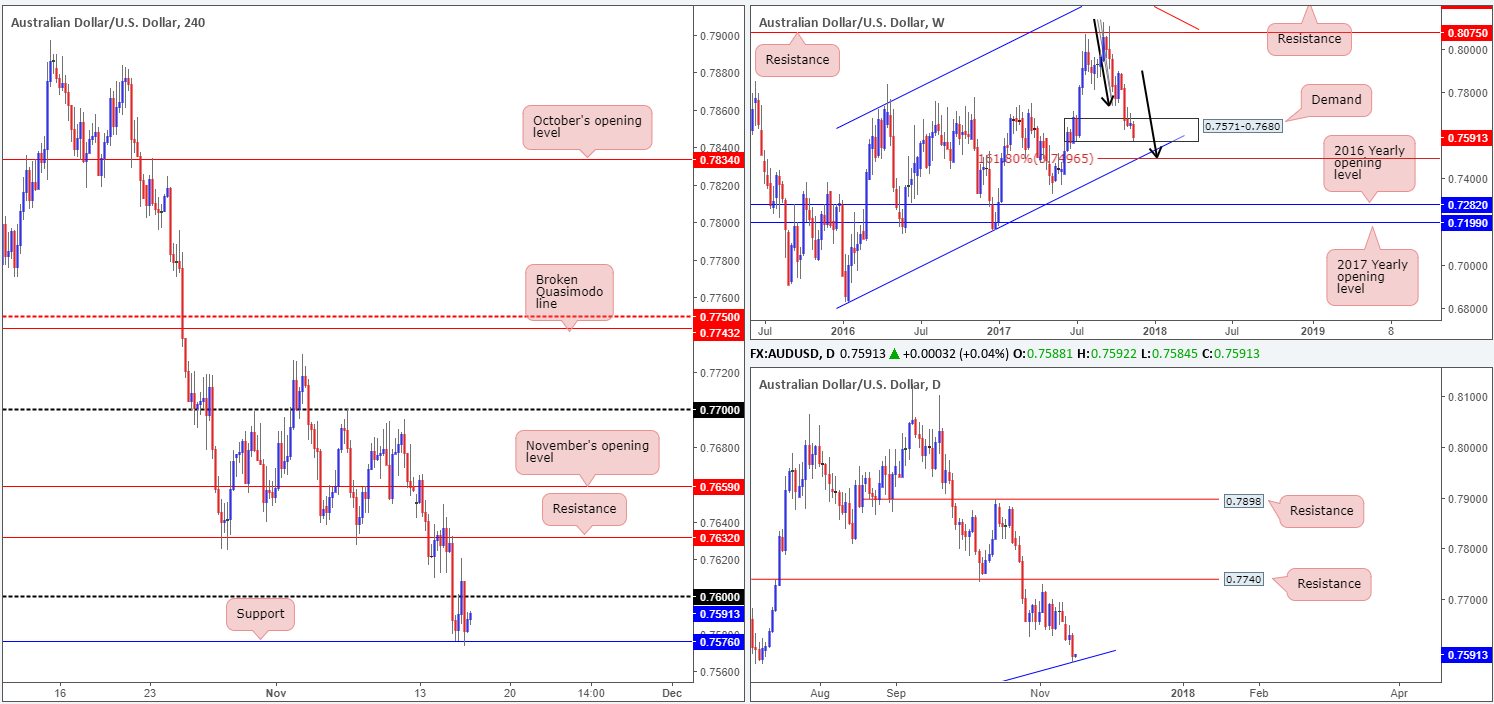
The AUD/USD market is among the worst performers on Wednesday. In early Asian hours, disappointing Australian wage growth sent the unit screaming below the 0.76 mark. The H4 candles, as you can see though, stabilized around the 0.7576 region (a support level) and pared losses, consequently breaking back above 0.76 during the early hours of US trading. Despite an earnest attempt from the bulls here, the market ended the day sub 0.76.
Yesterday’s downside move not only removed bids from 0.76, it also brought weekly price down into the lower limits of a weekly demand base coming in at 0.7571-0.7680. In the event that this area gives way, the next downside target can be seen at 0.7496: a weekly AB=CD 161.8% Fib ext. that aligns beautifully with a weekly channel support etched from the low 0.6827. Down on the daily timeframe, however, there is a trendline support drawn from the low 0.7159 currently in play.
Suggestions: Although the current weekly demand looks incredibly vulnerable at the moment, it’d be unwise to ignore it. This is especially true considering that there’s a daily trendline support currently in motion as well as a H4 support mentioned above at 0.7576. However, to buy this market is tricky with 0.76 positioned so close. In addition to this, we have Aussie employment data in less than an hour, which will likely rip through most technical setups. Therefore, the plan is to remain on the bench, at least until after the news.
Data points to consider: AUD job’s data at 12.30am; US unemployment claims, Import prices m/m and Philly Fed manufacturing index at 1.30pm; Industrial production m/m and capacity utilization rate at 2.15pm; FOMC member Kaplan speaks (timing tentative); FOMC member Brainard speaks at 8.45pm GMT.
Levels to watch/live orders:
- Buys: Flat (stop loss: N/A).
- Sells: Flat (stop loss: N/A).
USD/JPY:
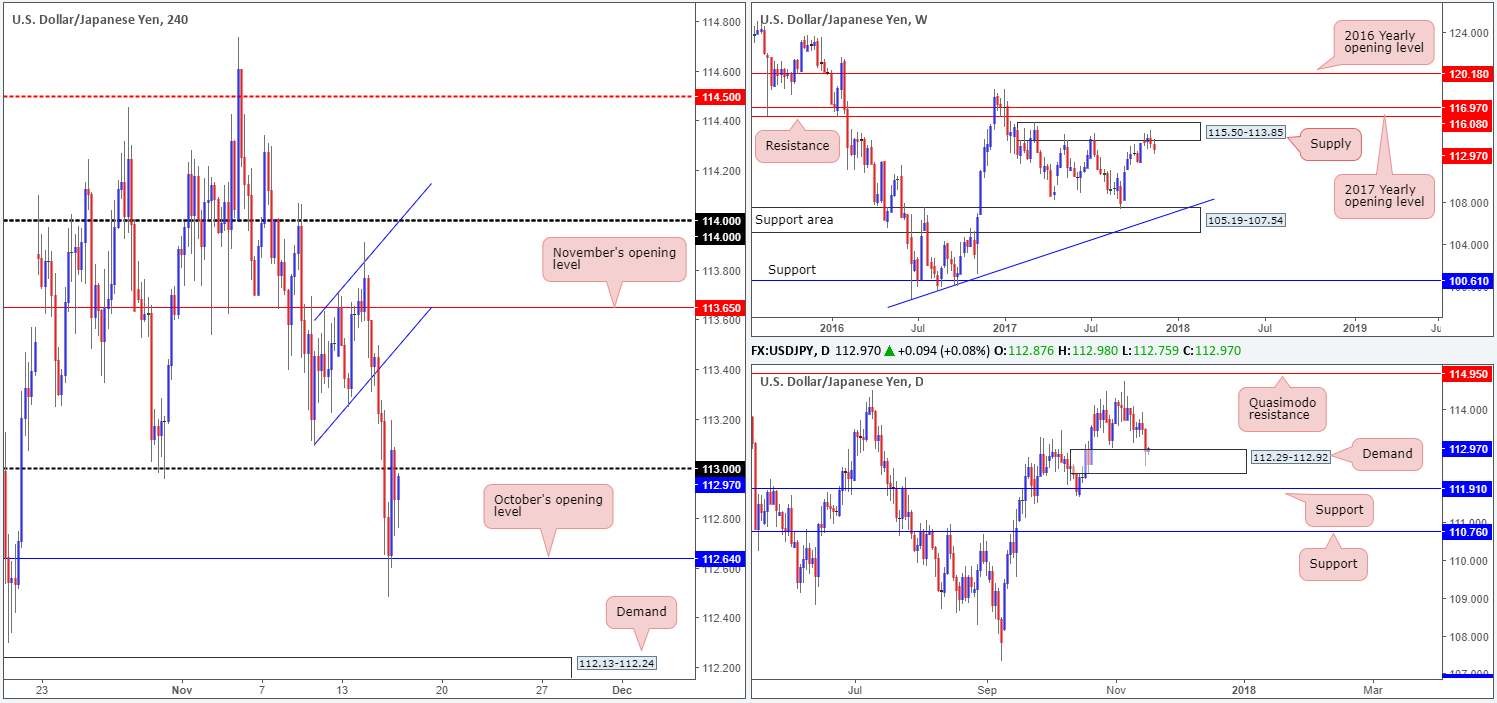
Kicking this morning’s report off with a look at the weekly timeframe, we can see that the bears remain in the driving seat after selling off from supply fixed at 115.50-113.85. Despite this, there may be trouble ahead! Down on the daily timeframe, demand at 112.29-112.92 was recently brought into play.
Weak market sentiment favored the Japanese yen yesterday, consequently dragging the USD/JPY below the 113 handle. The pair staged a modest recovery going into the early hours of US trade from October’s opening level at 112.64, but met strong selling pressure around the underside of 113.
Suggestions: We would not look to trade between 113 and 112.64. The range is just too small for our liking. A H4 close above 113, nevertheless, may be enough to spark further buying up to November’s opening level at 113.65, considering that daily price is trading from demand. In spite of this, buying this market would also entail going up against weekly selling!
As for selling this market, a break below 112.64 likely opens up the path south down to H4 demand at 112.13-112.24. A short beneath 112.64 would, however, have you selling within daily demand, but trading in-line with weekly flow.
Given the points above, we just don’t feel this market is tradable today. No matter which direction one chooses, there’s a higher-timeframe obstacle lurking close by!
Data points to consider: US unemployment claims, Import prices m/m and Philly Fed manufacturing index at 1.30pm; Industrial production m/m and capacity utilization rate at 2.15pm; FOMC member Kaplan speaks (timing tentative); FOMC member Brainard speaks at 8.45pm GMT.
Levels to watch/live orders:
- Buys: Flat (stop loss: N/A).
- Sells: Flat (stop loss: N/A).
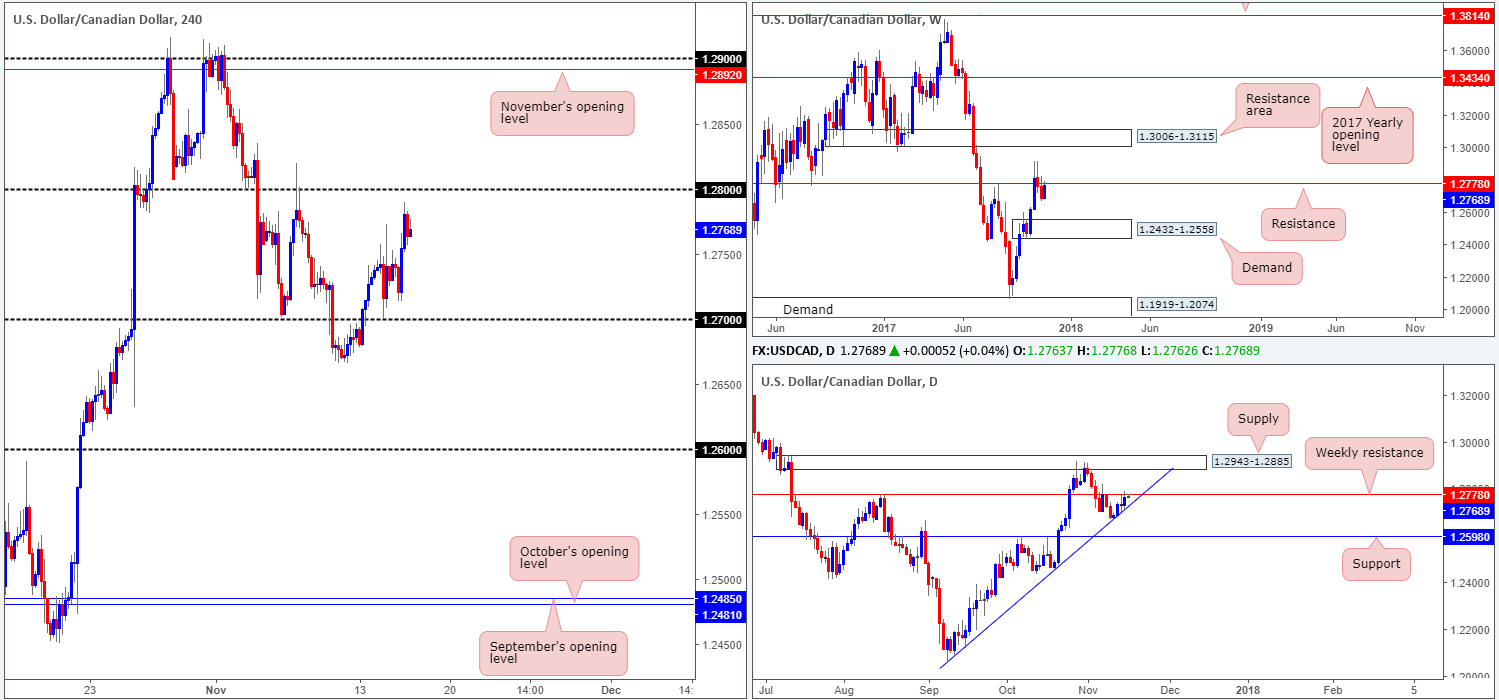
USD/CAD:
During the course of Wednesday’s segment, the USD/CAD popped to a high of 1.2789. Why would H4 price not continue north and shake hands with the 1.28 boundary? Well, over on the weekly timeframe, the 1.2778 band represents a sturdy weekly resistance level! As a matter of fact, the desk highlighted the 1.28 boundary and 1.2778 as a potential sell zone yesterday. Though, we did advise waiting for a full or near-full-bodied bearish H4 candle to form, since psychological levels are prone to fakeouts. The downside to a short from this neighborhood, however, is the nearby daily trendline support etched from the low 1.2061.
Suggestions: If you’re also looking to short this market, the only logical approach that we see right now is to simply wait for the sellers to prove themselves. What we mean by this is wait and see if H4 price can close below the daily trendline support before initiating a short position.
Data points to consider: US unemployment claims, Import prices m/m and Philly Fed manufacturing index at 1.30pm; Industrial production m/m and capacity utilization rate at 2.15pm; FOMC member Kaplan speaks (timing tentative); FOMC member Brainard speaks at 8.45pm; Canadian manufacturing sales m/m at 1.30pm GMT.
Levels to watch/live orders:
- Buys: Flat (stop loss: N/A).
- Sells: Looking to sell from the 1.28 neighborhood, but not before we see a H4 close below the current daily trendline support.
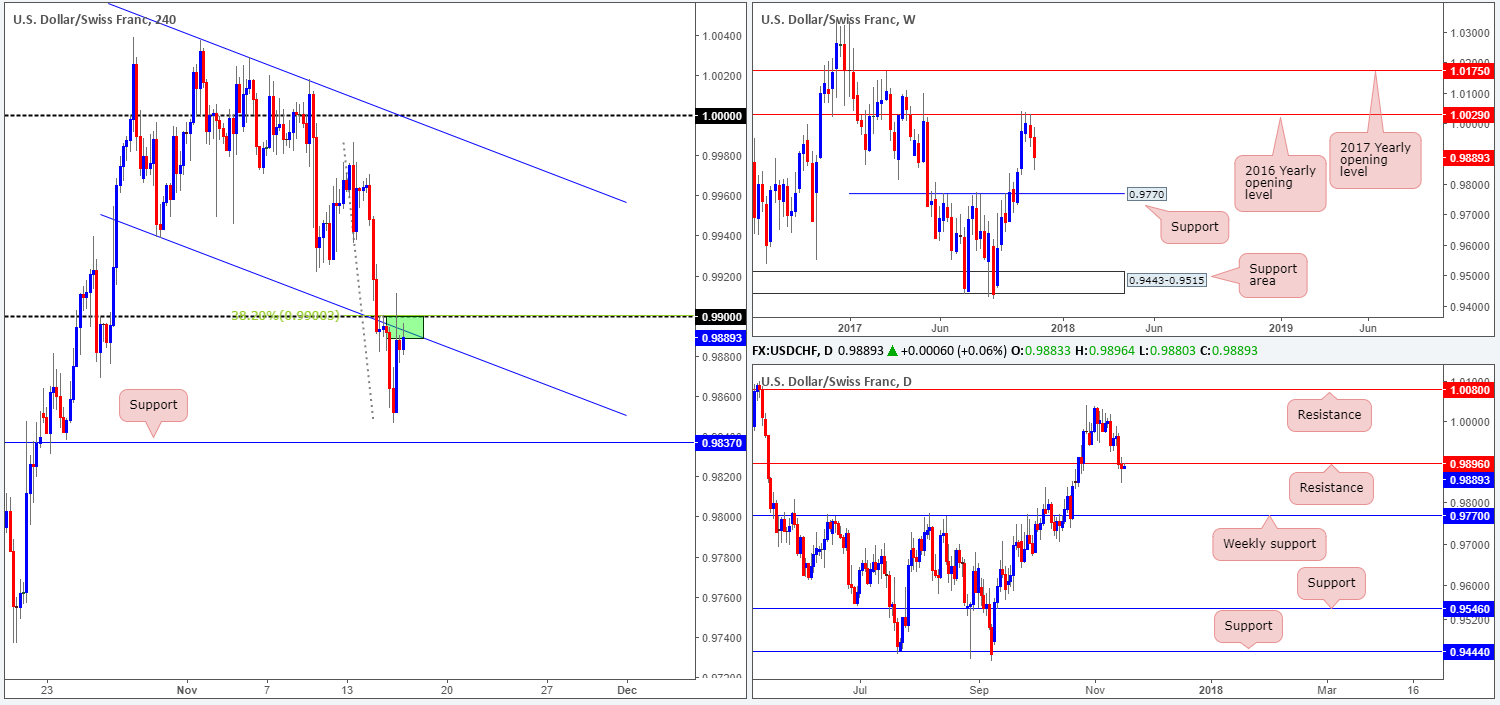
USD/CHF:
After retesting the underside of 0.99 during the early hours of yesterday’s session, the USD/CHF fell to a low of 0.9846. Leaving the H4 support at 0.9837 unchallenged, the pair reclaimed earlier losses and revisited 0.99.
Right now, we believe this is a sellers’ market. Here’s why:
- Weekly price shows room to drive as far south as weekly support coming in at 0.9770.
- Daily price recently crossed below support at 0.9896 (now acting resistance).
- H4 price is, as mentioned above, retesting 0.99. Alongside this, however, we can also see that 0.99 fuses with a H4 channel support-turned resistance taken from the low 0.9939 and a H4 38.2% Fib resistance.
Suggestions: We have entered at 0.9896, with our stop-loss order located at 0.9915, a few pips above yesterday’s high. The first take-profit target, should the trade play out, is the aforementioned H4 support level.
Data points to consider: US unemployment claims, Import prices m/m and Philly Fed manufacturing index at 1.30pm; Industrial production m/m and capacity utilization rate at 2.15pm; FOMC member Kaplan speaks (timing tentative); FOMC member Brainard speaks at 8.45pm; Gov. Board member Maechler speaks at 5pm GMT.
Levels to watch/live orders:
- Buys: Flat (stop loss: N/A).
- Sells: 0.9896 ([live] stop loss: 0.9915).
DOW 30:
Structure slightly altered since our last visit.
The DJIA took another hit to the mid-section on Wednesday. This time cracking below a H4 trendline support taken from the low 23250 and piercing through the lower edge of a H4 support area at 23261-23297. Although the H4 candles are somewhat confined at the moment, daily price shows room to press as far south as the daily trendline support extended from the high 21541. However, this is slightly marred by the fact that just beneath the current H4 support area, there stands a H4 demand base at 23199-23232.
Suggestions: Unfortunately, we still do not see much to hang our hat on today. H4 price is just so restricted lately!
Data points to consider: US unemployment claims, Import prices m/m and Philly Fed manufacturing index at 1.30pm; Industrial production m/m and capacity utilization rate at 2.15pm; FOMC member Kaplan speaks (timing tentative); FOMC member Brainard speaks at 8.45pm GMT.

Levels to watch/live orders:
- Buys: Flat (stop loss: N/A).
- Sells: Flat (stop loss: N/A).
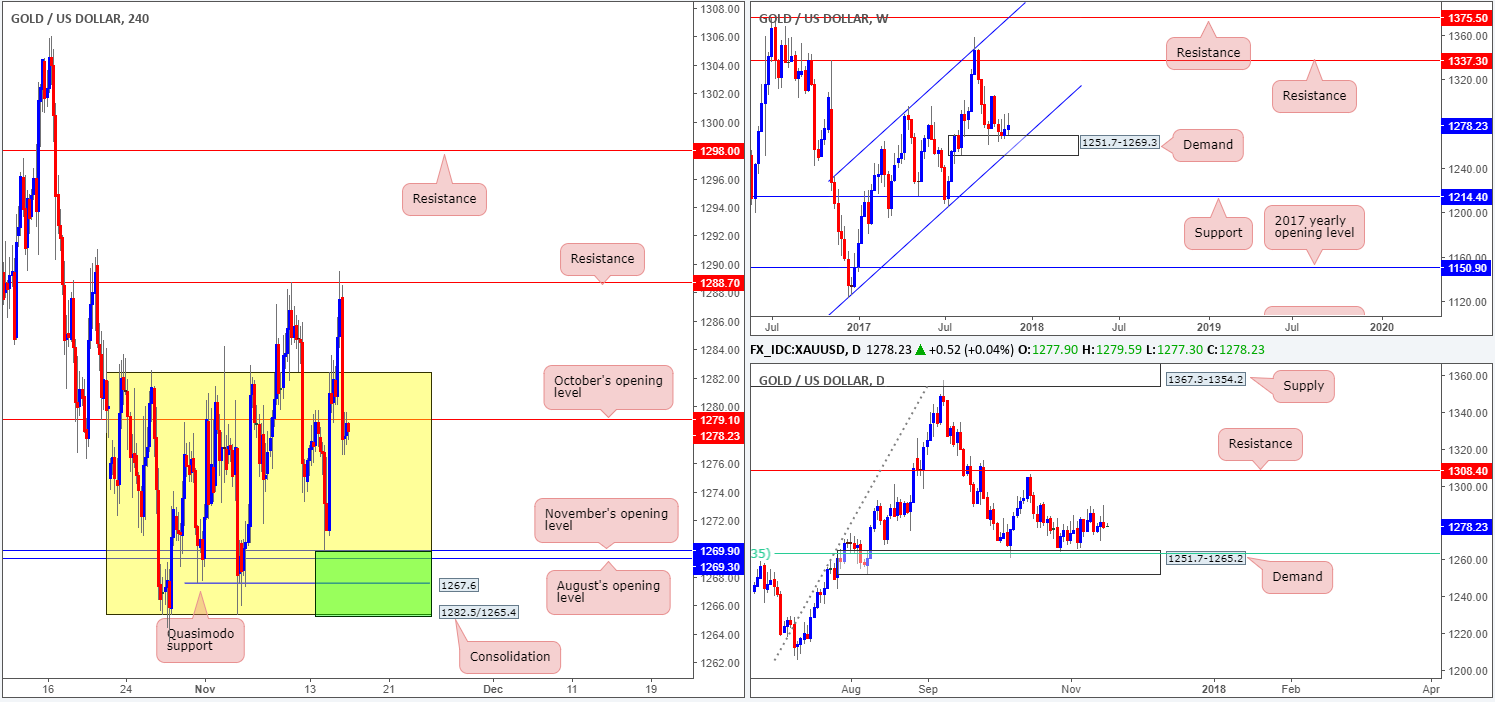
GOLD:
The yellow metal aggressively sold off from H4 resistance at 1288.7 going into the early hours of yesterday’s US segment. As you can see, this forced H4 price back into the H4 range shaded in yellow at 1282.5/1265.4, and also below October’s opening level at 1279.1.
The H4 resistance mentioned above at 1288.7 is proving a troublesome area to breach, considering that weekly price is trading from demand at 1251.7-1269.3. Given the position of the weekly candles, selling beneath October’s opening level is chancy, in our humble view.
Suggestions: In light of the points made above, our attention is once again drawn to the green H4 buy zone comprised of the following components:
- The lower edge of the current H4 range at 1265.4.
- H4 Quasimodo support at 1267.6.
- August and September’s opening levels seen at 1269.3/1269.9.
Let’s also not forget that the green base is supported by the aforementioned weekly demand.
Having seen H4 price already tap this zone, however, buy orders may be weak. Therefore, should you be interested in buying from this base, we would strongly advise waiting for at least a H4 bullish rotation candle to form (a full or near-full-bodied candle) before hitting the buy button. This will help avoid an unnecessary loss, as weekly price could just as easily drive into the current weekly demand and test the weekly channel support extended from the low 1122.8.
Levels to watch/live orders:
- Buys: 1265.4/1269.9 ([waiting for a reasonably sized H4 bullish candle to form – preferably a full or near-full-bodied candle – is advised] stop loss: ideally beyond the candle’s tail).
- Sells: Flat (stop loss: N/A).