
A note on lower timeframe confirming price action…
Waiting for lower timeframe confirmation is our main tool to confirm strength within higher timeframe zones, andhas really been the key to our trading success. It takes a little time to understand the subtle nuances, however, as each trade is never the same, but once you master the rhythm so to speak, you will be saved from countless unnecessary losing trades. The following is a list of what we look for:
- A break/retest of supply or demand dependent on which way you’re trading.
- A trendline break/retest.
- Buying/selling tails – essentially we look for a cluster of very obvious spikes off of lower timeframe support and resistance levels within the higher timeframe zone.
- Candlestick patterns. We tend to only stick with pin bars and engulfing bars as these have proven to be the most effective.
For us, lower timeframe confirmation starts on the M15 and finishes up on the H1, since most of our higher timeframe areas begin with the H4.
EUR/USD:
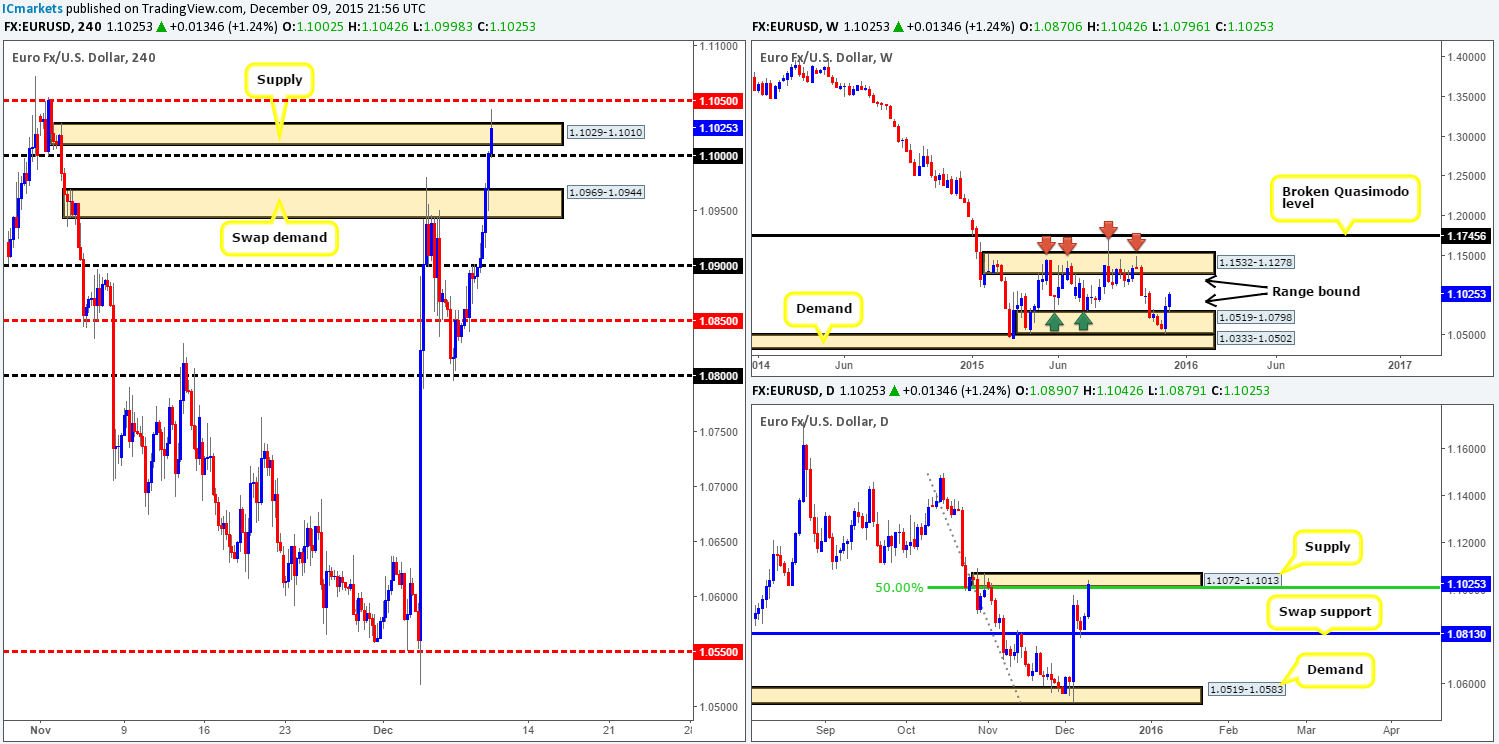
In our previous report (http://www.icmarkets.com/blog/wednesday-9th-december-daily-technical-outlook-and-review/), we mentioned that our team was looking for H4 action to close above 1.0900 and retest this level as support for a potential confirmed long into this market. As can be seen from the H4 chart, a close higher was seen, but unfortunately there was no retest before the single currency rallied 140 pips! This move took out multiple H4 resistances, ending with price piercing through H4 supply seen at 1.1029-1.1010.
Consequent to the recent surge in value, weekly movement is now trading mid-range between demand at 1.0519-1.0798 and supply drawn from 1.1532-1.1278, with price on the daily timeframe seen crossing paths with supply at 1.1072-1.1013.
With everything considered, we feel this pair will likely correct itself today. By how much and for how long is difficult to say, since directly below the current H4 supply sits the large psychological support 1.1000, followed closely by a swap demand coming in at 1.0969-1.0944. Due to this clear near-term bullish structure and the fact that the weekly is trading in the middle (see above) right now, we’ve opted to remain flat going into today’s trade.
Levels to watch/live orders:
- Buys: Flat (Stop loss: N/A).
- Sells: Flat (Stop loss: N/A).
GBP/USD:
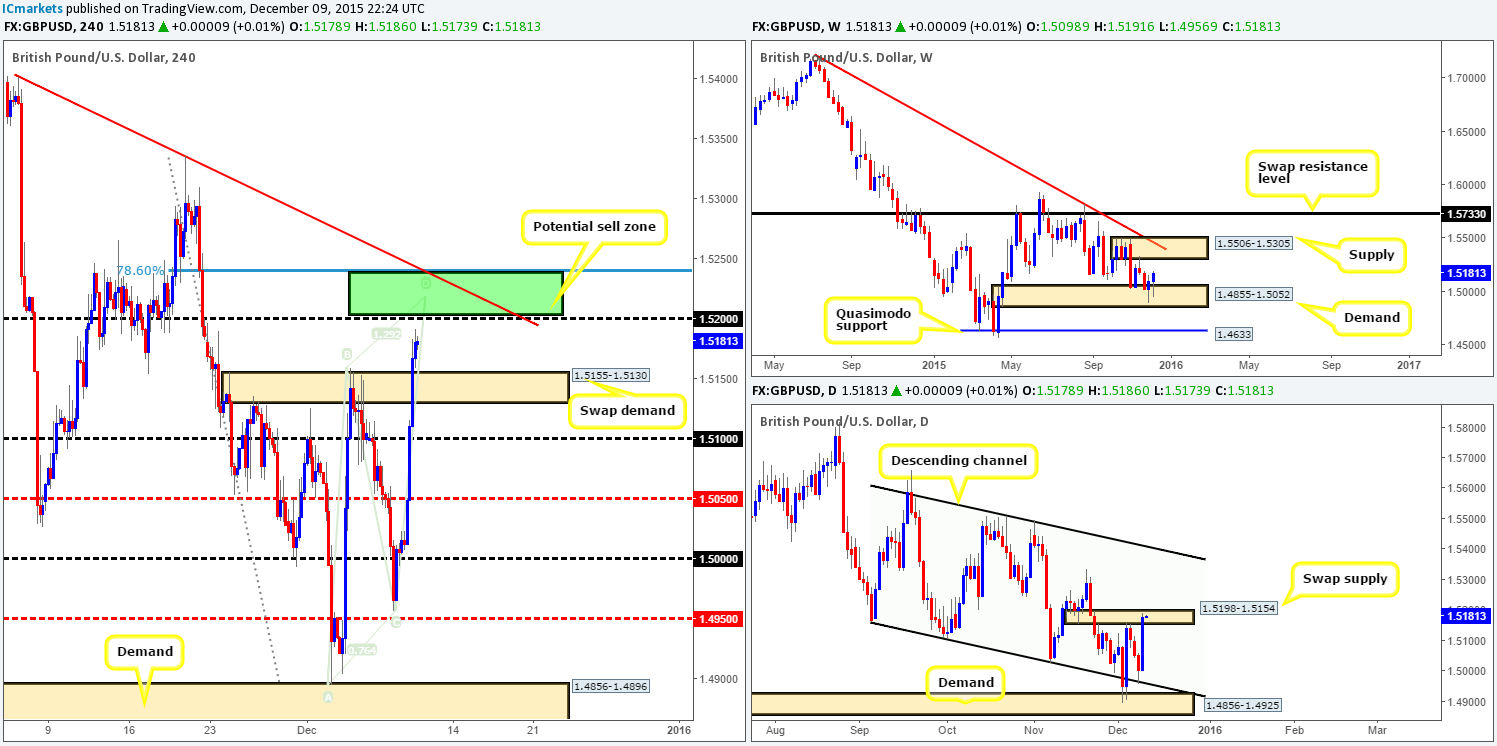
Like the EUR/USD, Cable also posted heavy gains (175 pips) against the weaker U.S. dollar yesterday, resulting in several H4 technical resistances being consumed and price ending the day consolidating below psychological resistance 1.5200. Considering only the H4 timeframe for a moment, 1.5200 is very interesting since it forms part of a very confluent sell zone comprising of the following structures:
- Symmetrical AB=CD bear pattern completing around the 1.5218 region.
- Trendline resistance taken from the swing high 1.5401.
- Deep 78.6% Fibonacci resistance seen at 1.5239.
However, as tempting as this may look, this sell zone sits above a daily swap (supply) at 1.5198-1.5154, meaning that a fake of this area would be required for this zone to be hit. Meanwhile, up on the weekly timeframe, we can see that price is being bid from demand at 1.4855-1.5052, effectively placing this pair now mid-range between this said demand and the supply overhead drawn from 1.5506-1.5305.
Although the higher timeframe picture does not perfectly support a downside move from our highlighted sell zone, we still remain confident a bounce lower will be seen from here. The reason being is that the stops taken from a break above the aforementioned daily swap (supply) zone will likely provide well-funded traders enough liquidity to short. As such, a pending sell order has been placed at 1.5198 with a stop set above at 1.5244. Initial targets for this trade fall in around the swap demand at 1.5155-1.5130, followed by psychological support 1.5100.
Levels to watch/ live orders:
- Buys: Flat (Stop loss: N/A).
- Sells: 1.5198 (Stop loss: 1.5244).
AUD/USD:
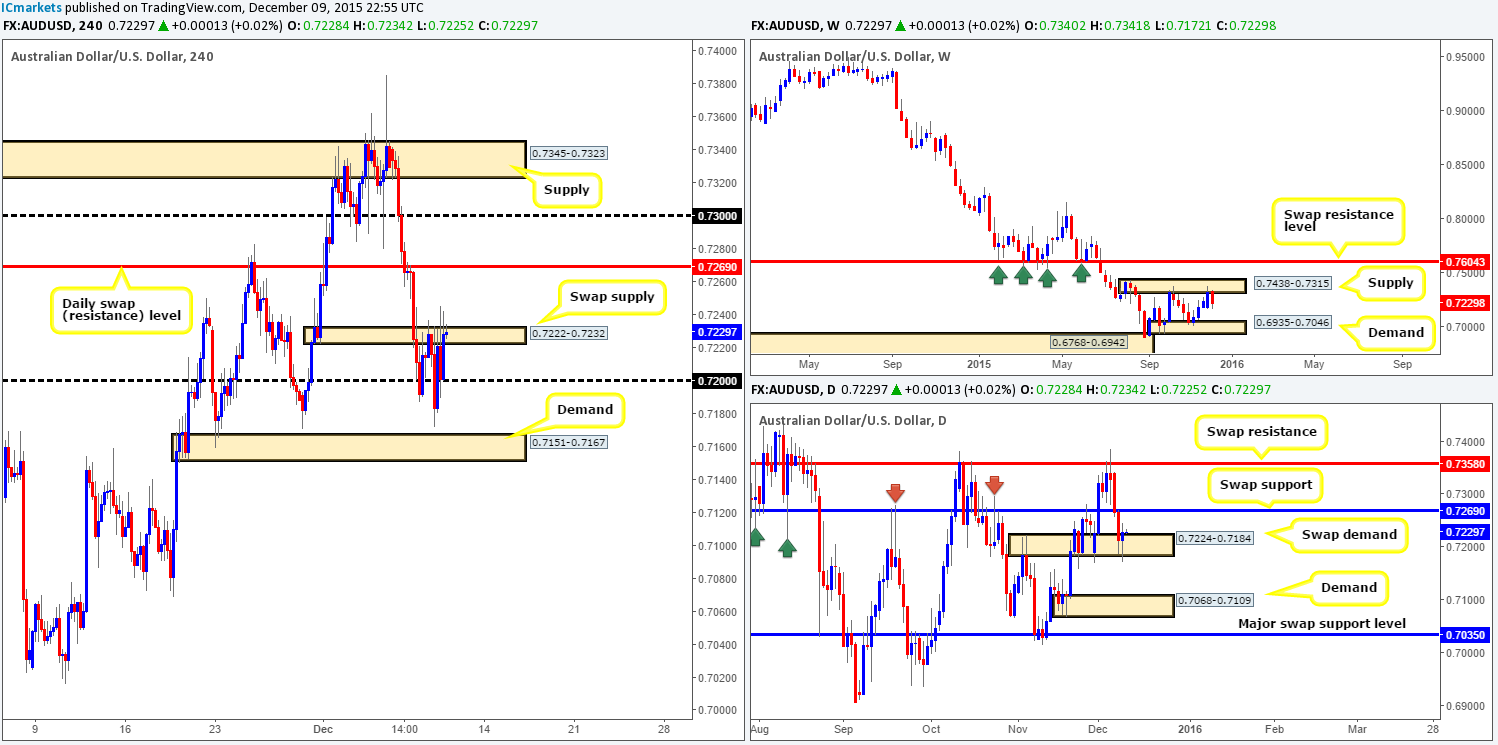
The AUD/USD shows that yesterday’s early morning trade in Londonsaw price drop lower to test the 29th November lows at 0.7170, which held and consequently formed a tight double bottom formation. The 0.7200 figure also saw quite a bit of action yesterday as the buyers stabbed into offers around the H4 swap (supply) zone at 0.7222-0.7232. So far, there’s been no close above this region, but judging by the freshly painted H4 candle action we’re seeing right now, the offers appear to be drying up here.
Despite the relatively clear price movement on the H4 at the moment, the higher timeframes do not seem to be quite as agreeable! On the one hand, daily action is currently respecting a daily swap (demand) base at 0.7224-0.7184, and on the other, weekly movement is selling off from weekly supply at 0.7438-0.7315.Given this clear difference of opinion being seen here, our team will be looking at the following today:
- Watch for a close above the current H4 swap (supply) zone, and look to trade any confirmed retest seen at this barrier. Due to the position of price on the weekly timeframe (see above), we only have a single take-profit in mind – the daily swap (resistance) level just above it at 0.7269.
- Should the above come to fruition, and price connects with this daily level, our team will switch to the sell-side of this market and trade in-line with weekly flow (see above). As good as this sounds, however, we would still recommend waiting for the lower timeframes to prove selling strength exists here since there’s nothing worse than getting caught out on a fakeout above this level! Targets will depend on the approach.
Levels to watch/ live orders:
- Buys: Watch for offers to be consumed around 0.7222-0.7232 and then look to trade any retest seen at this area (confirmation required).
- Sells: 0.7269 [Tentative – confirmation required] (Stop loss: dependent on where one confirms this level).
USD/JPY:
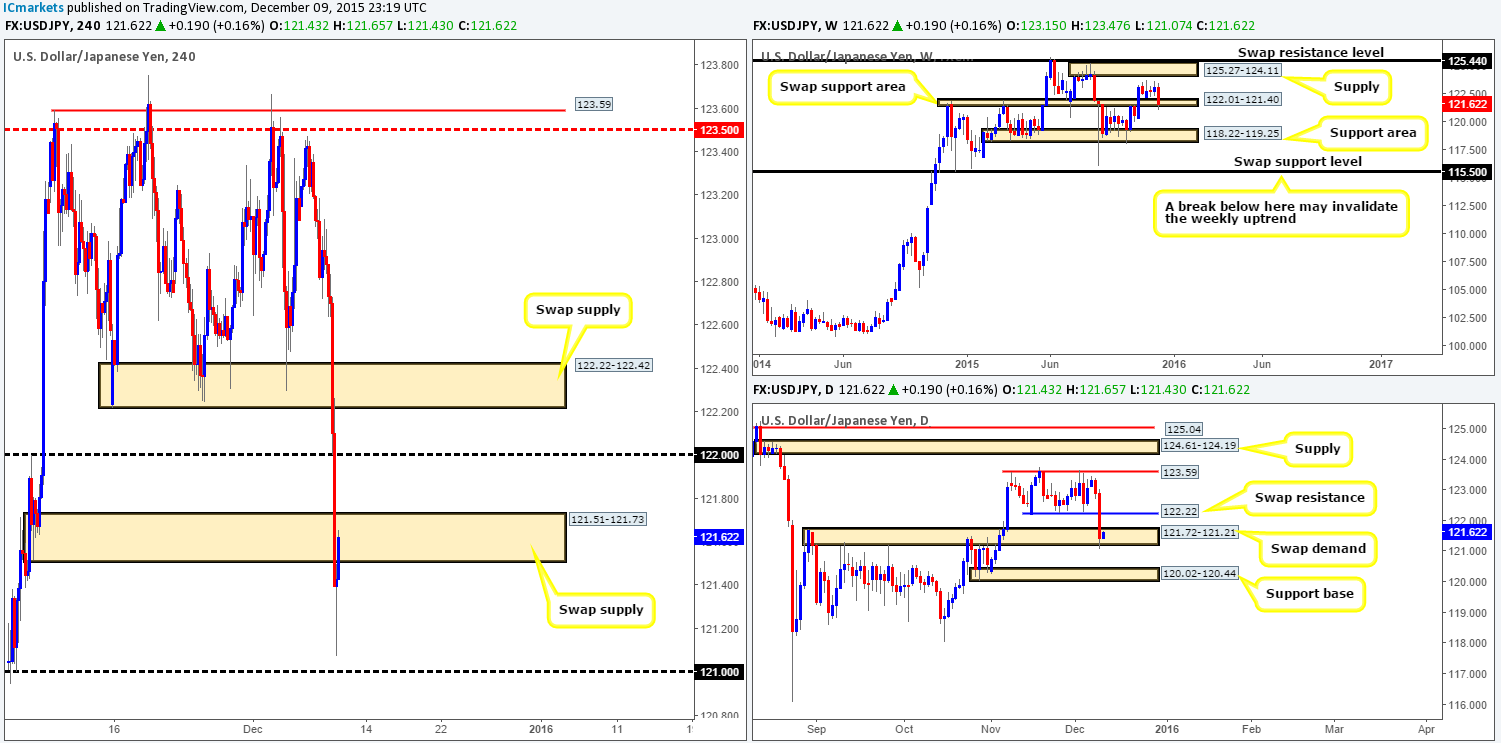
Upon opening the H4 chart of the USD/JPY pair this morning we were greeted with a sea of red candles. This 150-pip (open/close) sell-off took no prisoners! Demand (now supply) at 122.22-122.42, the 122.00 figure and another demand (also now supply) at 121.51-121.73 was taken out during this bearish assault. It was only once price hit lows of 121.07 did we see things begin to reverse.
In view of this market currently chewing on offers around the H4 swap supply at 121.51-121.73 right now, how do things stand on the higher timeframe picture? Well, over on the weekly chart, price pierced below a swap (support) area at 122.01-121.40, whilst daily action shows a clear violation of range lows at 122.22, resulting in price hitting and slightly surpassing a swap demand area at 121.72-121.21.
Consequent to the above points, our team favors the buy-side of this market today at least until psychological resistance 122.00 (sits just below daily swap resistance at 122.22). However, as things stand on the H4 timeframe right now (trading within a swap supply), there appears to be little opportunity to buy this market. Even with a break above the current H4 swap supply, we’re left with a mere 25 pips room for profit until 122.00 is hit. With that in mind, we’ll remain on the sidelines for now and wait for further developments.
Levels to watch/ live orders:
- Buys: Flat (Stop loss: N/A).
- Sells: Flat (Stop loss: N/A).
USD/CAD:
Kicking off our analysis this morning with a look at the weekly chart shows us that price remains trading just below a large weekly supply zone drawn from 1.3818-1.3630. Meanwhile, down on the daily timeframe, yesterday’s action painted an indecision candle that stabbed into the top-side of a swap demand base seen at 1.3530-1.3450. Supposing that this area holds firm, we see little resistance on this timeframe until the Quasimodo level coming in at 1.3721 (located within the aforementioned weekly supply).Turning our attention to the H4 timeframe, however, we can see that psychological resistance 1.3600 continues to hold this pair lower, which consequently forced price to connect with demand at 1.3496-1.3523during yesterday’s trade.
Although the overall trend on this pair remains strong, this market is proving a difficult one to read right now. Buying with the trend puts you against weekly supply, and selling from this supply would place one against the overall flow – very tricky indeed! However, seeing as how the H4 demand at 1.3496-1.3523 sits on top of the daily swap (demand) at 1.3530-1.3450, and the fact that price has yet to actually hit weekly supply (see above), we may look to buy (with confirmation) should price retest this barrier again today.
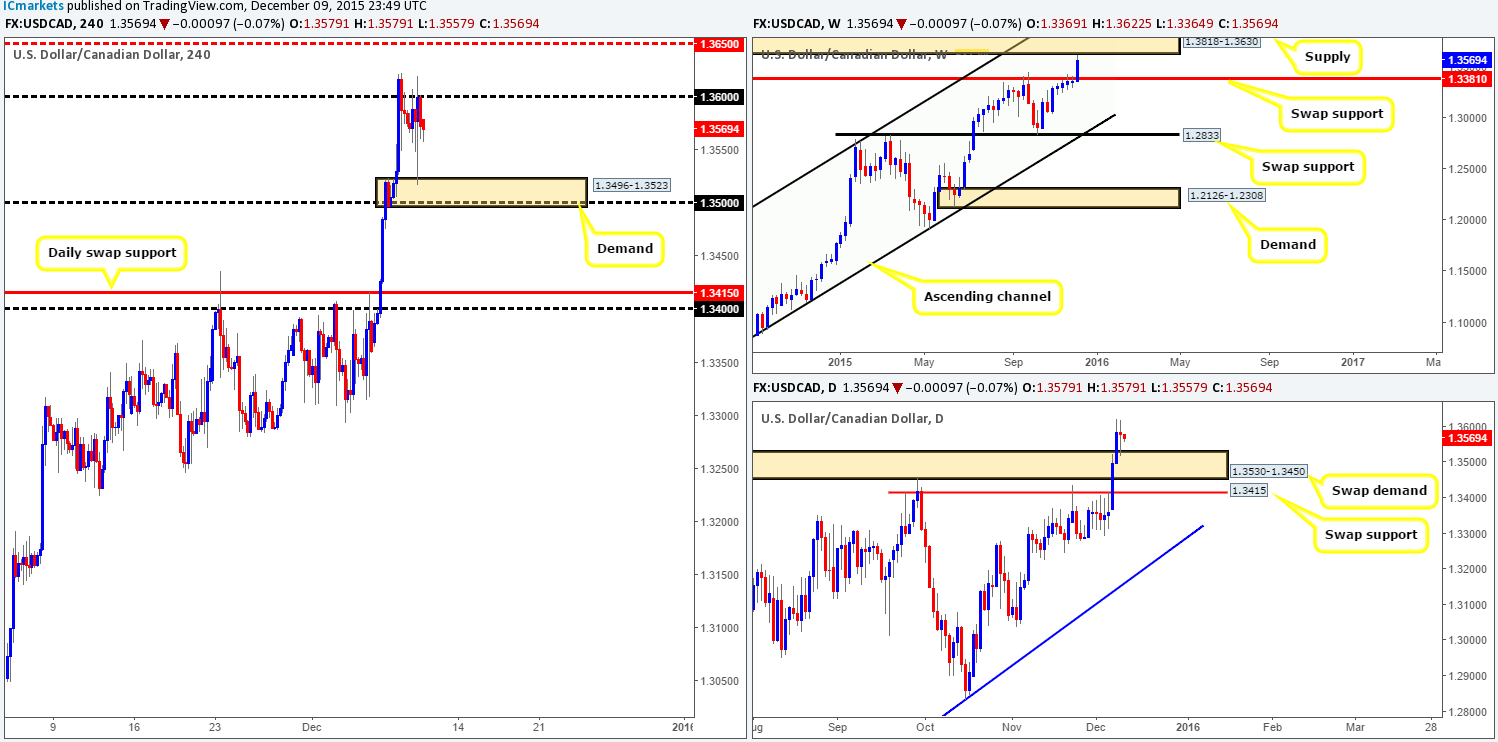
Levels to watch/ live orders:
- Buys:1.3496-1.3523[Tentative – confirmation required] (Stop loss: dependent on where one confirms this area).
- Sells: Flat (Stop loss: N/A).
USD/CHF:
The slaughter continues! USD/CHF takes yet another blow to the mid-section as prices tumble a further 95 pips by yesterday’s close 0.9828. This move, however, has brought this market into a very interesting area – a daily swap (support) barrier seen at 0.9822, which has proved itself through history as a key level to watch for. This – coupled with the H4 approach forming a shallow AB=CD bull pattern completing at 0.9827 (see black arrows), and price trading within a weekly swap (support) area at 0.9796-0.9902 suggests a possible reversal may take place from here.
Given the above, our plan of attack for today’s upcoming trade will consist of looking for lower timeframe buy entries around this daily level. Should an entry be seen, the first take-profit for us would be the recently broken low (now resistance) at 0.9875, followed by psychological resistance 0.9900 and then H4 supply at 0.9944-0.9919.

Levels to watch/ live orders:
- Buys: 0.9822 [Tentative – confirmation required] (Stop loss: dependent on where one confirms this level).
- Sells: Flat (Stop loss: N/A).
DOW 30
During the course of yesterday’s sessions, the DOW index stamped in a vicious-looking H4 selling wick, which, as you can see, brought about further selling down into the jaws of a H4 swap (support) level at 17440. Merging nicely with the 61.8% Fibonacci level at 17407, this area (a noted zone to watch for a confirmed from – see previous report: http://www.icmarkets.com/blog/wednesday-9th-december-daily-technical-outlook-and-review/) managed to turn this market around amidst the American afternoon session.
Despite this clear supportive barrier on the H4, the higher timeframe picture tells quite a different story. Weekly action continues to sell-off from the underside of a trendline resistance extended from the high 18365, with the next downside target coming in at 17135 – a weekly swap (support) barrier. By the same token, down on the daily timeframe, we can see room for price to continue lower until demand seen at 17133-17314 (sits on top of the above said weekly swap [support] level).
As a result, our team is not expecting much of a rally from the current H4 swap (support) line. In the event that our analysis is correct and the DOW does indeed break lower, we’ll then be eyeing the H4 trendline drawn from the low 16889. We like this trendline simply because it converges beautifully with daily demand seen at 17133-17314. Waiting for the lower timeframes to confirm strength exists here, however, might be the best path to take since trendlines are, in our humble opinion, not the most stable of lines to trade from.
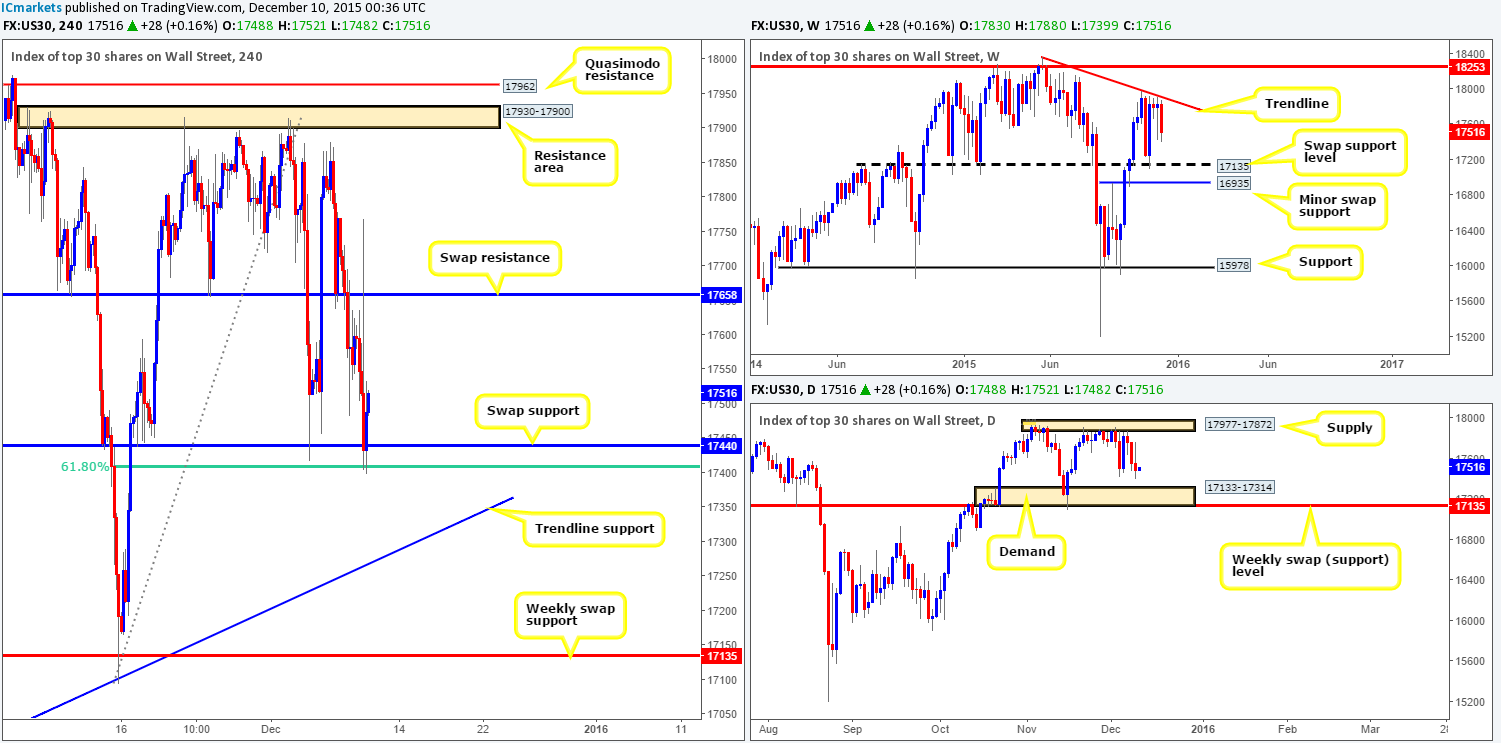
Levels to watch/ live orders:
- Buys: H4 trendline drawn from the low 16889 [Tentative – confirmation required] (Stop loss: dependent on where one confirms this line).
- Sells: Flat (Stop loss: N/A).
XAU/USD: (Gold)
A quick recap of yesterday’s movement shows that Gold came alive going into London trade, pushing the precious metal to highs of 1084.4, before collapsing to lows of 1069.3 around the London close. As price is once again hovering above a H4 support at 1068.3 which boasts a 50.0% Fibonacci level just below it at 1067.3, much of the following analysis will be similar to the previous…
With that, all eyes today will be on this current H4 support barrier, as well as the H4 demand below it at 1058.0-1062.4, which, as you can see, also boasts a 61.8% Fibonacci level at 1062.0. Supporting these areas, Gold is presently loitering around a daily swap (support) level coming in at 1071.2 that’s held firm since Monday. Nevertheless, we would highly recommend NOT placing pending buy orders at the above said H4 zones and only trading should lower timeframe confirmation be seen, since weekly action is seen hovering in no-man’s-land between demand at 1026.5-1054.8 and a swap supply zone at 1098.6-1121.7.
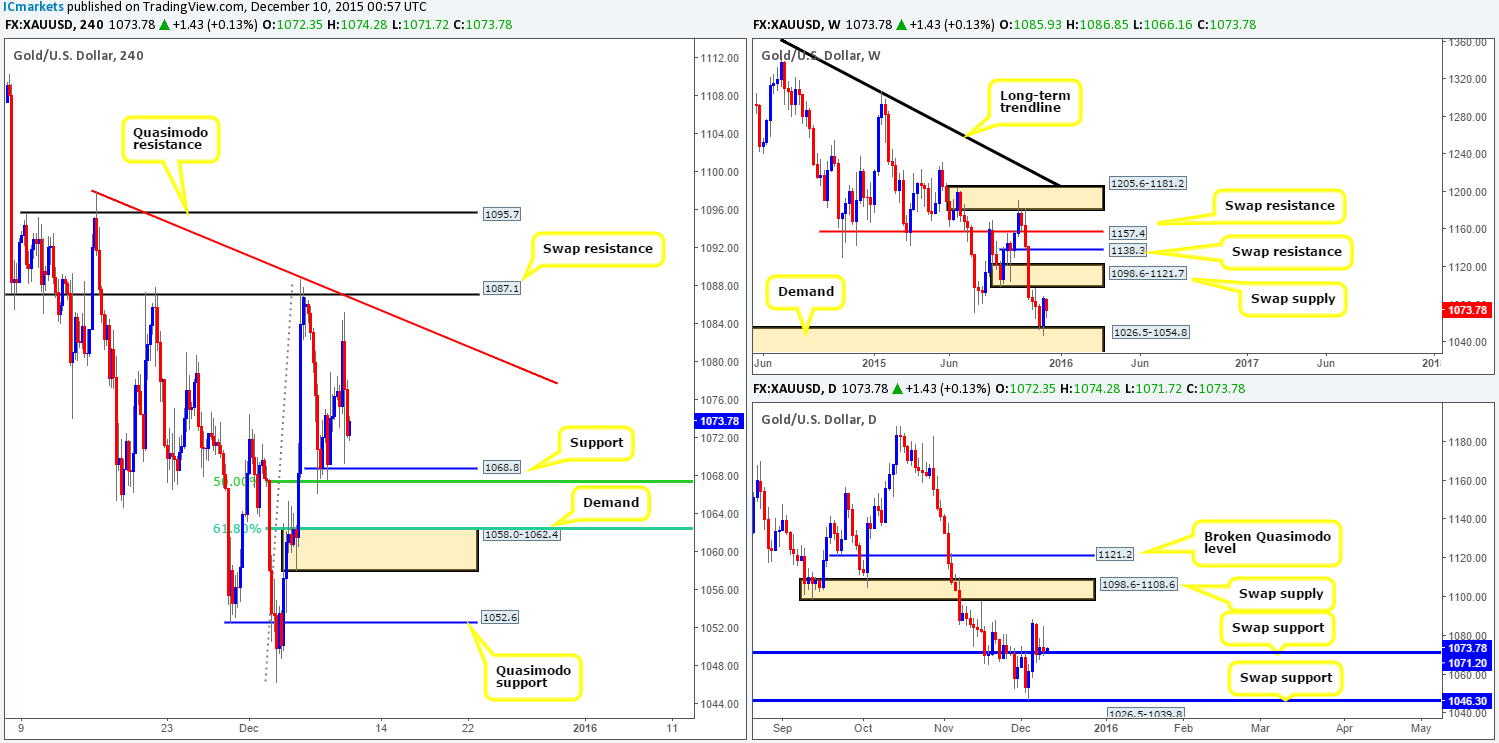
Levels to watch/ live orders:
- Buys: 1068.8 [Tentative – confirmation required] (Stop loss: dependent on where one confirms this level). 1058.0-1062.4 [Tentative – confirmation required] (Stop loss: dependent on where one confirms this area).
- Sells: Flat (Stop loss: N/A).


