A note on lower timeframe confirming price action…
Waiting for lower timeframe confirmation is our main tool to confirm strength within higher timeframe zones, andhas really been the key to our trading success. It takes a little time to understand the subtle nuances, however, as each trade is never the same, but once you master the rhythm so to speak, you will be saved from countless unnecessary losing trades. The following is a list of what we look for:
- A break/retest of supply or demand dependent on which way you’re trading.
- A trendline break/retest.
- Buying/selling tails – essentially we look for a cluster of very obvious spikes off of lower timeframe support and resistance levels within the higher timeframe zone.
- Candlestick patterns. We tend to only stick with pin bars and engulfing bars as these have proven to be the most effective.
For us, lower timeframe confirmation starts on the M15 and finishes up on the H1, since most of our higher timeframe areas begin with the H4.
EUR/USD:
- Weekly Gain/Loss:-53 pips
- Weekly closing price:1.0589
- Weekly opening price:1.0588
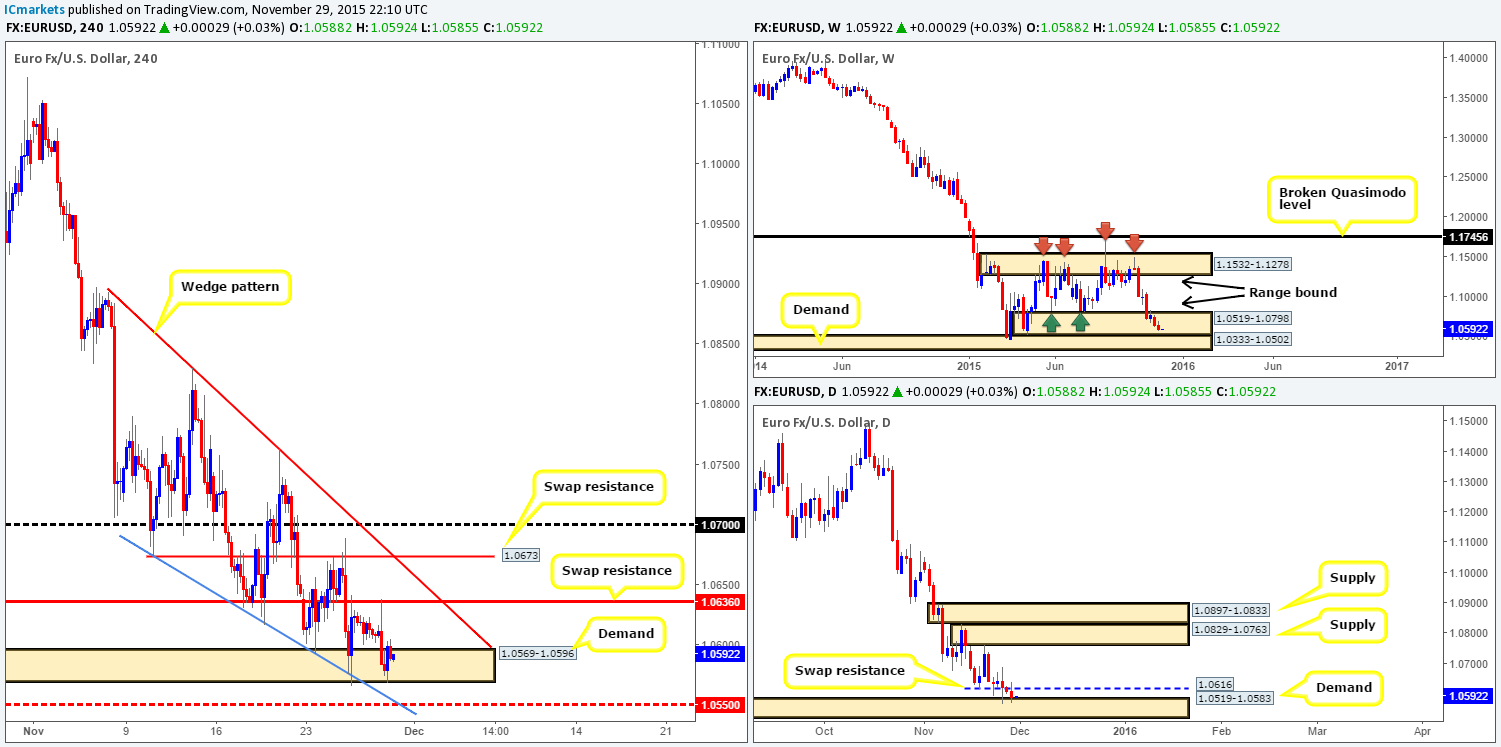
The EUR continued to drive south last week, forcing weekly action deeper into the range demand zone seen at 1.0519-1.0798. Granted, the overall momentum on this pair has certainly diminished over the past two weeks, suggesting a last-minute rebound may be on the horizon from here. In the event that the sellers remain dominant, however, we can likely expect the current range demand to be consumed, and prices connect with demand seen just below it at 1.0333-1.0502.
Turning our attention to the daily timeframe, support (now resistance) at 1.0616 was consumed during Thursday’s sluggish trade. As a result, further selling was seen going into Friday’s session, consequently pushing price back down into demand at 1.0519-1.0583 (positioned deep within the weekly range demand at 1.0519-1.0798).
For those who read Friday’s report (http://www.icmarkets.com/blog/friday-27th-november-daily-technical-outlook-and-review/), you may recall us mentioning that we had our eye on the H4 swap resistance level at 1.0636 for a confirmed short. As you can see, price reacted beautifully to this level, but unfortunately the move into this barrier was just too fast for us to find a lower timeframe setup to sell here.
As can be seen from the H4 chart, the market closed the week deep into demand at 1.0569-1.0596, and opened this morning a pip below Friday’s close (see above). As such, we are going to be focusing on the mid-level support 1.0550 for confirmed longs today for the following reasons:
- If you look back in history you’ll see this barrier has provided this market a strong ‘floor’ to trade from on a number of occasions.
- Located within both the above said weekly range demand and daily demand (1.0519-1.0798/1.0519-1.0583).
- Converges nicely with the lower limit of the current wedge pattern taken from the low 1.0674.
The reason for requiring confirmation to buy at 1.0550 simply comes from the clear downtrend this market is in at the moment.
Levels to watch/live orders:
- Buys:1.0550 [Tentative – confirmation required] (Stop loss: dependent on where one confirms this level).
- Sells: Flat (Stop loss: N/A).
GBP/USD:
- Weekly Gain/Loss:-157 pips
- Weekly closing price:1.5028
- Weekly opening price:1.5031
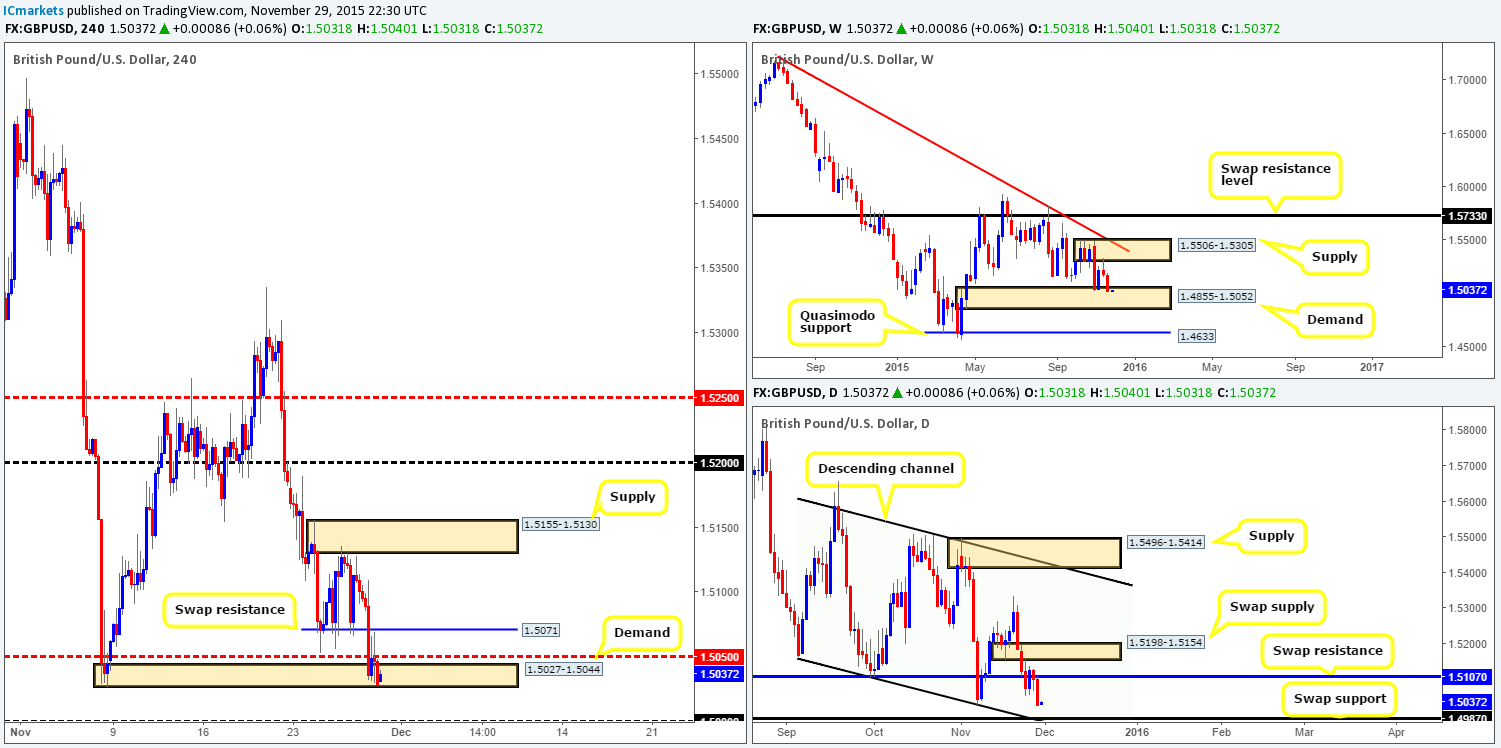
Following the bearish selling wick printed off the underside of weekly supply at 1.5506-1.5305, traders continued to short the GBP last week down into the jaws of demand at 1.4855-1.5052, consequently painting a full-bodied bearish candle.
Daily price on the other hand shows that there’s room for further downside this week towards swap support coming in at 1.4987, which merges beautifully with channel support extended from the low 1.5162. Considering the strength of last week’s candle, and little supportive structure seen to the left of current price, we feel the above said swap support may come into play early on this week.
A quick recap of Friday’s H4 activity reveals the GBP punched lower going into London trade, taking out both support (now resistance) at 1.5071 and mid-level support 1.5050, before driving deep into demand at 1.5027-1.5044 by the week’s end.
Consequent to a relatively stable open this morning price remains trading within the above said demand. Although this demand zone is lurking within the aforementioned weekly demand at 1.4855-1.5052, we remain wary of buying from here. The reasons for why is, for one, mid-level resistance 1.5050 is hovering just above like a big rain cloud, and two, daily structure (as we mentioned above) suggests the GBP may decline further yet. With that being said, what we are now interested in is the large psychological number 1.5000 below. Other than the fact that this is a huge number market participants focus on, we also see the following supporting structures:
- Located deep within the above said weekly demand.
- 1.5000 hovers just above a daily swap (support) level at 1.4987.
- It also converges beautifully with daily channel support extended from the low 1.5162.
When, or indeed if price reaches this number, we would consider entering long at market from here (dependent on the time of day) and placing our stop at 1.4955 beyond the low formed on the 24/04/15 at 1.4959.
Levels to watch/ live orders:
- Buys: 1.5000 (Stop loss: 1.4955).
- Sells: Flat (Stop loss: N/A).
AUD/USD:
- Weekly Gain/Loss:-46 pips
- Weekly closing price:0.7188
- Weekly opening price:0.7191
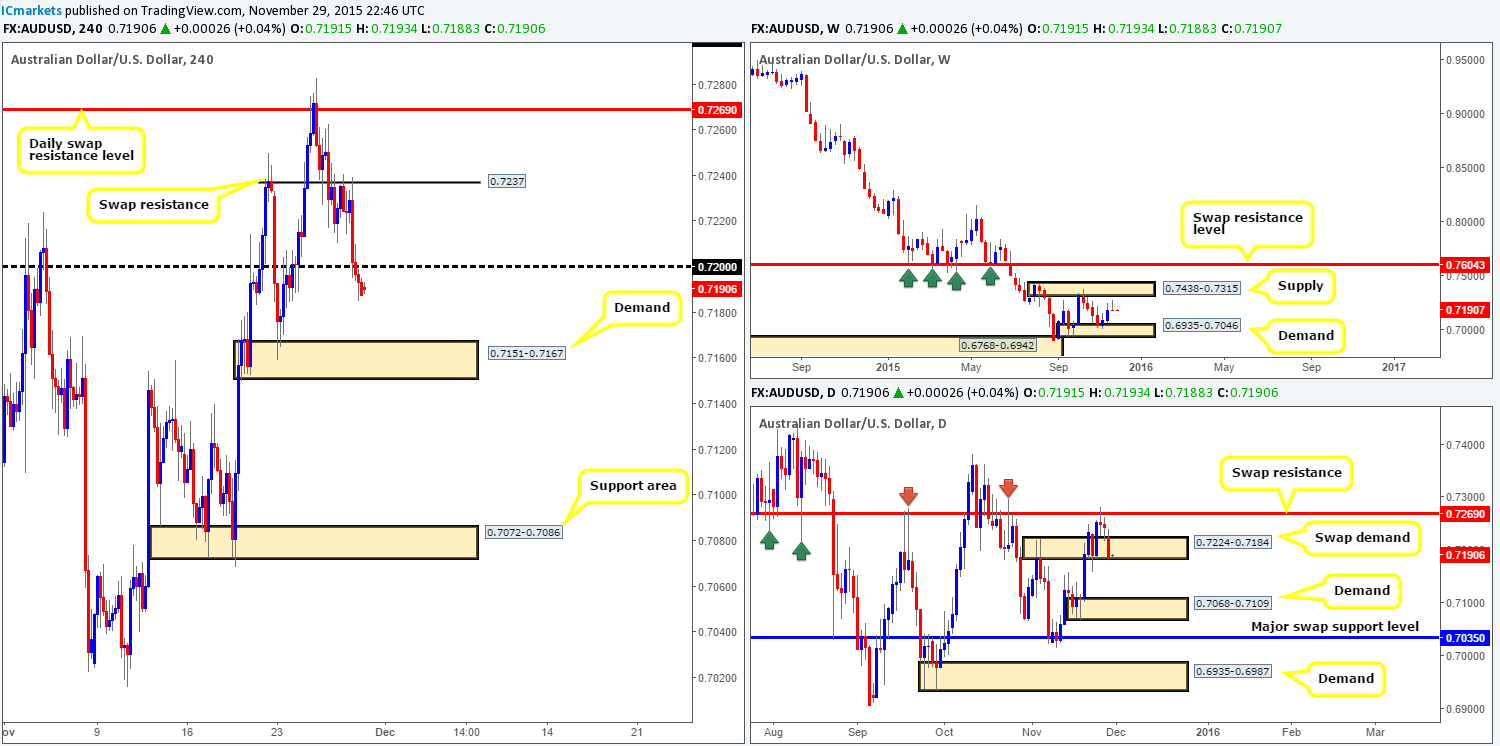
Last week’s action shows that the bulls did in fact make a play for weekly supply seen at 0.7438-0.7315, but fell short thirty or so pips before aggressively selling off and wrapping up the week forming a clear-cut bearish pin bar. As such, our team will be keeping an eye on both the above said supply zone, and also the demand seen below drawn from 0.6935-0.7046 this week.
By zooming in and looking at the daily picture we can see why, at least from a technical point of view, price failed to hit the aforementioned weekly supply last week. From Wednesday onwards, a strong ceiling of offers were hit around a daily swap (resistance) level at 0.7269. This eventually sent the Aussie deep into a swap demand area coming in at 0.7224-0.7184. Should this zone hold this week, keep a tab on the above said swap resistance level. Supposing it gives way, however, then we see little (technical) reason why this market will not eventually sell-off down to demand at 0.7068-0.7109 (positioned just above the aforementioned weekly demand zone).
Looking at Friday’s H4 action, it’s pretty clear to see that it was not a good day for anyone long this market! Fortunately for us, the bounce seen at psychological support 0.7200 (a noted level to watch for longs) during this down move was not strong enough to find a lower timeframe setup to enter long. In fact, price ended the week closing beyond this number and retesting its boundaries as resistance.
Given this and that this morning’s open was relatively stable; price may be heading towards demand coming in at 0.7151-0.7167. The reason we use the word ‘may’ here is because let’s not forget that daily price is trading within the confines of a swap demand area (see above) right now. In order for us to be permitted to take advantage of this potential intraday move here, we’d require another retest of 0.7200 to be seen together with lower timeframe confirming price action.
Levels to watch/ live orders:
- Buys: Flat (Stop loss: N/A).
- Sells: 0.7200 [Tentative – confirmation required] (Stop loss: dependent on where one confirms this level).
USD/JPY:
- Weekly Gain/Loss:+6 pips
- Weekly closing price:122.81
- Weekly opening price:122.81
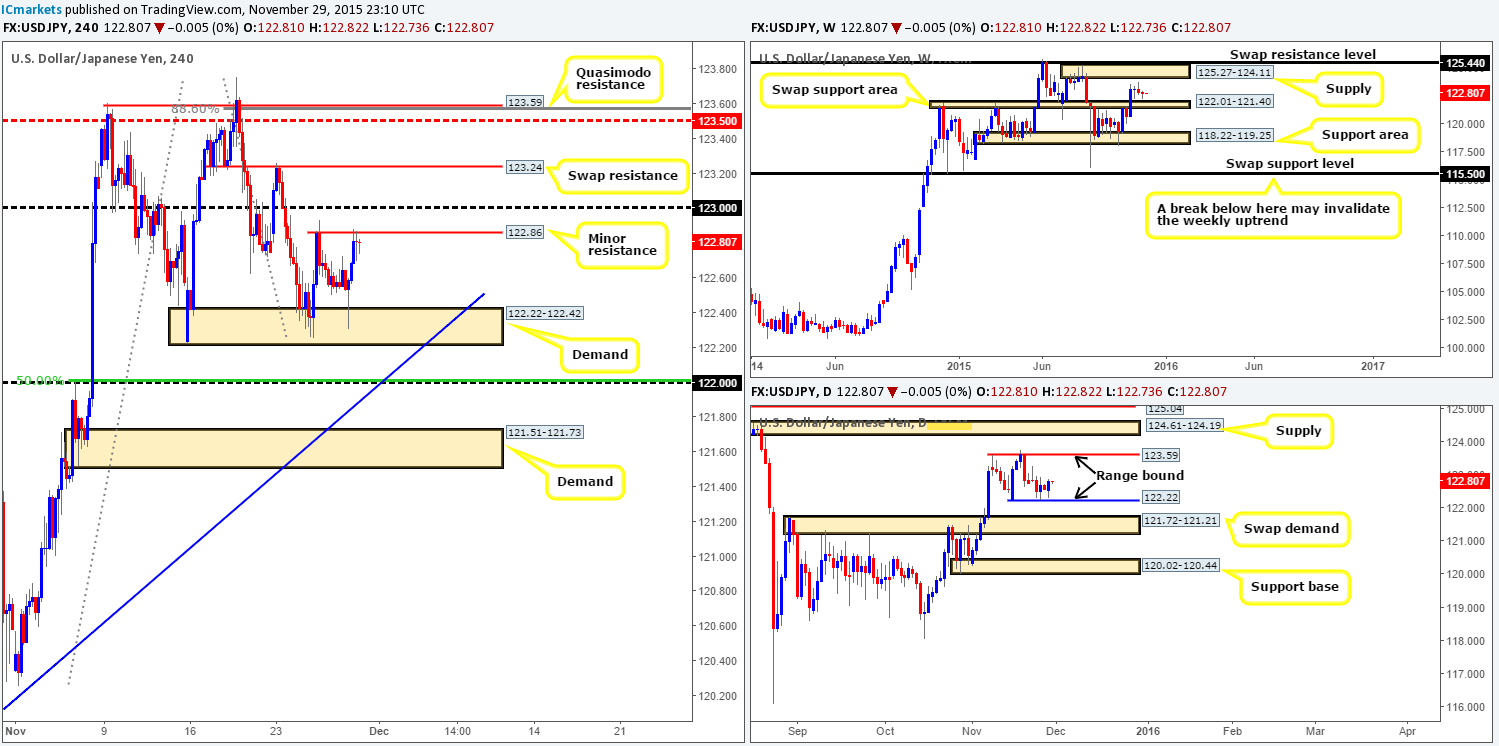
Looking at the weekly timeframe, there has been little change seen to the structure of this market over the past three weeks. Price remains loitering between a swap support area coming in at 122.01-121.40 and a supply area seen at 125.27-124.11. Other than the fact that price gained a mere six pips into the close 122.81 there is not much else to report… Let’s dive into the lower timeframes and see what we can find…
From the daily timeframe, a clearer picture is being painted. Daily action has begun to carve out a consolidation zone between 123.59/122.22, and is, at the time of writing, trading off the lower limits of this structure. For this reason, shorting this pair may not be the best path to take right now.
Stepping down to the H4, we can see that the USD/JPY rallied during Friday’s trade from demand at 122.22-122.42 (this area effectively represents the lower limits of the current daily range) for the second time in the month, reaching minor resistance coming in at 122.86 by the close. Just beyond this barrier, however, not only is there psychological resistance sitting just above at 123.00, there’s also a swap resistance level just above that at 123.24. Therefore, although daily structure shows price trading from the lower limits of range support at 122.22, going long right now is not something that we’d be comfortable with.
With no clear near-term barriers to trade right now, here is what have our eye on for possible (confirmed) trades this week…
- For buys we’re watching psychological support 122.00. The reason for why is not only does this beauty line up perfectly with the top-side of the aforementioned weekly swap (support) area, it also boasts 50.0% Fibonacci support at 122.01 and trendline support taken from the low 119.61.
- For sells, we have the Quasimodo resistance level at 123.59 in view. This, as you can probably see also marks the upper band of the current daily range, converges nicely with the 88.6% Fibonacci level at 123.56 and is positioned just above the mid-level number 123.50.
Levels to watch/ live orders:
- Buys: 122.00 [Tentative – confirmation required] (Stop loss: dependent on where one confirms this level).
- Sells:123.59 [Tentative – confirmation required] (Stop loss: dependent on where one confirms this level).
USD/CAD:
- Weekly Gain/Loss:+21 pips
- Weekly closing price:1.3366
- Weekly opening price:1.3357
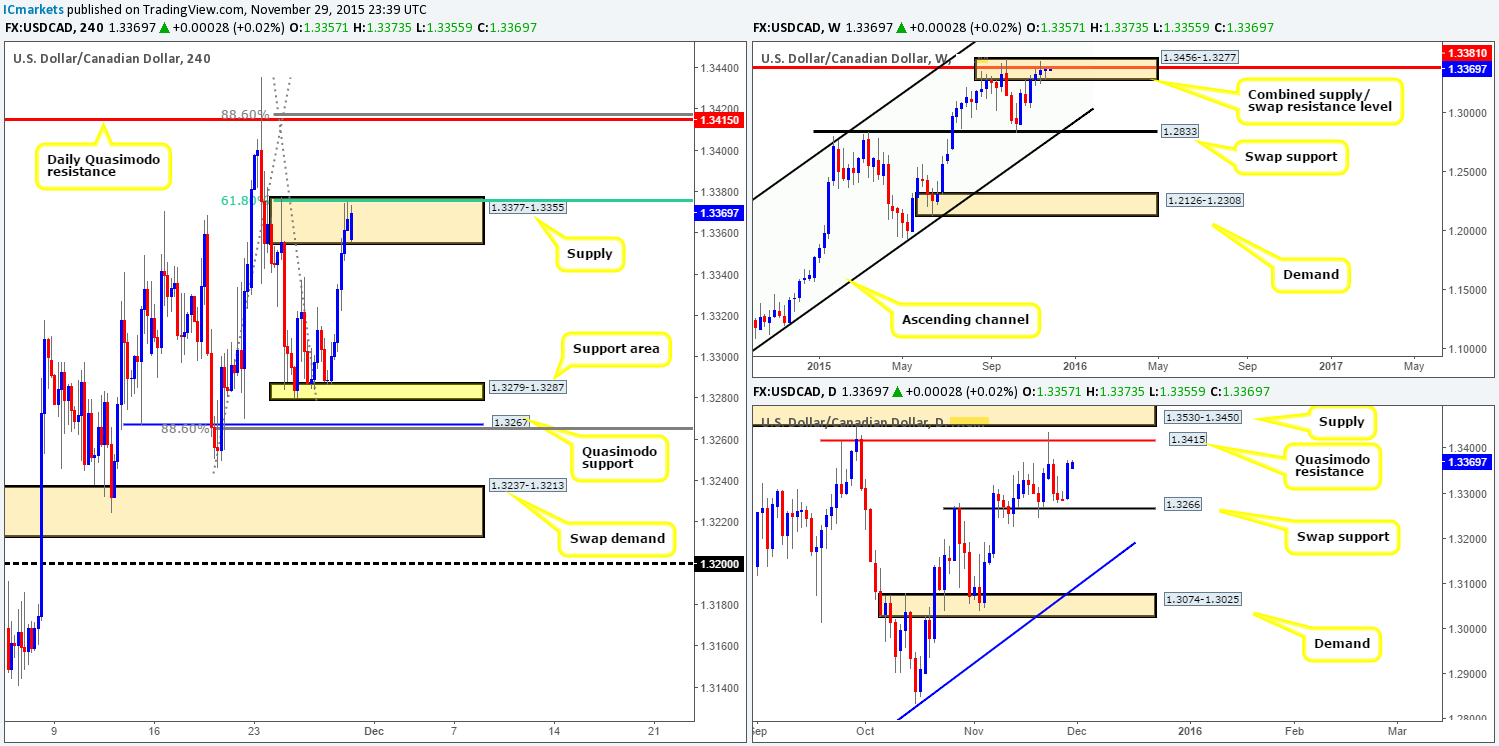
Although price remains lodged within a combined weekly supply/ swap resistance area at 1.3456-1.3277/1.3381, little noteworthy selling has been seen so far. In fact, this is the fourth consecutive week the market closed (1.3366) higher. A sell-off from here is looking less and less likely considering the strength of the U.S. dollarat the moment. With this in mind, a break beyond this zone could send prices up to the supply area seen at 1.3818-1.3630.
Rolling a page lower to the daily timeframe, last week’s activity shows that the bid-side of this market remained above the swap support level coming in at 1.3266. This, at least in our opinion, indicates little selling strength is present from the above said combined weekly supply/ swap resistance area. Zones to make a note of on this timeframe for this week are the Quasimodo resistance barrier at 1.3415, followed closely by supply above it at 1.3530-1.3450, and also the swap support level mentioned above at 1.3266.
Moving down a level lower to the H4 timeframe, Thursday’s rebound from the support area at 1.3279-1.3287 sent prices soaring on Friday, taking out several technical levels and ending the week by driving into supply at 1.3377-1.3355. Now, considering that even though there was a small gap of nine pips at the open 1.3357 this morning, price continues to loiter within the above said supply, which boasts additional resistance from the 61.8% Fibonacci level at 1.3375. Despite this, we remain hesitant about shorting this zone due to the lack of strength seen from the aforementioned combined weekly supply/ swap resistance area, and little obvious daily resistance.
Therefore, on the H4 timeframe, this leaves us with the daily Quasimodo resistance level above at 1.3415, and the support area mentioned already at 1.3279-1.3287, followed closely by the Quasimodo support at 1.3267.
The daily Quasimodo is a level we’re interested in this week. Not only has it proven itself already by holding this market lower on the 23/11/15 at 1.3435, it also coincides nicely with both the aforementioned (albeit weak-looking)combined weekly supply/ swap resistance area and the 88.6% Fibonacci level at 1.3416. As such, it could be a level that holds price again this week (waiting for lower timeframe confirmation is highly recommended before selling here).
The support area on the other hand is still not likely somewhere we’d consider is a safe place to buy from due to the Quasimodo support level lurking just below it. Reason being is this Quasimodo level converges with the 88.6% Fibonacci level at 1.3265 and also the daily swap (support) at 1.3266. Therefore, this is also an area to keep an eye on this week for confirmed buys.
Levels to watch/ live orders:
- Buys:1.3267 [Tentative – confirmation required] (Stop loss: dependent on where one confirms this level).
- Sells:1.3415 [Tentative – confirmation required] (Stop loss: dependent on where one confirms this level).
USD/CHF:
- Weekly Gain/Loss:+109 pips
- Weekly closing price:1.0288
- Weekly opening price:1.0295
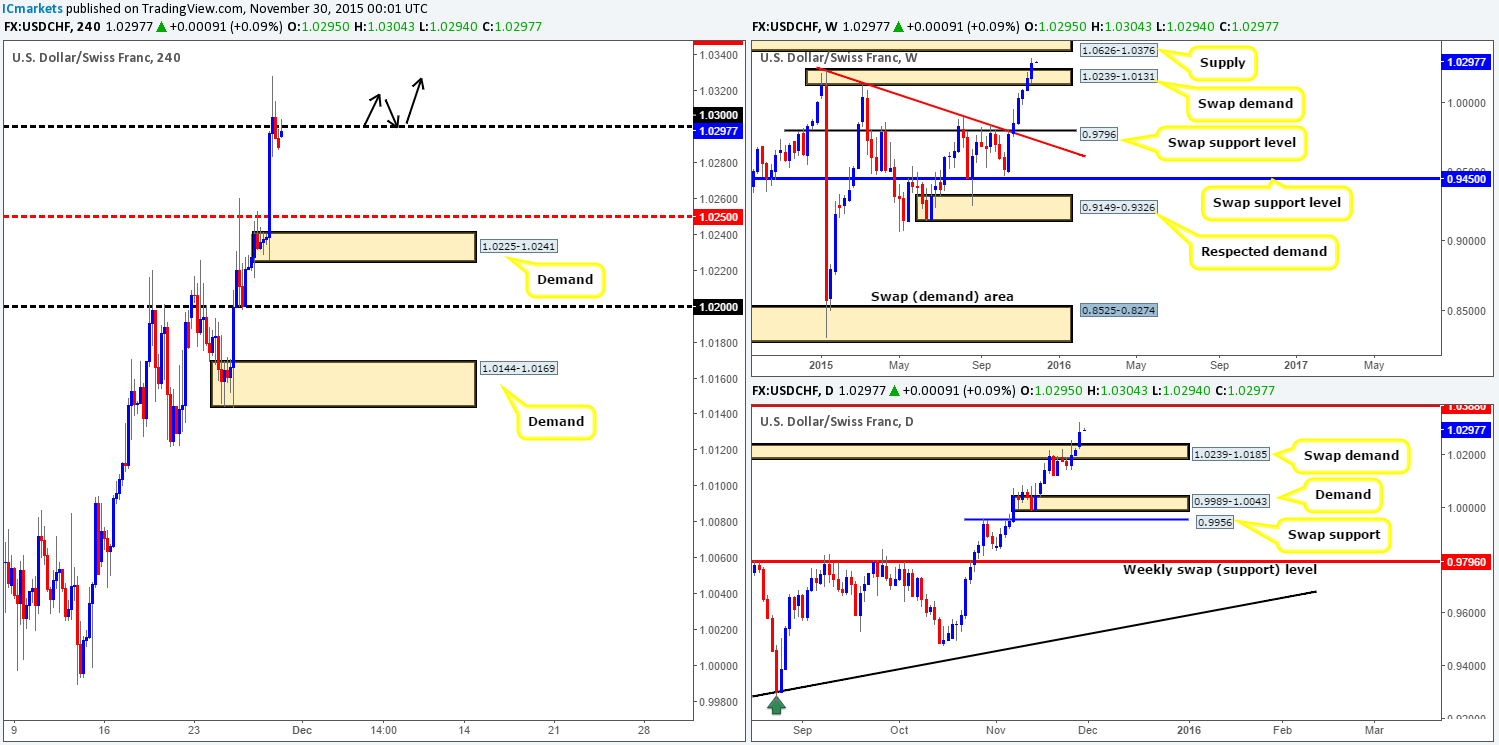
It was another depressing week for the Swiss Franc… For the sixth consecutive week, the U.S. dollar rallied higher, consequently closing above a major supply (now demand) seen at 1.0239-1.0131, potentially opening the pathway to further upside this week towards supply visible at 1.0626-1.0376.
In consequence to this recent advance, the weekly’s partner supply (now demand) on the daily timeframe at 1.0239-1.0185 has also been taken out, likely opening the trapdoor for prices to challenge the swap resistance level seen at 1.0388 (located just within the weekly supply mentioned above at 1.0626-1.0376). Given the position of price on the daily and weekly timeframes right now, our team is currently biased to the buy-side of this market for the time being. Let’s take a peek at what the H4 timeframe has to say on the matter…
Zooming in and looking at the H4 chart shows that this pair came alive going into the London session on Friday, rallying a cool 57 pips in one fell swoop. This, as we can see, brought price up into the hands of psychological resistance 1.0300, which, consequent to the open 1.0295, is where the pair is currently trading right now.
Given what we noted regarding the higher timeframe structures (see above), we have absolutely no interest in shorting from 1.0300 today. In fact, what we’d ultimately like to see is a forceful close above this number and subsequent retest as support. This would effectively be our cue to begin looking for a confirmed long (confirmation required here simply because fakeouts are common around fixed levels such as these) into this market. Should the above come to fruition, we’ll be eyeing the mid-level resistance 1.0350 as our first take-profit target, followed by the underside of weekly supply at 1.0376.
Levels to watch/ live orders:
- Buys: Watch for offers to be consumed around 1.0300 and then look to trade any retest seen at this level (confirmation required).
- Sells: Flat (Stop loss: N/A).
DOW 30:
- Weekly Gain/Loss:-36 points
- Weekly closing price:17799
- Weekly opening price:17799
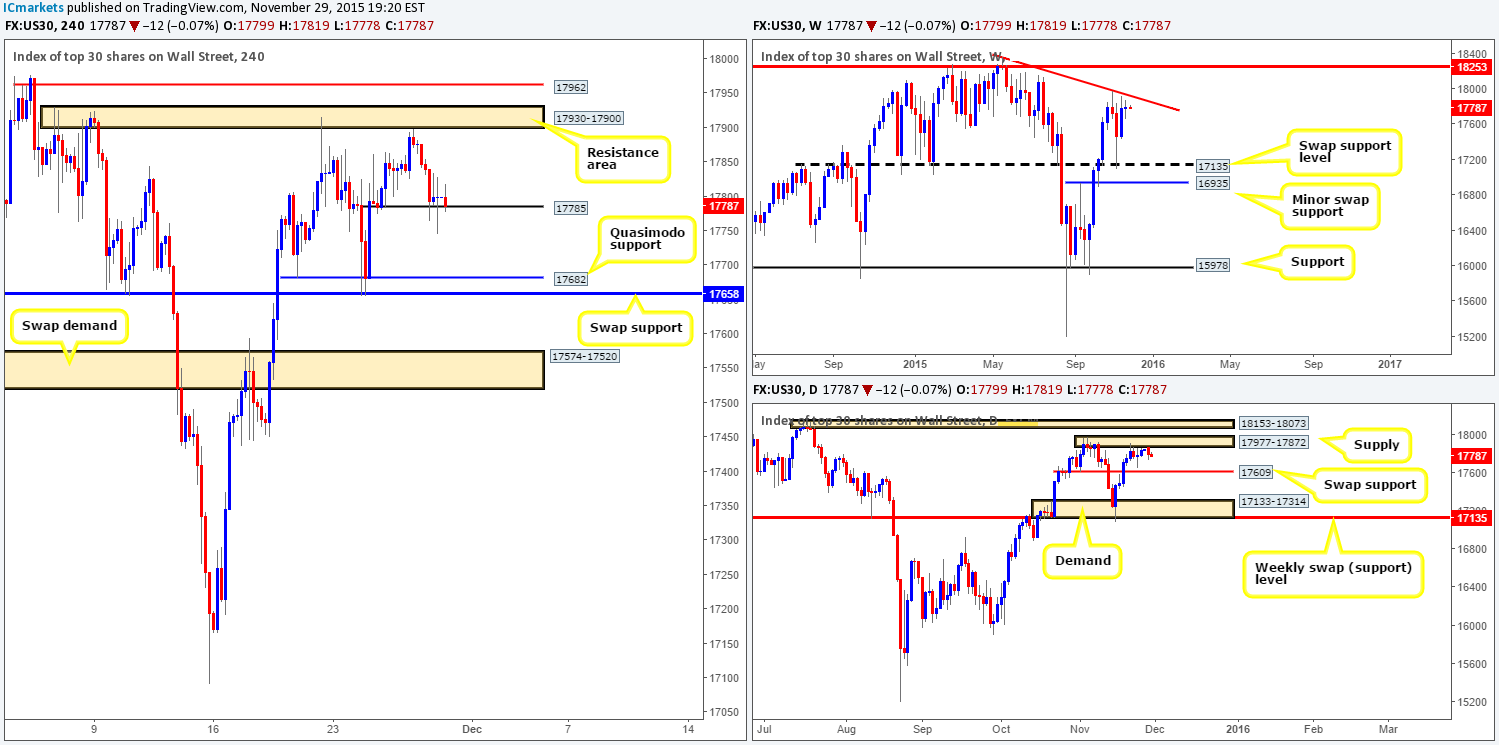
There was clearly uncertainty present in this market last week, as the buyers and sellers collectively formed a clear-cut weekly indecision candle at the underside of a trendline resistance extended from the high 18365. In the event that this line is taken out this week, nonetheless, keep a close watch on resistance seen around the 18253 mark. Conversely, should this market drive lower from here, we’ll be eyeing the swap support level fixed at 17135.
Shifting a gear lower, last week’s flow on the daily timeframe showed that the buyers and sellers were seen battling for position beneath a supply zone drawn from 17977-17872. A break above this supply this week would likely see the DOW shake hands with supply coming in at 18153-18073. A drive lower on the other hand could see the swap support at 17609, followed by demand at 17133-17314 (sits on top of the above said weekly swap [support] level at 17135) come into play sometime this week.
Following Thursday’s rebound two points from below the H4 resistance area at 17930-17900, the DOW continued to sell-off during Friday’s trade, consequently ending the week driving into and respecting minor support at 17785.
Taking into account the position of where price is currently located on the higher timeframe picture, and no change being seen at this morning’s open, we would not be comfortable buying into this market from the current support. To that end, should 17785 be taken out and retested as resistance today, we may, dependent on how the lower timeframe action behaves following the retest, look to short this market down to the Quasimodo support level at 17682. This level, coupled with the swap support lurking below it at 17658 will likely be enough to see price retrace, before potentially continuing on south down to the daily swap support mentioned above at 17609.
Levels to watch/ live orders:
- Buys: Flat (Stop loss: N/A).
- Sells:Watch for bids to be consumed around 17785 and then look to trade any retest seen at this level (confirmation required).
XAU/USD (Gold):
- Weekly Gain/Loss:1960 pips ($19.6)
- Weekly closing price:1058.0
- Weekly opening price:1058.0
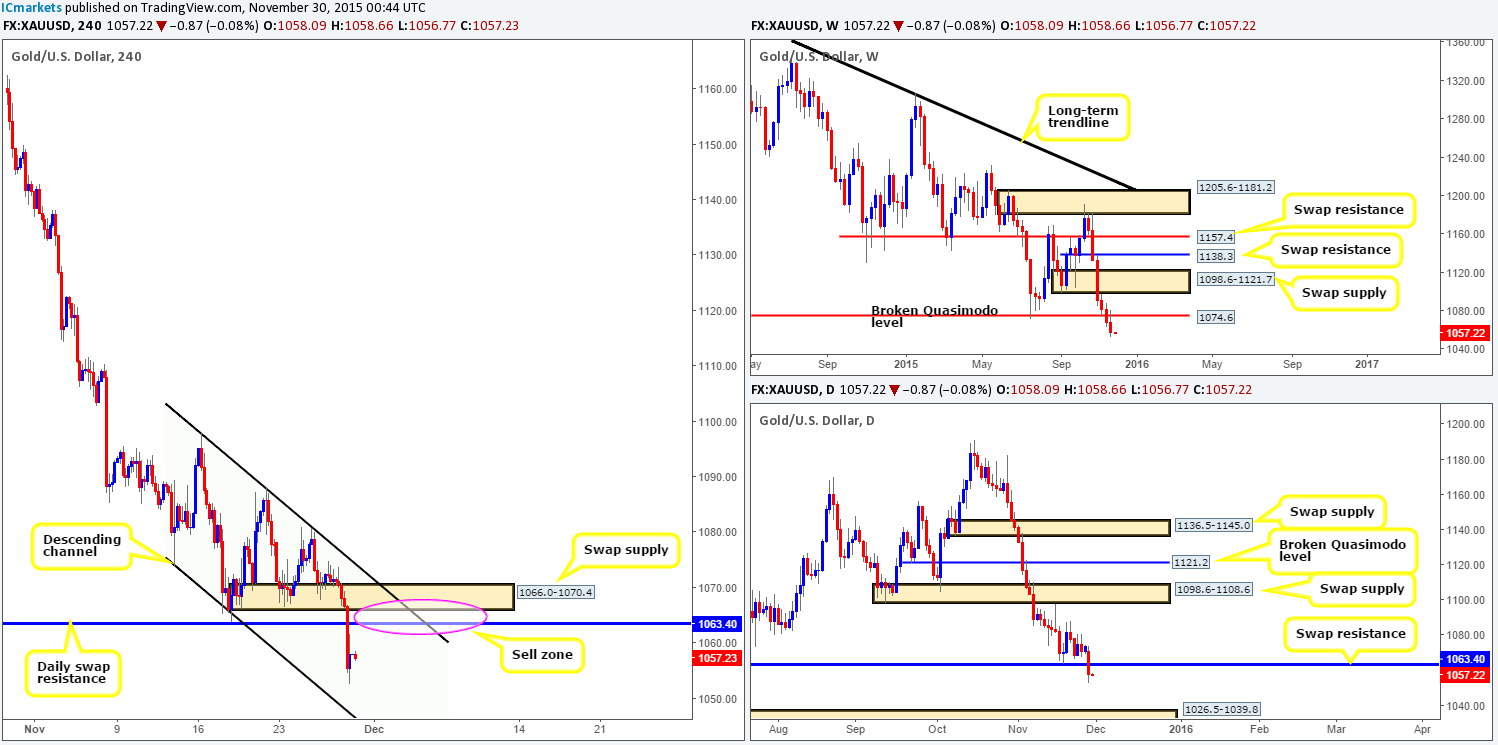
Gold appears to be heading one way folks, south!With last week’s movement marking the sixth consecutive loss for the precious metal, erasing close to another $20 off its value, and retesting the underside of the recently broken Quasimodo support as resistance at 1074.6, where do we go from here!? Well, assuming that 1074.6 continues to hold firm, the swap support barrier seen at 1027.6 which is quite a way off from current price could very well be where Gold is heading next. It may not make it this week or even the week after that, but it’s still a level to keep noted in our humble opinion.
On the other side of the ledger, recent daily movement, specifically Friday’s action took out a swap support (now resistance) level seen at 1063.40. Assuming that this hurdle holds as resistance this week, we’re confident Gold is heading lower towards demand coming in at 1026.5-1039.8 (surrounds the weekly swap [support] barrier at 1027.6).
Branching lower to the H4 timeframe, a quick look at Friday’s movement shows that not only did the daily swap (support) level at 1063.4 get taken out;demand (now supply) at 1066.0-1070.4 was also consumed.
Consequent to the above, and the fact that Gold opened calmly this morning, we will be watching for confirmed shorts around both of the above said areas. Furthermore, considering that we’re dealing with a daily level here, and that there is no weekly support in the way (see above in bold), we would look to hold on to this trade at least until the H4 channel support taken from the low 1074.0, possibly followed by the daily demand mentioned above at 1026.5-1039.8.
Levels to watch/live orders:
- Buys: Flat (Stop loss: N/A).
- Sells: 1063.4 [Tentative – confirmation required] (Stop loss: dependent on where one confirms this level) 1066.0-1070.4 [Tentative – confirmation required] (Stop loss: dependent on where one confirms this area).