A note on lower timeframe confirming price action…
Waiting for lower timeframe confirmation is our main tool to confirm strength within higher timeframe zones, andhas really been the key to our trading success. It takes a little time to understand the subtle nuances, however, as each trade is never the same, but once you master the rhythm so to speak, you will be saved from countless unnecessary losing trades. The following is a list of what we look for:
- A break/retest of supply or demand dependent on which way you’re trading.
- A trendline break/retest.
- Buying/selling tails – essentially we look for a cluster of very obvious spikes off of lower timeframe support and resistance levels within the higher timeframe zone.
- Candlestick patterns. We tend to only stick with pin bars and engulfing bars as these have proven to be the most effective.
For us, lower timeframe confirmation starts on the M15 and finishes up on the H1, since most of our higher timeframe areas begin with the H4.
EUR/USD:
The EUR/USD pair barely saw any movement during yesterday’s sessions as U.S. trade remained closed in observance of Thanksgiving.
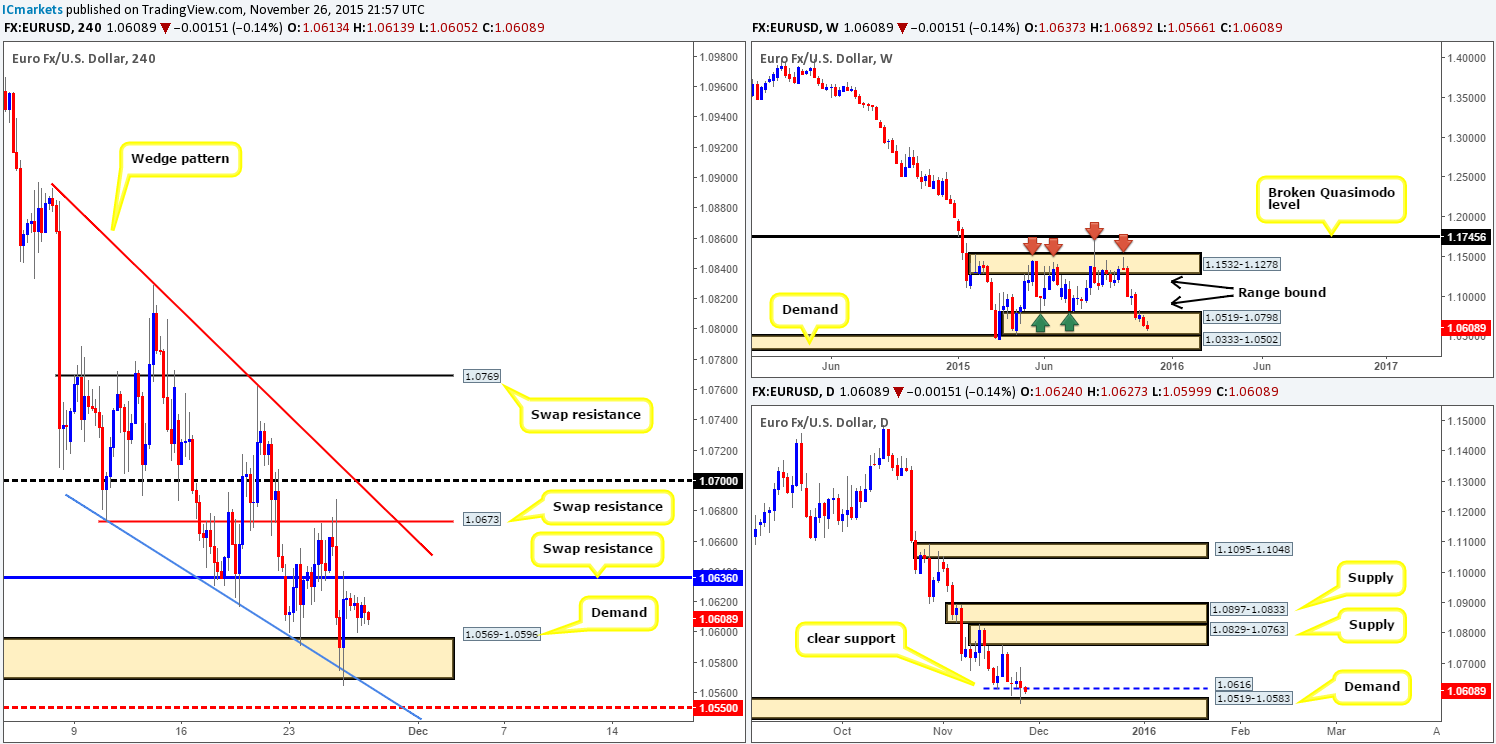
Pushing forward, however, this pair still appears very weak at present, as over the past few weeks, price has seen very little buying interest from within the weekly range demand at 1.0519-1.0798. Meanwhile, down on the daily timeframe, market action also recently closed below support at 1.0616, and as a result, is now within touching distance of connecting with demand once again at 1.0519-1.0583. Alongside this, H4 price shows that although demand at 1.0569-1.0596 held, stops were likely taken out from below this area due to Wednesday’s spike seen at 1.0564, thus potentially weakening this zone.
For this reason, we personally believe this pair has further to decline yet. As such, we have our eye on the swap resistance level at 1.0636 for confirmed shorts today (confirmation needed here due to the possibility of a fakeout). In addition to this, we also are watching the mid-level support 1.0550 for confirmed longs, which if you look back in history you’ll see this barrier has provided this market a strong ‘floor’ to trade from on a number of occasions. What is more, this level is still positioned within both the above said weekly range demand and daily demand. The reason for requiring confirmation to buy at 1.0550 simply comes from the clear downtrend this market is in at the moment.
Levels to watch/live orders:
- Buys:1.0550 [Tentative – confirmation required] (Stop loss: dependent on where one confirms this level).
- Sells: 1.0636 [Tentative – confirmation required] (Stop loss: dependent on where one confirms this level).
GBP/USD:
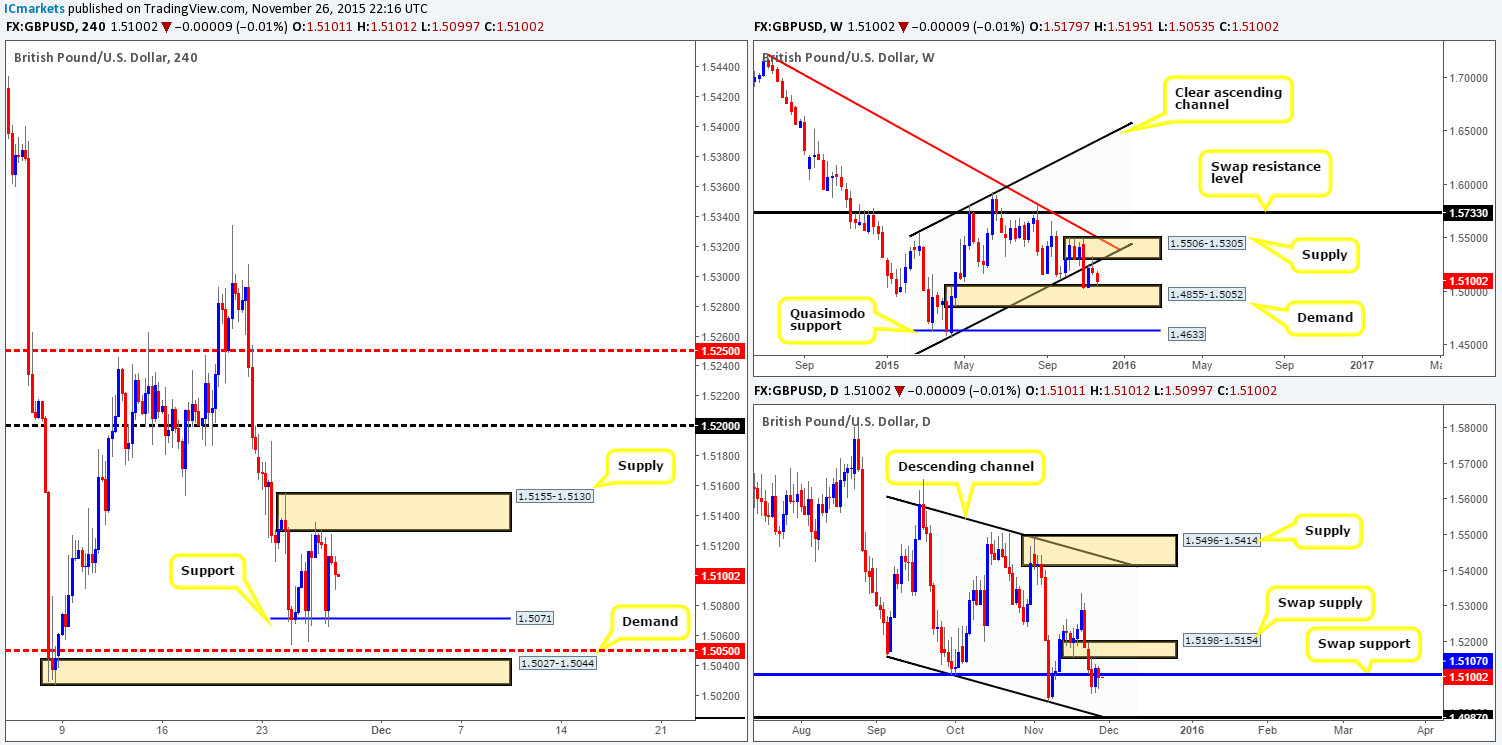
The GBP/USD pair, at least from where we’re standing, appears to be currently carving out a consolation zone between supply seen at 1.5155-1.5130 and support coming in from 1.5071. Before we decide on which levels to focus on today, let’s see how the land lies on the higher timeframe picture…
Up on the weekly chart, price remains holding above weekly demand at 1.4855-1.5052. Daily action on the other hand appears to be whipsawing around a swap support drawn from 1.5107. Directly above this level, lurks a swap supply at 1.5198-1.5154, and below it channel support is seen extended from the low 1.5162.
Seeing as how weekly action is trading from demand right now, and there is some room seen on the daily chart for price to appreciate, we’re going to be watching the above said H4 support at 1.5071 for confirmed longs today. Additionally, if this level breaks, we’ll then be eyeing both mid-level support at 1.5050, followed closely by demand at 1.5027-1.5044 for confirmed buying opportunities.
The reason for requiring confirmation here even when weekly demand is present is simply because we’re unsure as to which of the H4 levels will see a reaction, if any.
Levels to watch/ live orders:
- Buys: 1.5071 [Tentative – confirmation required] (Stop loss: dependent on where one confirms this level) 1.5050/1.5027-1.5044 [Tentative – confirmation required] (Stop loss: dependent on where one confirms these areas).
- Sells: Flat (Stop loss: N/A).
AUD/USD:
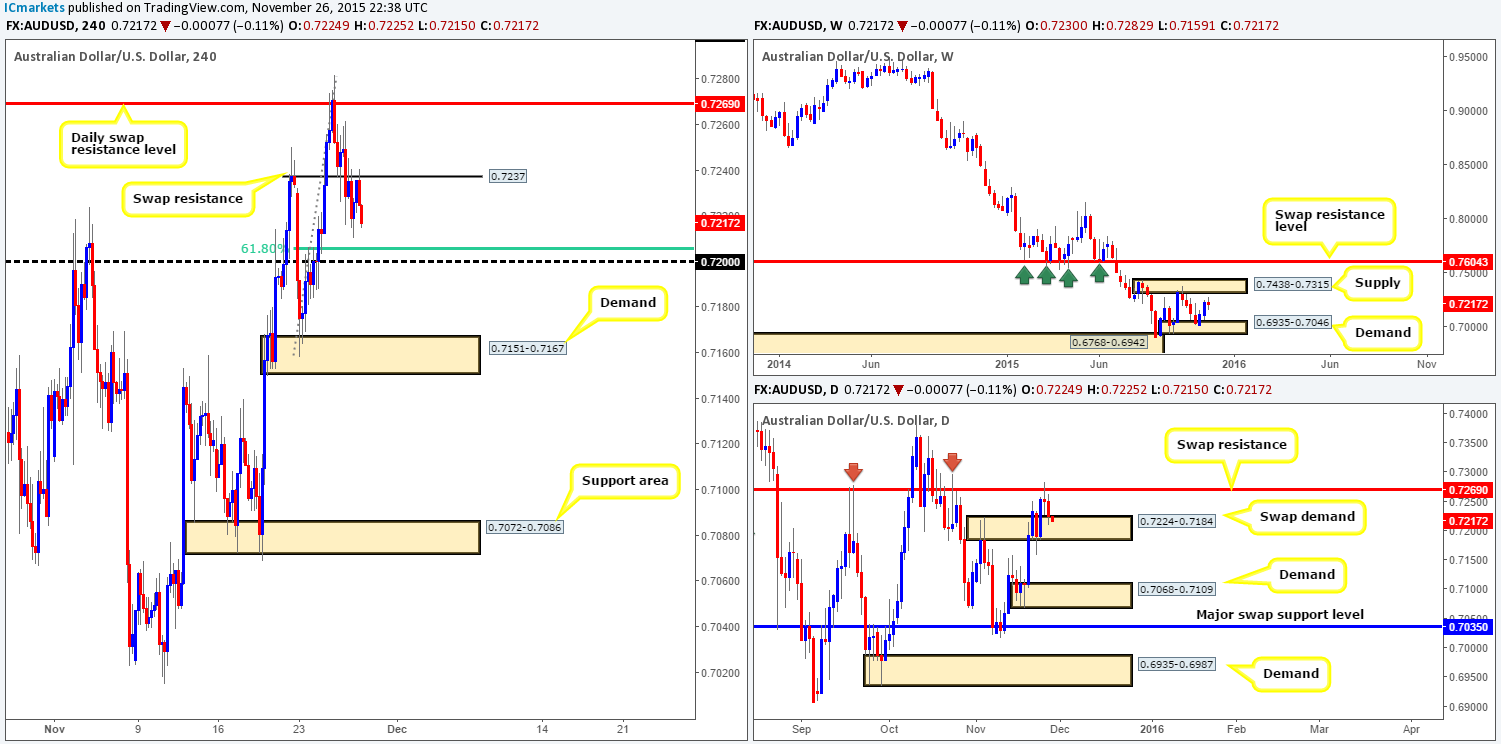
As can be seen from the H4 chart, swap support at 0.7237 gave way and was shortly after retested as resistance, consequently pushing price down to lows of 0.7210 on the day.
Given that psychological support 0.7200, and the widely respected 61.8% Fibonacci level at 0.7206 is sitting just below current prices at the moment, would we consider this a stable platform to go long from today? Yes we would and here’s why…
- There is room to appreciate on the weekly chart up to supply coming in at 0.7438-0.7315.
- Trade on the daily timeframe is currently kissing the top-side of a swap demand base at 0.7224-0.7184.
- Thursday’s low 0.7210 is likely where a ton of traders are interested in going long today, and their stops placed just below. This, as a result, could tempt well-funded traders to fake this low into the 0.7200 region.
We believe the reason for not looking to short the swap resistance at 0.7237 is self-explanatory – see point two above.
Levels to watch/ live orders:
- Buys: 0.7200 [Tentative – confirmation required] (Stop loss: dependent on where one confirms this level) Sells:Flat (Stop loss: N/A).
USD/JPY:
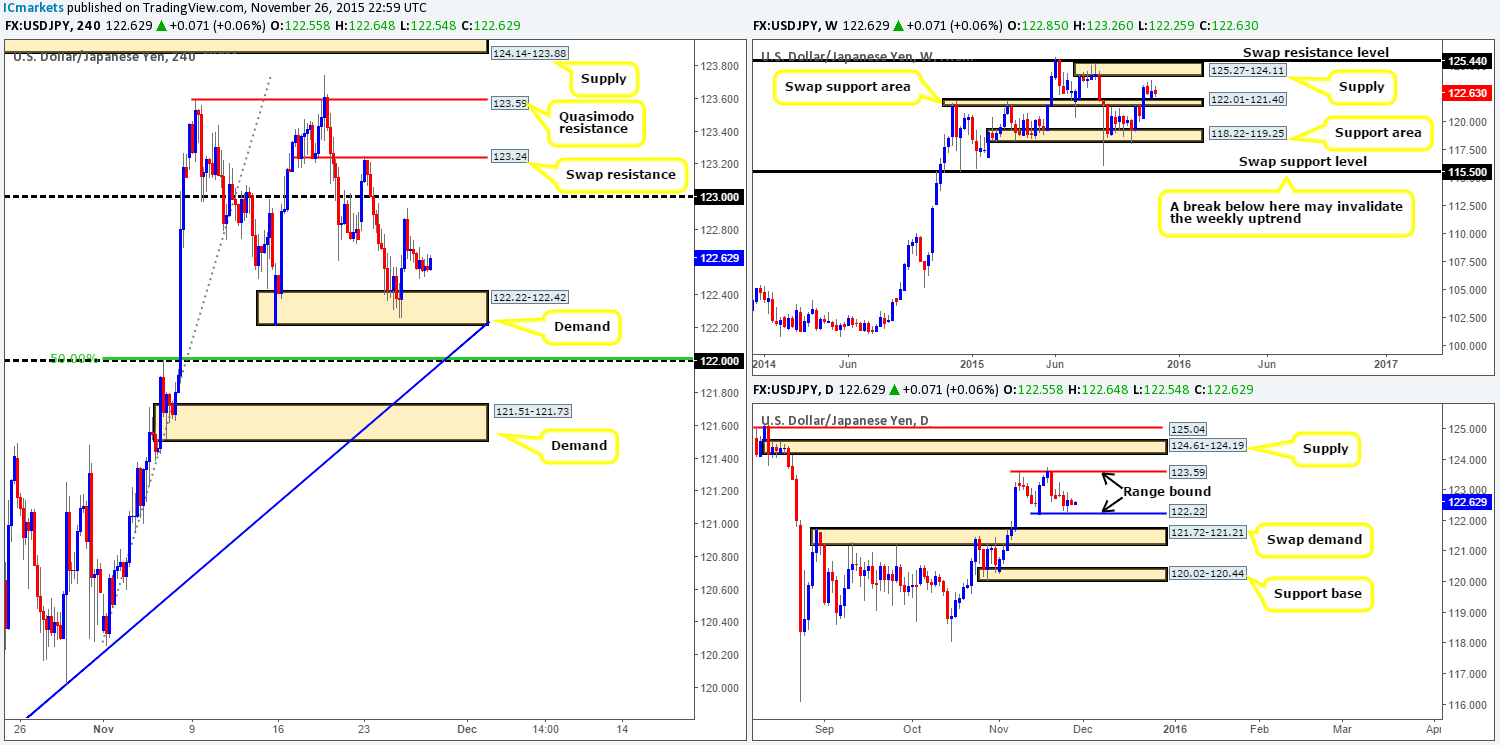
Trade on this pair was clearly very thin during yesterday’s sessions due to the U.S. being on vacation. Price was confined within a twenty-pip range recording a daily high of 122.73 and low of 122.50. Consequent to this lackluster performance, much of our following analysis will be similar to the previous.
Beginning with the weekly timeframe this morning, price continues to loiter between a swap support area at 122.01-121.40 and a supply area seen at 125.27-124.11. Down on the daily timeframe, however, we can see that price has begun to carve out a consolidation zone fixed between 123.59/122.22.
With little change seen on the H4, market action remains hovering above demand seen at 122.22-122.42. Now, given this and the position of price on both the weekly and daily timeframes, here’s what we have noted for today’s upcoming trade…
Demand at 122.22-122.42 could potentially see another bounce higher, but what we’re really interested in right now is psychological support below it at 122.00. The reason for why is not only does this beauty line up perfectly with the top-side of the aforementioned weekly swap (support) area, it also boasts 50.0% Fibonacci support at 122.01 and trendline support taken from the low 119.61.
Levels to watch/ live orders:
- Buys: 122.00 [Tentative – confirmation required] (Stop loss: dependent on where one confirms this level).
- Sells: Flat (Stop loss: N/A).
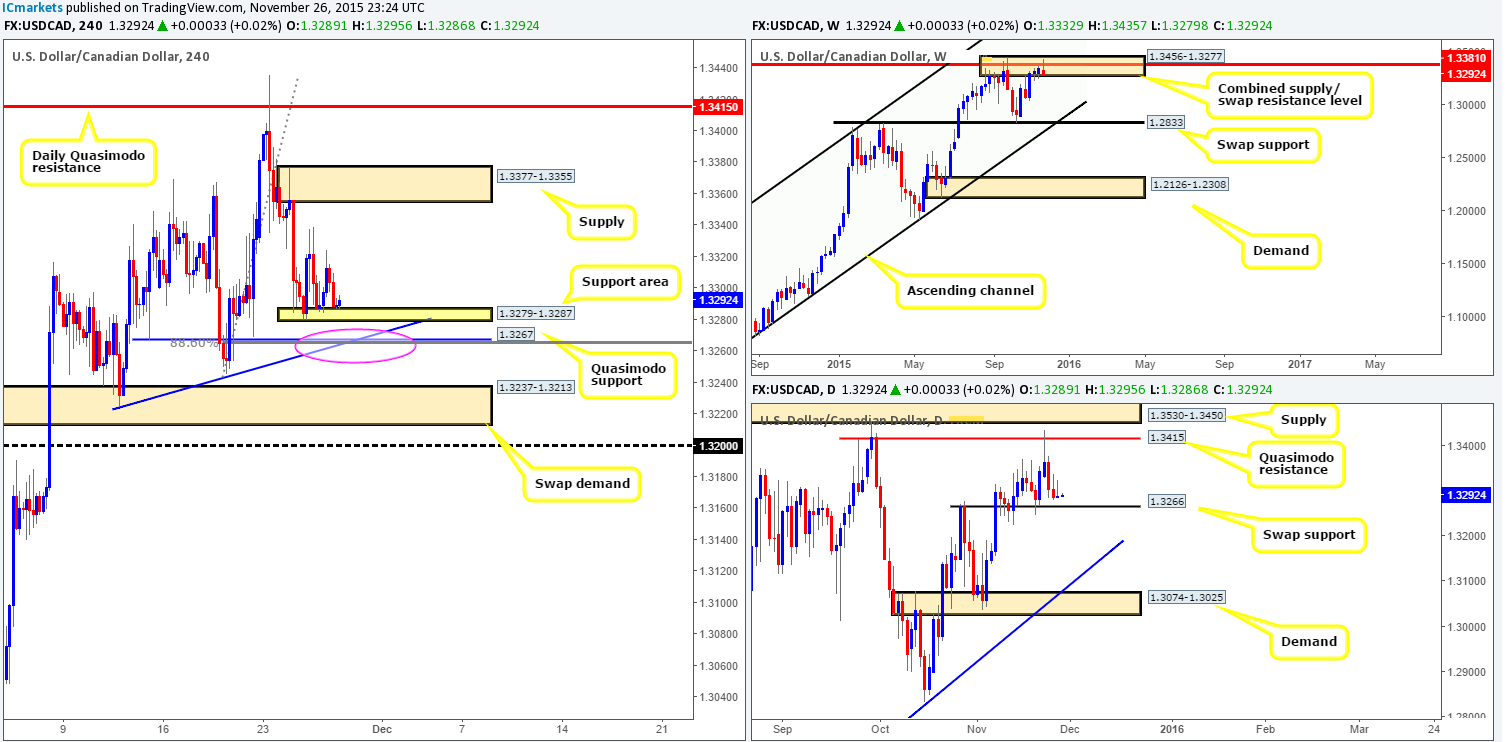
USD/CAD:
Recent action shows that the buy-side of this market continues to build a supportive base (yellow box) between 1.3279/1.3287, which has been holding strong since Tuesday. However, it is not this area we’re interested in, it is the Quasimodo support seen below it drawn from 1.3267. The reasons for why are as follows:
- Yesterday’s reaction to the current support area only managed to reach a high of 1.3324, falling fifteen pips short of Wednesday’s high 1.3339, thus indicating potential weakness from the bulls here.
- The Quasimodo support below it, however, boasts not only 88.6% Fibonacci support at 1.3265 and trendline support taken from the low 1.3224, it also sits directly on top of a daily swap support level at 1.3266.
The only drawback we see to a trade from this Quasimodo level is the fact that weekly action is currently rebounding from a combined supply/swap resistance area at 1.3456-1.3277/1.3381. Therefore, we would strongly advise only trading this barrier if one is able to spot a lower timeframe setup to enter long.
Levels to watch/ live orders:
- Buys: 1.3267 [Tentative – confirmation required] (Stop loss: dependent on where one confirms this level).
- Sells: Flat (Stop loss: N/A).
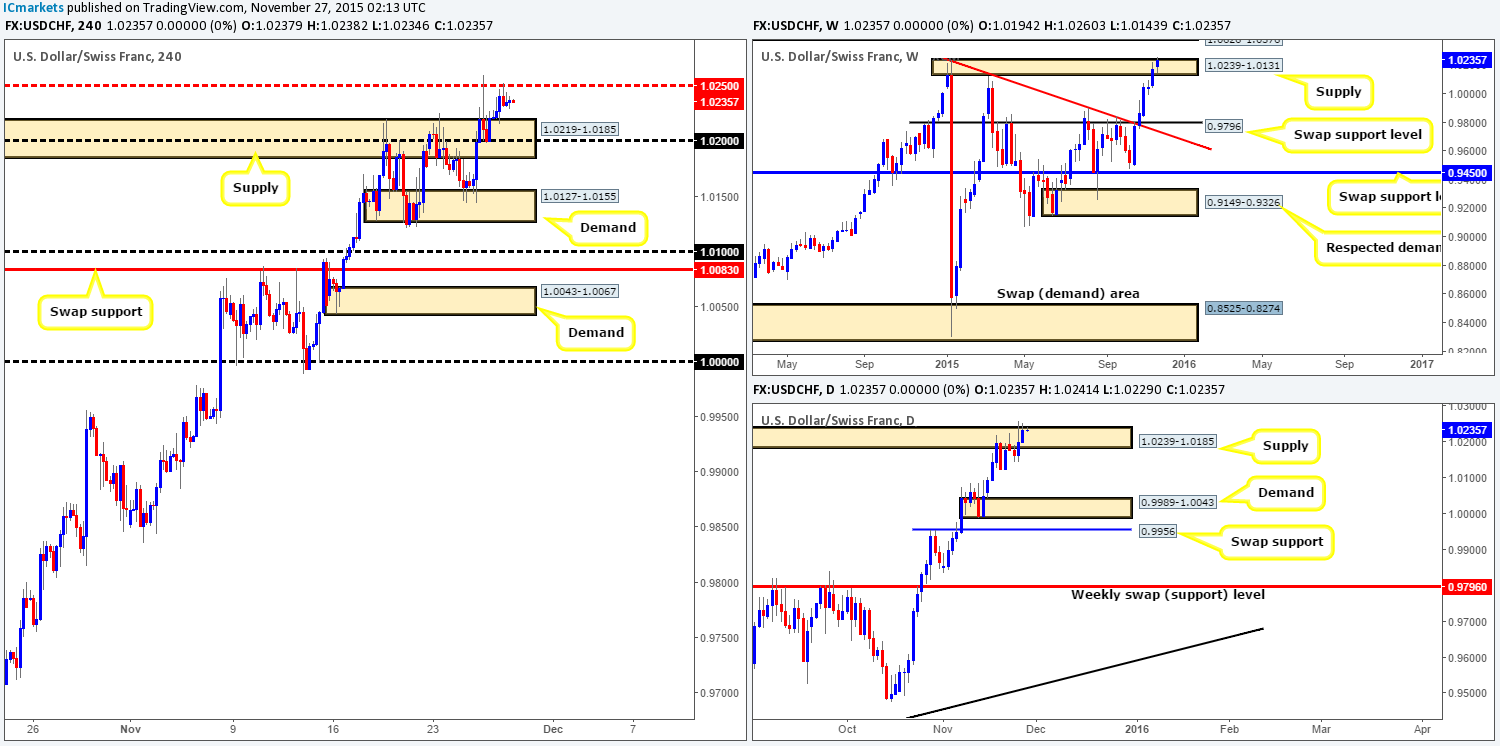
USD/CHF:
For those who read our previous report on the Swissy pair (http://www.icmarkets.com/blog/thursday-26th-november-daily-technical-outlook-and-review-u-s-bank-holiday/), you may recall that we mentioned to keep an eye out for a possible confirmed long from 1.0200. As you can see, price did indeed continue rallying from this number, reaching mid-level resistance 1.0250 before stabilizing for the remainder of the trading day. Well done to any of our readers who managed to lock in some green pips from this move.
Taking into account that both the weekly supply at 1.0239-1.0131 and its partner supply on the daily timeframe at 1.0239-1.0185 have likely been weakened from Wednesday’s spike higher, we have little interest in shorting from 1.0250 today. As a matter of fact, we are looking for this number to be taken out today! This would, in effect, be our cue to begin watching for price to retest this barrier as support, and dependent on how the lower timeframe action behaves here, we may consider a long.
Should the above come to fruition, we’ll be eyeing psychological resistance 1.0300 first and foremost. However, since both weekly and daily supply would likely be consumed at that point, one could leave some of their position running for the next higher timeframe targets – underside of weekly supply at 1.0626-1.0376/daily swap (resistance) level at 1.0388 (positioned just within the above said the weekly supply).
Levels to watch/ live orders:
- Buys: Watch for offers to be consumed around 1.0250 and then look to trade any retest seen at this level (confirmation required).
- Sells: Flat (Stop loss: N/A).
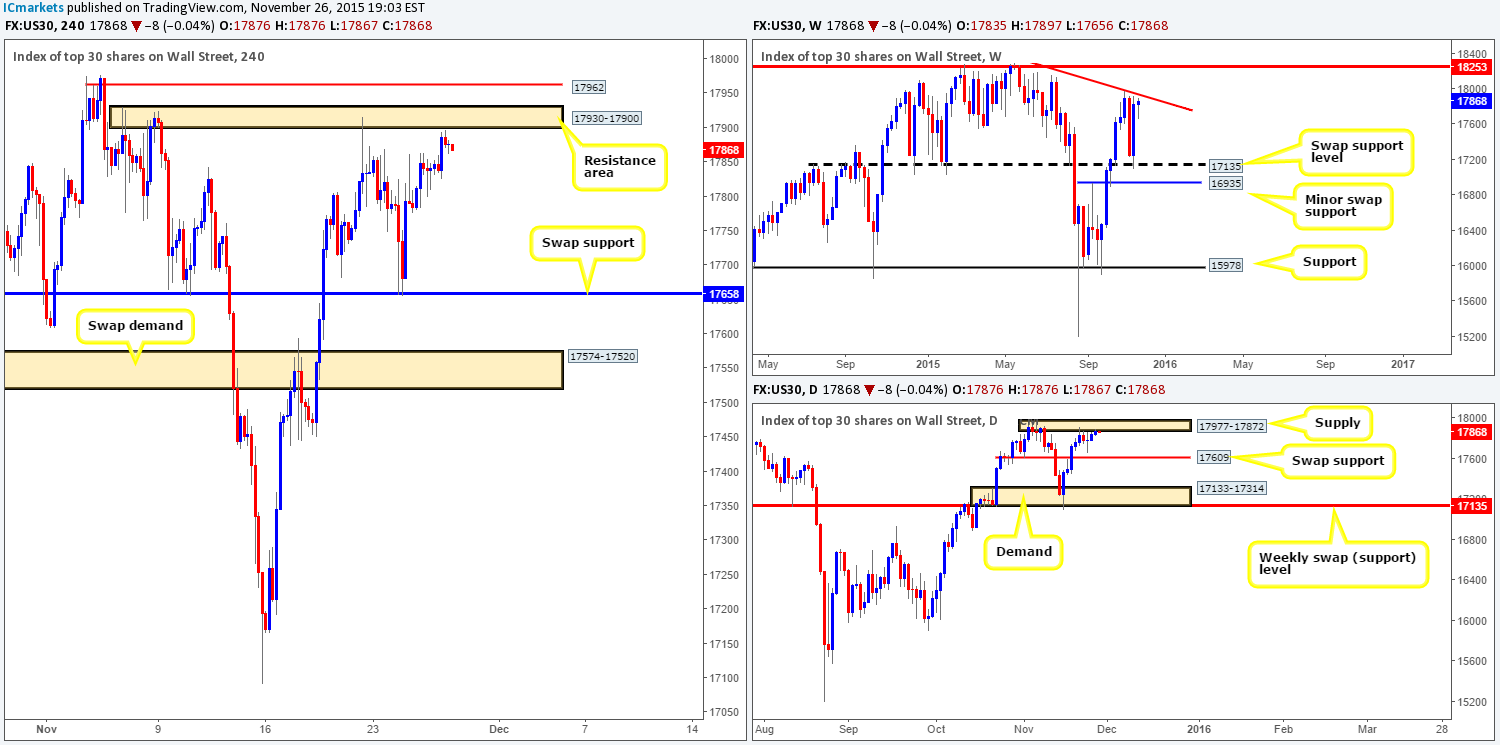
DOW 30:
As the DOW entered into yesterday’s London session price rallied higher, just missing the H4 resistance area at 17930-17900 by a mere three points, before slightly selling off into the day’s close 17876.
Seeing as price is still trading relatively close to this zone, would we consider this to be a stable enough barrier to short from today if price reaches this high? In short, yes we do. Our reasoning lies within the higher timeframe structure. Weekly action remains trading around the underside of a trendline resistance extended from the high 18365, whilst down on the daily timeframe the buyers and sellers continue to battle for position beneath supply coming in at 17977-17872. However, we will not be placing a pending sell order here due to this zone being relatively small and thus prone to a possible fakeout up to the Quasimodo resistance level coming in at 17962 (also a level to have noted on your watch list for a possible confirmed short today).
Levels to watch/ live orders:
- Buys: Flat (Stop loss: N/A).
- Sells: 17930-17900 [Tentative – confirmation required] (Stop loss: dependent on where one confirms this area) 17962 [Tentative – confirmation required] (Stop loss: dependent on where one confirms this level).
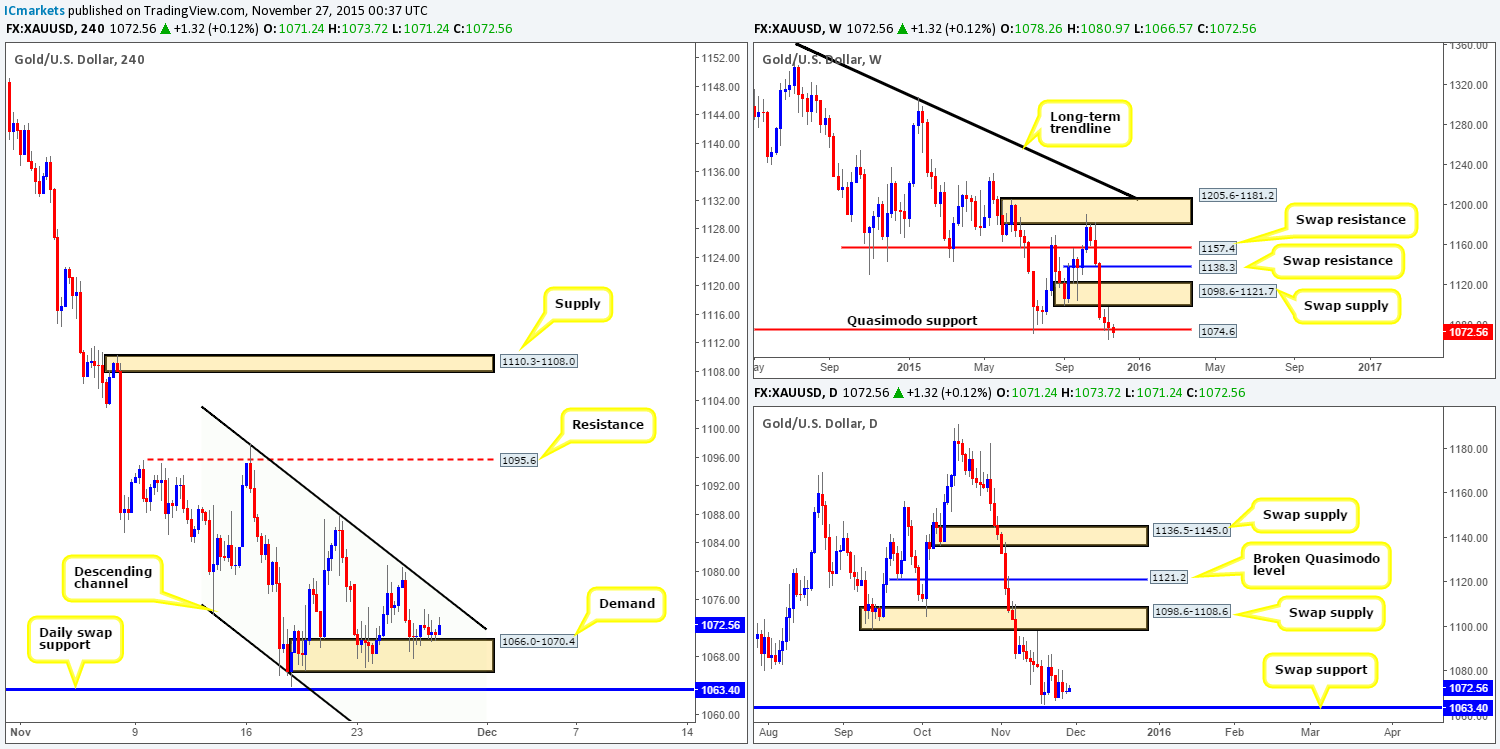
XAU/USD: (Gold)
Trading action was sluggish throughout yesterday’s sessions likely due to the U.S. being on vacation. As a result, price remained trading off of the top-side of H4 demand coming in at 1066.0-1070.4.
Do we believe this demand zone is worthy of a long trade today? For us personally, we would not feel comfortable buying from here. Reason being comes from the descending channel resistance lurking just above it extended from the high 1098.0. Furthermore, we still have our eye on the daily swap (support) level lurking below this area at 1063.4 for a potential (confirmed) long.
If we think about it logically for a minute, the sell orders below the current H4 demand area (both from traders long this demand [their stops] and traders looking to sell the break) are extremely attractive. These orders add up to a nice pool of liquidity, and coupled with the daily swap support seen just below it makes for an awesome level in which to fake into, which is why we we’ll be looking to enter long here. The reason for still requiring lower timeframe confirmation at this daily level is simply because price appears very unstable around the weekly Quasimodo support level at 1074.6 right now.
Levels to watch/live orders:
- Buys: 1063.4 [Tentative – confirmation required] (Stop loss: dependent on where one confirms this level).
- Sells: Flat (Stop loss: N/A).