Waiting for lower timeframe confirmation is our main tool to confirm strength within higher timeframe zones, and has really been the key to our trading success. It takes a little time to understand the subtle nuances, however, as each trade is never the same, but once you master the rhythm so to speak, you will be saved from countless unnecessary losing trades. The following is a list of what we look for:
- A break/retest of supply or demand dependent on which way you’re trading.
- A trendline break/retest.
- Buying/selling tails/wicks – essentially we look for a cluster of very obvious spikes off of lower timeframe support and resistance levels within the higher timeframe zone.
- Candlestick patterns. We tend to stick with pin bars and engulfing bars as these have proven to be the most effective.
We typically search for lower-timeframe confirmation between the M15 and H1 timeframes, since most of our higher-timeframe areas begin with the H4. Stops are usually placed 1-3 pips beyond confirming structures.
EUR/USD:
Weekly gain/loss: + 276 pips
Weekly closing price: 1.1207
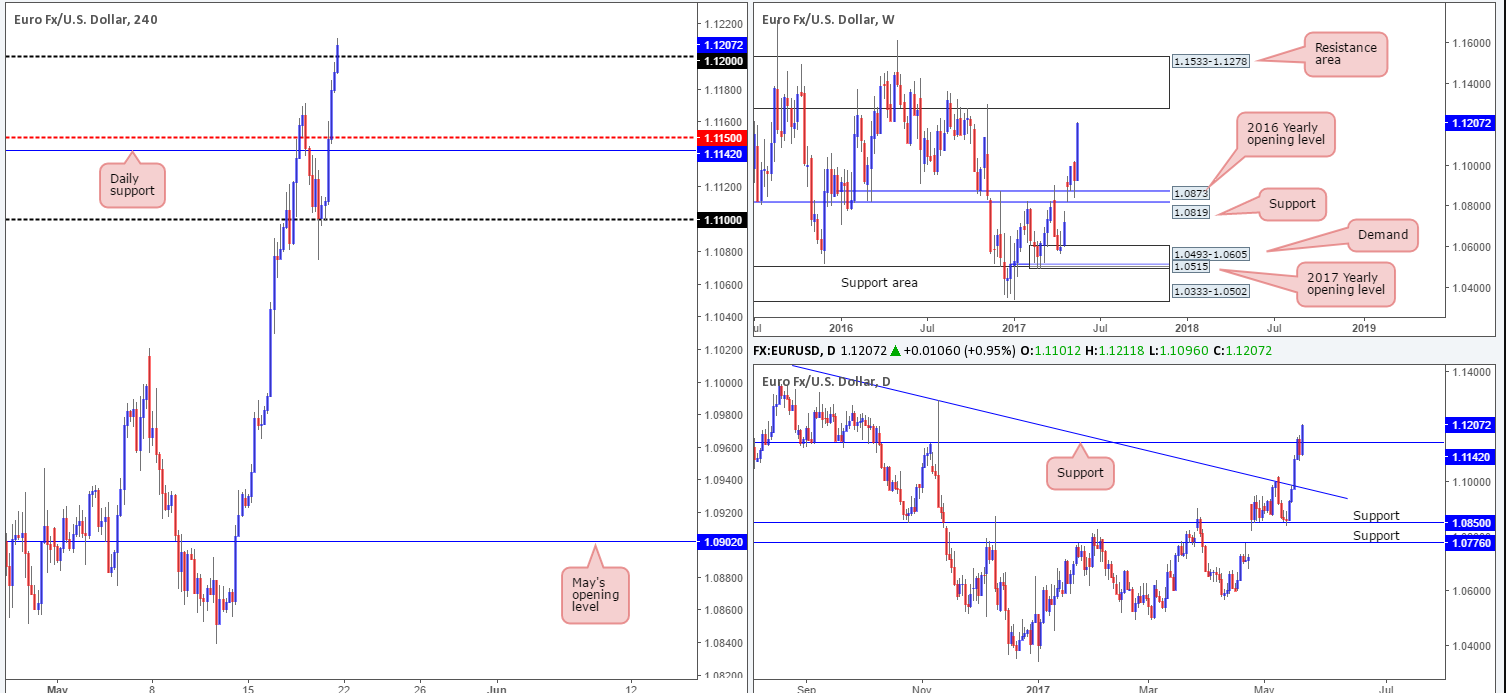
Across the board, the US dollar index plummeted last week, which, given its strong inverse correlation to the EUR/USD, helped the pair print hefty gains into the week’s close. As can be seen from the weekly chart, price is currently lurking within striking distance of a major resistance area at 1.1533-1.1278. This base has capped upside on several occasions since mid-2015, so there’s a healthy chance that history may repeat itself here!
Along similar lines, daily price recently crossed back above resistance at 1.1142 and ended the week forming a near-full-bodied bullish candle. Technically speaking, we see very little resistance on this scale until the unit connects with the said weekly resistance area.
A quick recap of Friday’s movements on the H4 chart shows that the unit concluded the day marginally closing above the 1.12 handle, reaching a high of 1.1211. Above 1.12 the pathway appears relatively free up to resistance pegged at 1.1279, followed closely by the 1.13 handle.
Our suggestions: In view of the higher-timeframe picture, additional upside in this market is probable. With that in mind, and assuming H4 price remains above 1.12 at the open, a long trade on any retest seen at this psychological number could be an option, targeting the aforementioned H4 resistance line. Ideally, however, we would also like to see a reasonably sized H4 bull candle (preferably a full-bodied candle) take shape following the retest. This, for us, helps confirm buyer interest.
Data points to consider: Eurogroup meetings (all day). FOMC member Harker speaks at 3pm GMT+1.
Levels to watch/live orders:
- Buys: 1.12 region ([waiting for a H4 bullish candle to form following the retest is advised] stop loss ideally beyond the candle’s tail).
- Sells: Flat (stop loss: N/A).
GBP/USD:
Weekly gain/loss: + 151 pips
Weekly closing price: 1.3033
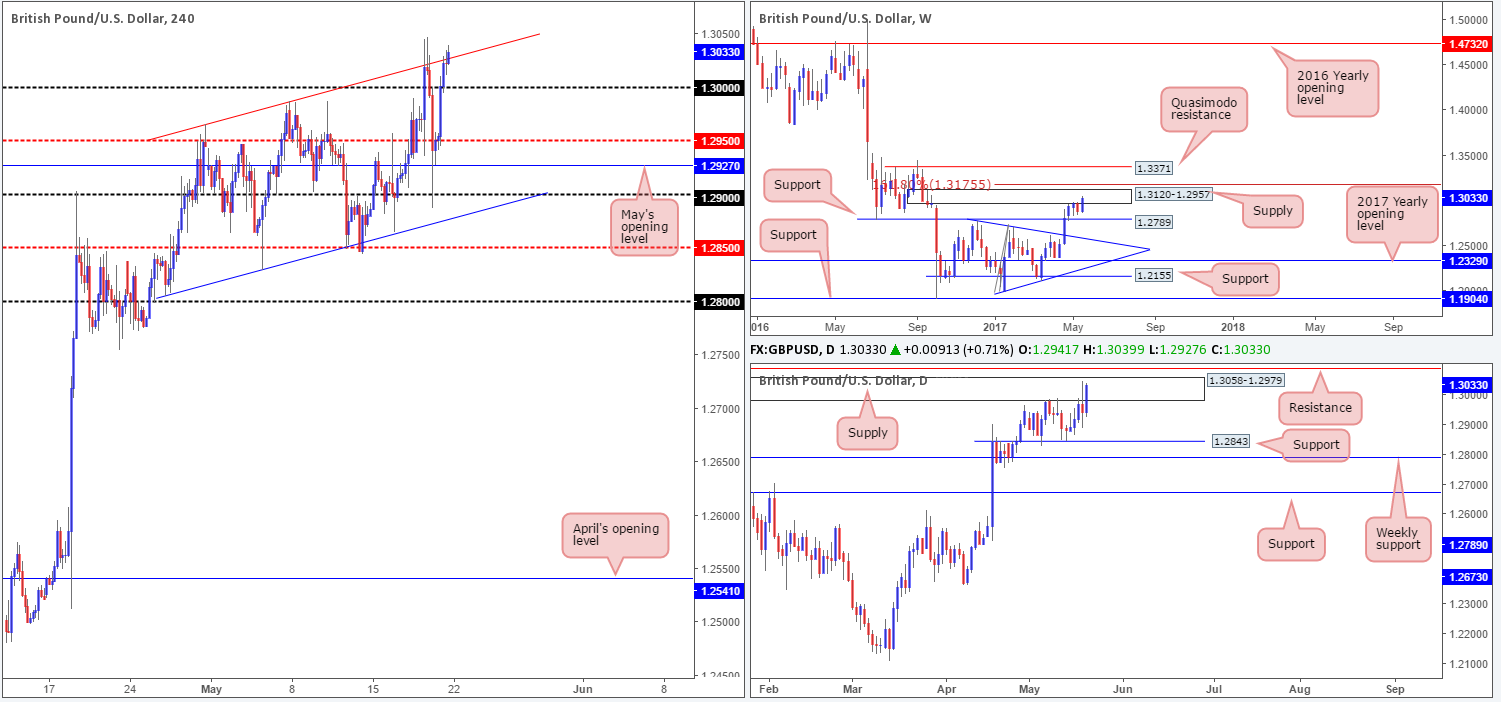
Over the last week, GBP bulls went back on the offensive after a brief pause around the underside of weekly supply coming in at 1.3120-1.2957. In the event that this supply is eventually consumed, the bulls will need to overcome the nearby 161.8% weekly Fib ext. at 1.3175 taken from the low 1.1986, before the weekly Quasimodo resistance at 1.3371 can be challenged.
Daily supply at 1.3058-1.2979, despite managing to cap upside on the 8th May, is currently under threat. Friday’s bullish candle, which happened to print a near-full-bodied candle into the close, concluded trade within the upper limits of the said supply. Also of particular interest here is the resistance at 1.3085 sitting directly above that boasts strong historical significance.
Since the beginning of May, the H4 candles have been trading within an ascending channel (low: 1.2804 high: 1.2965). In the final hours of trade on Friday, nonetheless, price poked its head above the channel resistance line and marginally closed higher. Does this mean a breakout trade could be in play? Of course, this is a possibility, but it’s not something our desk would feel comfortable trading knowing that both weekly and daily candles area trading within higher-timeframe structure.
Our suggestions: To our way of seeing things, the close above the aforementioned channel resistance is not a breakout signal, due to where price is trading on the bigger picture. Therefore, we believe the bears will drag this unit back into the channel on Monday and challenge the large psychological number 1.30. This level will be KEY in deciding direction. A rejection off this line will likely imply the bulls are going to attempt to break above the said higher-timeframe areas, and a violation of this number would likely lead to a move down to the H4 mid-level support at 1.2950, and possibly beyond.
On account of the above notes, we’re going to remain flat for now. We’ll look to assess how price action behaves when/if price tests 1.30, before making any further decisions.
Data points to consider: FOMC member Harker speaks at 3pm GMT+1.
Levels to watch/live orders:
- Buys: Flat (stop loss: N/A).
- Sells: Flat (stop loss: N/A).
AUD/USD:
Weekly gain/loss: + 71 pips
Weekly closing price: 0.7456
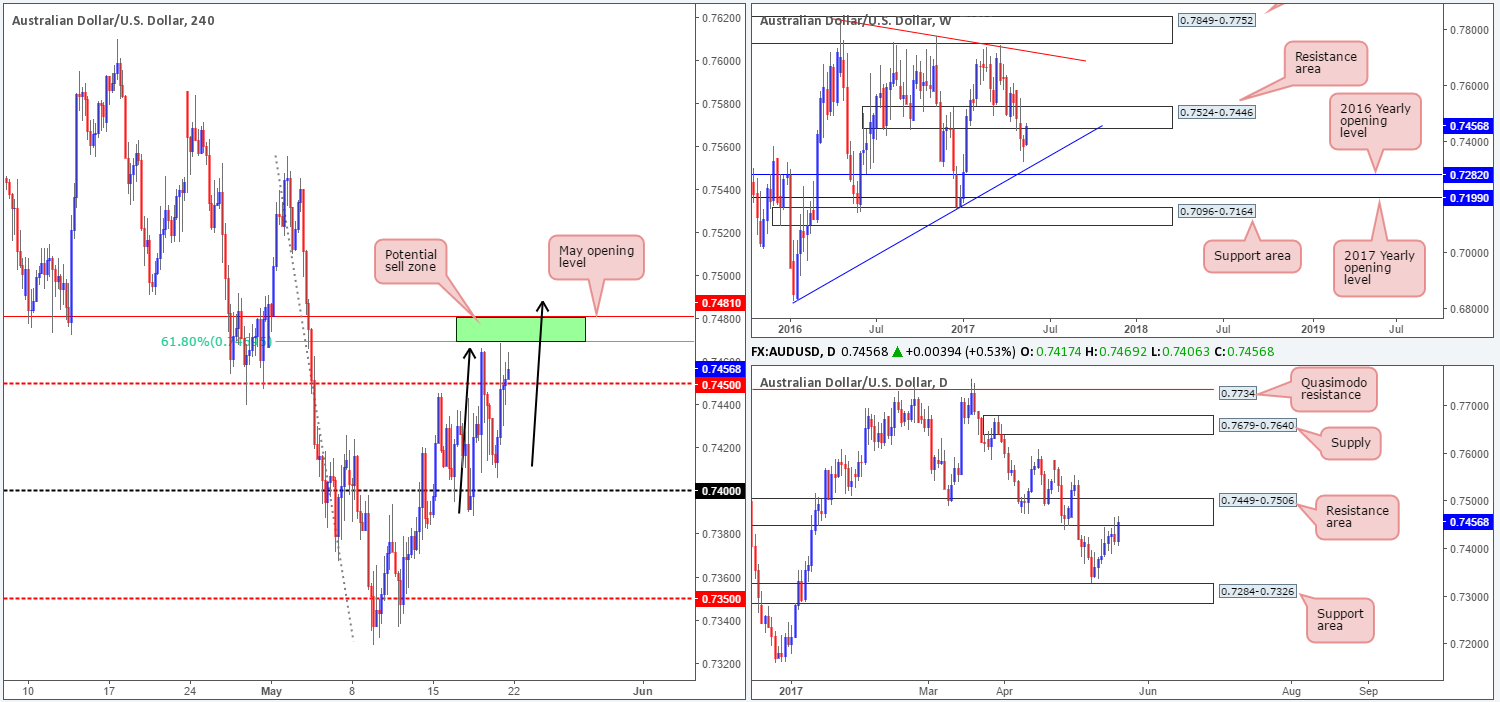
Following four weeks of downside momentum, the pair, as you can see, recovered last week and retested the underside of a weekly resistance area penciled in at 0.7524-0.7446. This structure has been in motion since mid-2016, so there’s a reasonable chance that the bears may defend this barrier in the coming week. Should this come to fruition, the next base of interest seen below is a trendline support etched from the low 0.6827.
By the same token, daily price is also seen retesting the underside of a resistance area that’s plotted within the weekly zone at 0.7449-0.7506. However, Friday’s bullish engulfing candle is, we admit, a tad concerning here.
Leaving the 0.74 handle unchallenged, H4 bulls managed to take out the mid-level resistance at 0.7450 and come within inches of connecting with the underside of our pre-determined H4 sell zone (comprised of May’s opening level at 0.7481 and a H4 61.8% Fib resistance at 0.7470 taken from the high 0.7556 [green zone]).
Our suggestions: Depending on where the market opens on Monday, our prime focus, for now, remains around the 0.7481/0.7470 neighborhood. Not only because this H4 sell zone is encapsulated within higher-timeframe structure, but also due to the market’s overall trend facing south. And this, in our view, leads us to believe that the recent bullish move on the Aussie could, quite simply, be nothing more than a pullback.
However, as highlighted in Friday’s report, one should expect a fakeout above this H4 zone to take place. The reason for why simply comes down to the potential H4 AB=CD approach taken from the low 0.7388 (see black arrows) terminating beyond the area.
Data points to consider: RBA Assist Gov. Debelle speaks at 6.30pm. FOMC member Harker speaks at 3pm GMT+1.
Levels to watch/live orders:
- Buys: Flat (stop loss: N/A).
- Sells: 0.7481/0.7470 ([waiting for a reasonably sized H4 bear candle, preferably a full-bodied candle, to form before pulling the trigger is advised] stop loss: ideally beyond the candle’s wick).
USD/JPY:
Weekly gain/loss: – 207 pips
Weekly closing price: 111.26
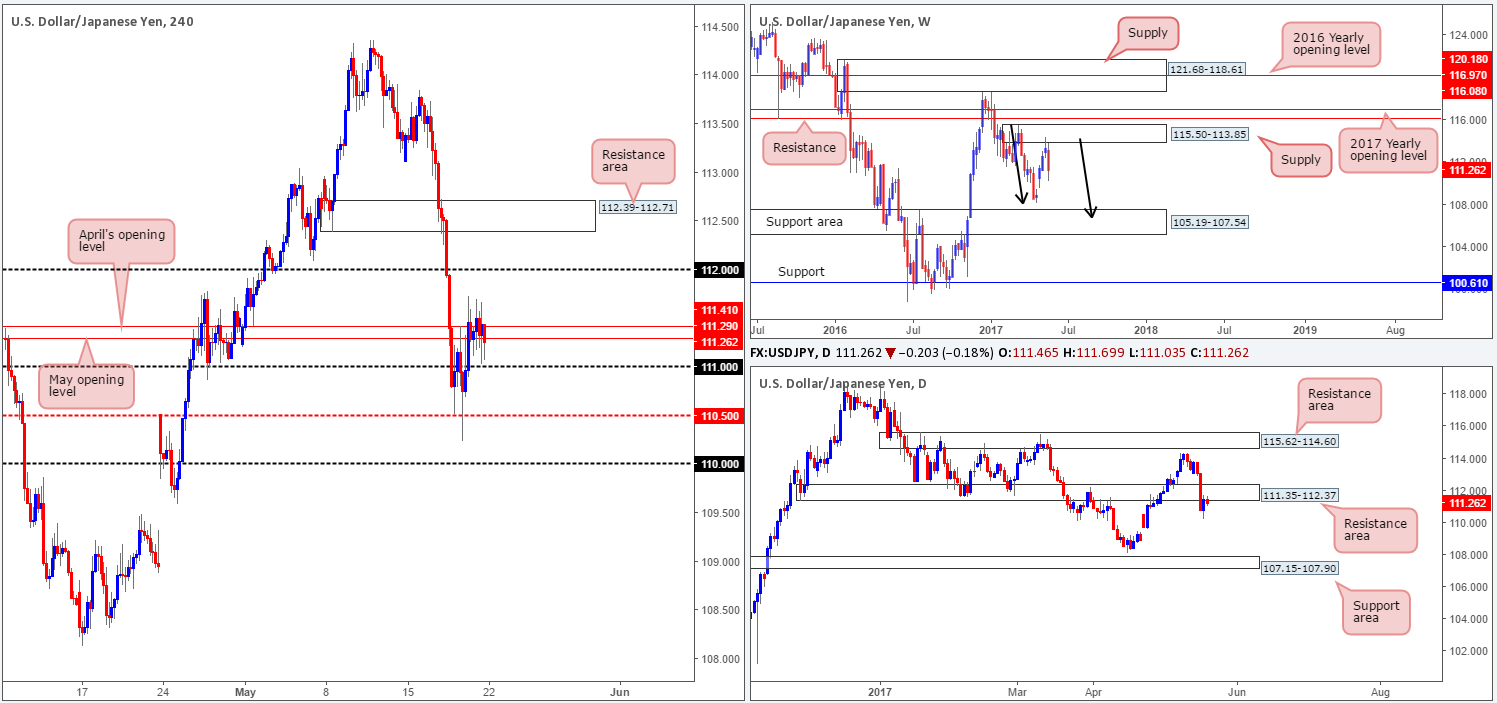
After an impressive rejection off weekly supply at 115.50-113.85 two weeks back, the bears further stamped in their authority last week, reaching a low of 110.23. We know there’s a lot of ground to cover, but this rejection and follow-through move could be the beginnings of further downside in the form of a weekly AB=CD correction (see black arrows) into the weekly support area marked at 105.19-107.54.
In conjunction with weekly flow, price managed to run through bids at a support area drawn from 111.35-112.37 last week, which was recently retested and has so far held as resistance. The next area on the hit list falls in at 107.15-107.90: a support zone that’s glued to the top edge of the said weekly support area.
A brief look at recent dealings on the H4 chart shows that price took on more of a sober approach on Friday, vacillating around April/May’s opening levels at 111.41/111.29. As you can see, directly below current price sits the 111 handle, whereas to the upside we see that we have the 112 handle in sight.
Our suggestions: While both the weekly and daily charts indicate further selling could be on the cards this coming week, we would not feel comfortable shorting into bids at 111. We would, however, consider a sell on a close below 111, as this likely clears the pathway south down to at least the H4 mid-level support at 110.50.
110.50, in our opinion, provides a decent level to lock in some profits and reduce risk to breakeven. However, according to the higher-timeframe structure, price could potentially drive much lower than 110.50, so best to leave some on the table to take advantage of this!
Data points to consider: FOMC member Harker speaks at 3pm GMT+1.
Levels to watch/live orders:
- Buys: Flat (stop loss: N/A).
- Sells: Watch for H4 price engulf 111 and then look to pull the sell trigger (stop loss: ideally beyond the candle’s wick).
USD/CAD:
Weekly gain/loss: – 200 pips
Weekly closing price: 1.3508
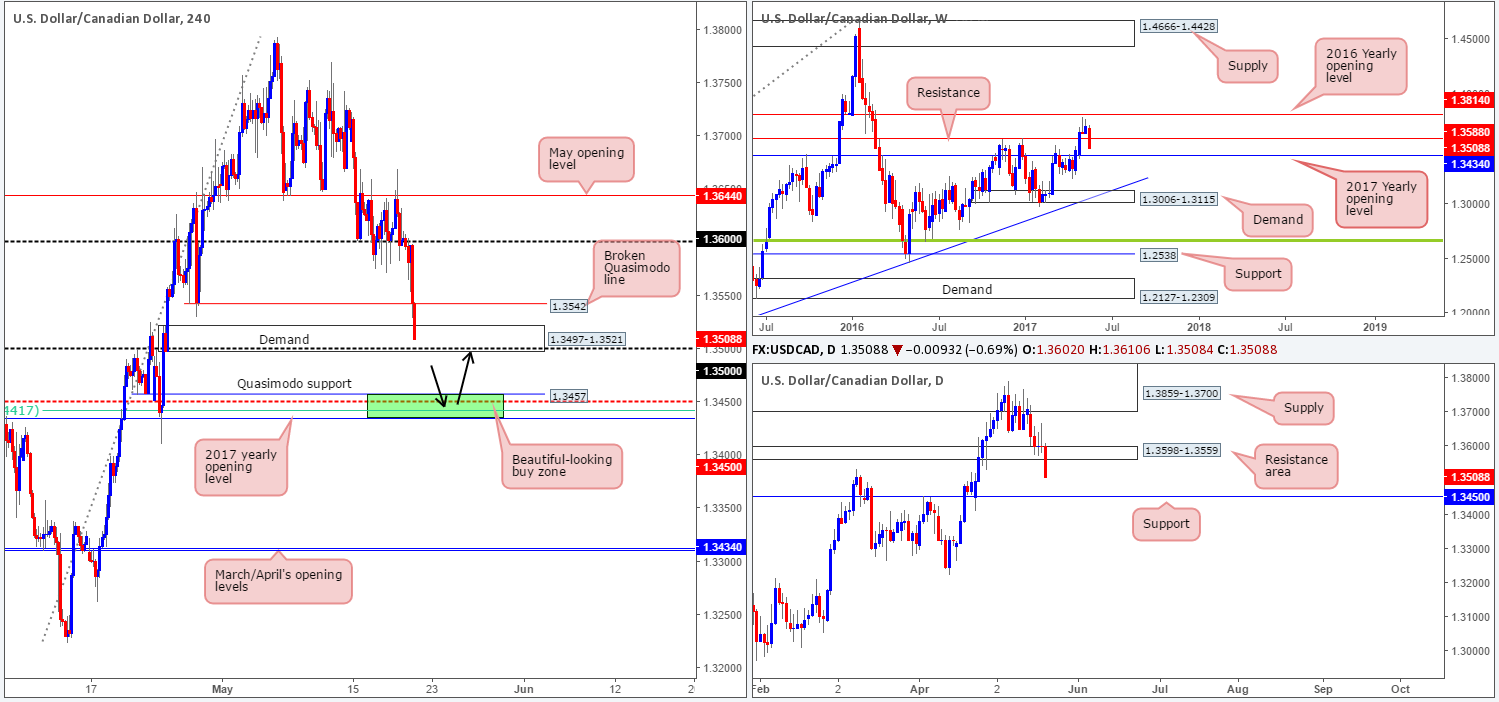
After a couple of weeks of hesitation between the 2016 yearly opening level at 1.3814 and weekly support at 1.3588, the bears managed to find their feet and push the unit lower last week. Shaped in the form of a full-bodied bearish candle, the pair is now within striking distance of the 2017 yearly opening level drawn from 1.3434.
Looking down to the daily candles, we can see that price held firm around the support area at 1.3598-1.3559 for the best part of last week. That was, of course, until Friday when the bears pressed lower and closed the week ahead of support at 1.3450.
Over on the H4 candles, the week ended with price closing within the walls of a demand base coming in at 1.3497-1.3521. At first glance, this zone does look somewhat attractive given that it unites with the 1.35 handle. In spite of this, however, looking a little lower down on the curve we see a far more appealing buy zone formed between 1.3434/1.3457. Comprised of a H4 Quasimodo support at 1.3457, a H4 61.8% Fib support at 1.3441 taken from the low 1.3223 (green line), a H4 mid-level support at 1.3450 which also happens to represent daily support and the 2017 yearly opening level seen on the weekly chart at 1.3434.
Our suggestions: Given the confluence surrounding 1.3434/1.3457, our team will look to place a pending buy order around the top edge of this zone when the market opens for business. Our stop will be conservatively set just beyond the 24th April low at 1.3410 around 1.3408. Ultimately, the first take-profit zone is going to be somewhere nearby the 1.35 neighborhood.
Data points to consider: FOMC member Harker speaks at 3pm GMT+1.
Levels to watch/live orders:
- Buys: 1.3457 ([pending order] stop loss: 1.3408).
- Sells: Flat (stop loss: N/A).
USD/CHF:
Weekly gain/loss: – 281 pips
Weekly closing price: 0.9727
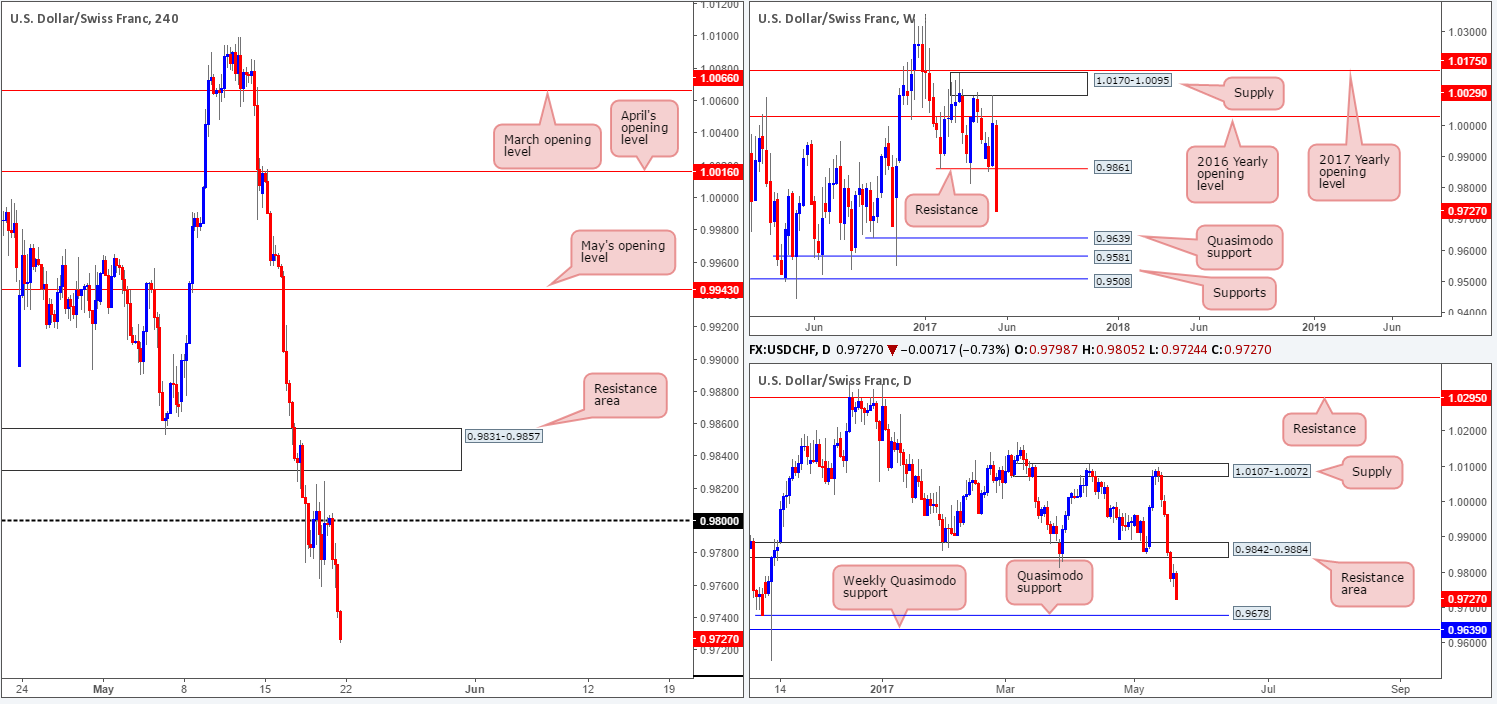
The CHF made considerable ground against the US dollar last week, with the USD/CHF closing in the shape of a strong-looking full-bodied bearish candle! Weekly support at 0.9861 was aggressively consumed, leaving the weekly Quasimodo support at 0.9639 in view.
Sliding down to the daily timeframe, we can see the support area at 0.9842-0.9884, which happens to hold the weekly support level mentioned above within, was taken out on Wednesday. In our estimation, this has placed the daily Quasimodo support at 0.9678 on the hit list, followed closely by the above noted weekly Quasimodo support.
For those who read Friday’s report you may recall that our desk highlighted the possibility of selling from 0.98 if a reasonably sized H4 bearish candle took shape from here. As you can see, going into the early hours of London this occurred and price continued to decline in value for the remainder of the day! Well done to any of our readers who managed to jump aboard this move as price clocked a healthy low of 0.9724 on the day.
Our suggestions: With the H4 candles lurking within shouting distance of the 0.97 handle, we would be very cautious taking shorts in this market. The reason being is not only is 0.97 a watched number by the majority of traders, it also sits a little over 20 pips above the said daily Quasimodo support, which as we already know, is located just above the aforementioned weekly Quasimodo support.
So, with the above notes in mind, we may, should a H4 bullish candle (preferably a full-bodied candle) take shape between 0.9678/0.97 today/this week, look to go long from here and target the 0.98 hurdle. The reason for requiring this confirming candle is simply to avoid being faked on a push down to the weekly Quasimodo support.
Data points to consider: FOMC member Harker speaks at 3pm GMT+1.
Levels to watch/live orders:
- Buys: 0.9678/0.97 region ([waiting for a reasonably sized H4 bull candle, preferably a full-bodied candle, to form before pulling the trigger is advised] stop loss: ideally beyond the candle’s tail).
- Sells: Flat (stop loss: N/A).
DOW 30:
Weekly gain/loss: – 75 points
Weekly closing price: 20810
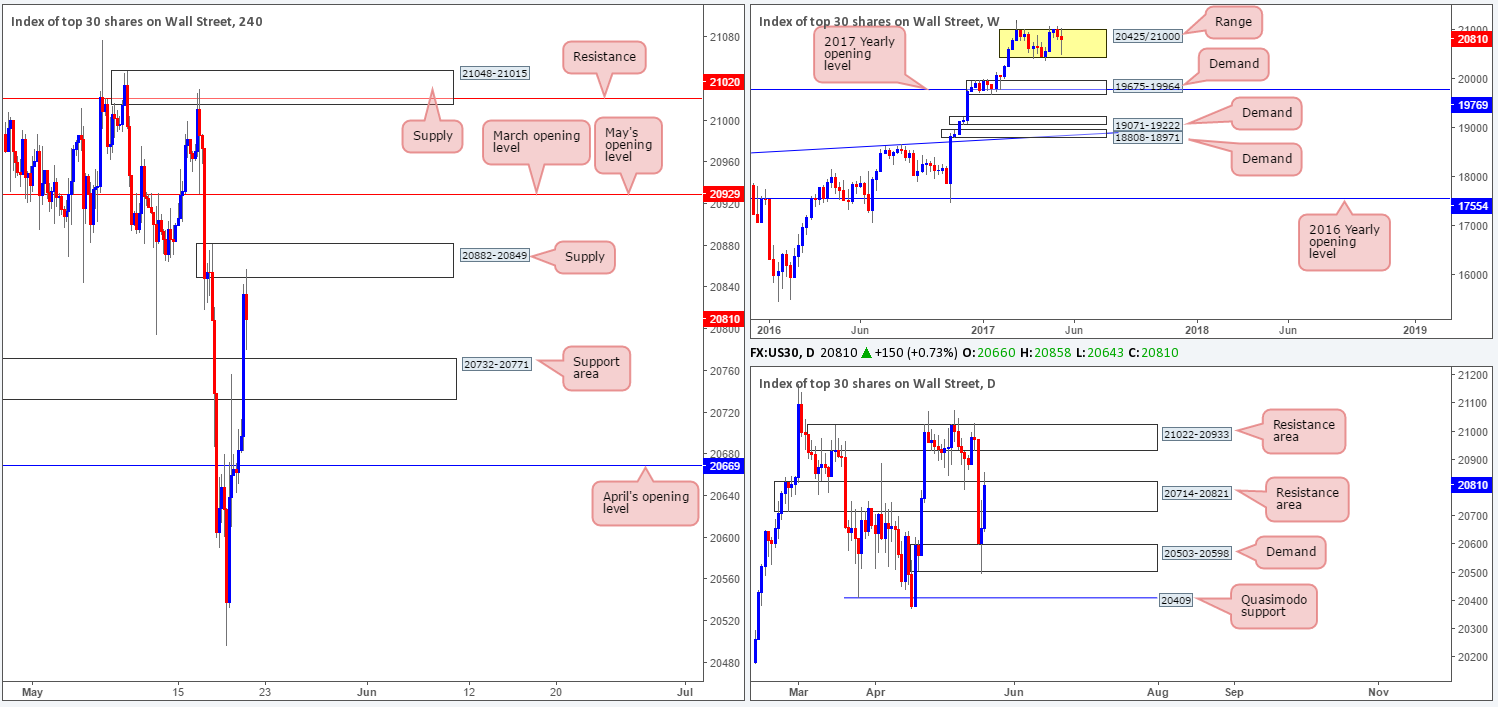
At this point, there’s not really much we see that can be gathered from the weekly timeframe. The only salient point we feel noteworthy is the index appears to be chiseling out a consolidation around record highs of 21170 between 20425/21000.
Moving down to the daily timeframe, however, we can see that the unit extended Thursday’s bounce from demand at 20503-20598 on Friday, and lifted price up to within the top edge of a resistance zone coming in at 20714-20821 by the close. Should this area fail, we don’t have far to go until we reach the next area of importance: a resistance area pegged at 21022-20933.
Jumping across to the H4 timeframe, supply at 20882-20849 was brought into the action going into the closing bell. So far this zone looks as though it will continue to hold, but the concerning point is how far can price drop from here? Technically speaking, we see little wiggle room since there’s a nearby support area marked at 20732-20771.
Our suggestions: Personally, we do not see much to hang our hat on here at the moment. Downside is limited to the said H4 support area, and upside is challenging given the current H4 supply and converging daily resistance area at 20714-20821.
Therefore, opting to stand on the sidelines for the time being may very well be the better path to take.
Data points to consider: FOMC member Harker speaks at 3pm GMT+1.
Levels to watch/live orders:
- Buys: Flat (stop loss: N/A).
- Sells: Flat (stop loss: N/A).
GOLD:
Weekly gain/loss: + $27.3
Weekly closing price: 1255.3
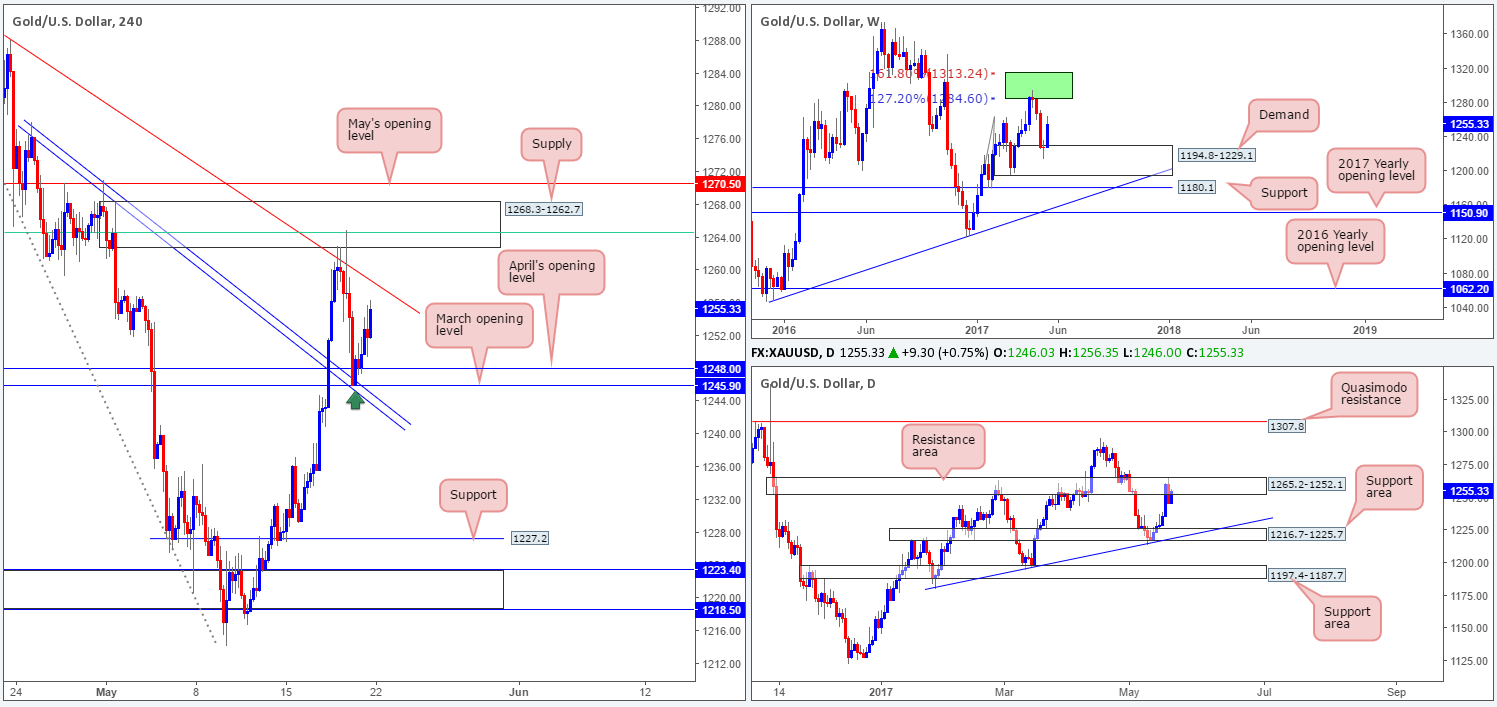
As can be seen from the weekly chart, the yellow metal aggressively recovered from demand at 1194.8-1229.1 during last week’s segment. The move broke a four-week bearish phase, and could potentially drag this market back up to the two weekly Fibonacci extensions 161.8/127.2% at 1313.7/1285.2 taken from the low 1188.1 (green zone) sometime this week.
Before the bulls can form an extension, nevertheless, offers placed around the daily resistance area drawn from 1265.2-1252.1 will need to be consumed. A decisive (daily) close beyond this zone would likely confirm further buying up to not only the 1313.7/1285.2 area seen on the weekly chart, but also quite possibly the daily Quasimodo resistance level seen at 1307.8.
For those who read Friday’s report you might remember our desk initiating a long position from 1249.2 with a stop set at 1244.9. Our rationale behind this trade was due to H4 price chalking up a reasonably sized H4 bull candle off of March/April’s opening levels at 1245.9/1248.0, which happened to merge beautifully with a H4 trendline support etched from the high 1278.0. Yes, it was a slightly risky bet given where daily price was positioned, but knowing that we had weekly bulls behind the market, we were fairly happy with our decision.
As you can see, price spent the day rallying north following our entry. Bullion is seen within striking distance of our initial take-profit target set at the H4 trendline resistance (1258.0) taken from the high 1295.4, and our stop is at breakeven. In the event that price continues to rally and surpasses the H4 trendline, we’ll be looking to liquidate the remainder of our position around the H4 61.8% Fib resistance at 1264.5 (green line) extended from the high 1295.4 seen planted within H4 supply at 1268.3-1262.7.
Our suggestions: As for potential setups going forward, we see a possible rejection being seen from the aforementioned H4 supply taking place. But given weekly flow at the moment, there’s a chance that this area may suffer a break and price may look to challenge May’s opening level at 1270.5, and perhaps beyond. Therefore, trade with caution here guys!
Levels to watch/live orders:
- Buys: 1249.2 ([live] stop loss: breakeven).
- Sells: Flat (stop loss: N/A).