EUR/USD:
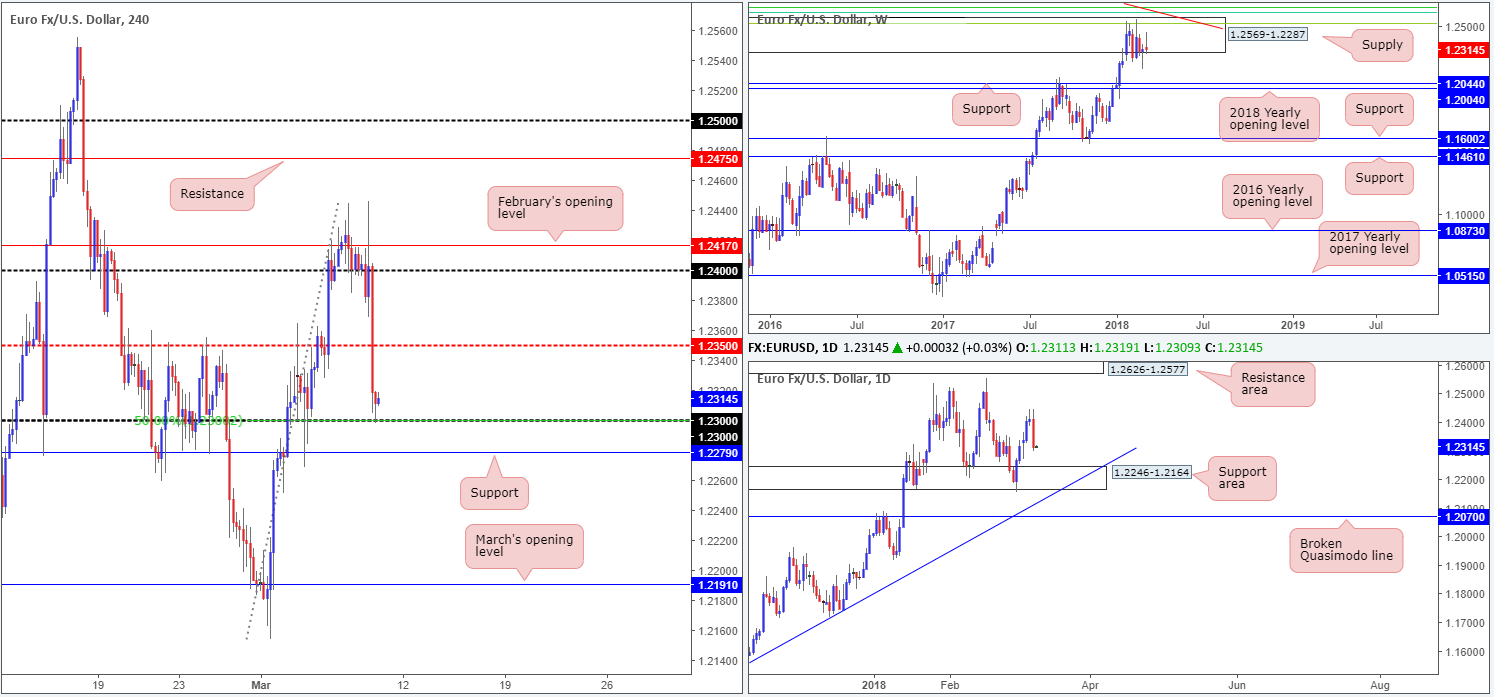
The value of the single currency weakened in aggressive fashion on Thursday, following ECB president Draghi’s dovish message in his post-meeting presser. The result was an aggressive breach of 1.24, the H4 mid-level support at 1.2350 and a minor violation of 1.23. It might also be worth noting that this move broke a five-day bullish phase!
According to the higher-timeframe structures, the nearby 1.23 handle (fuses with a 50.0% support value) and H4 support at 1.2279 may be on the verge of giving way. Weekly movement shows room to probe as far south as the weekly support at 1.2044, followed closely by the 2018 yearly opening level at 1.2004. On the daily timeframe, we can also see space to press as low as a daily support area coming in at 1.2246-1.2164.
Potential trading zones:
While the higher timeframes suggest lower prices could be on the cards, taking a sell position on the H4 timeframe is unfortunately a challenge. Not only is it difficult to short at current price due to the current supports in play, but even on a break beyond these lines we only have a little over 30 pips clearance between the top edge of the aforementioned daily support area and the underside of H4 support at 1.2279.
As you can see, this market is somewhat restricted as we head into NFP Friday. With that being the case, the team has placed this market on the back burner for the time being, at least until post NFP.
Data points to consider: US job’s data at 1.30pm GMT.
Areas worthy of attention:
Supports: 1.23 handle; 1.2246-1.2164; 1.2044/1.2004.
Resistances: 1.2350.
GBP/USD:
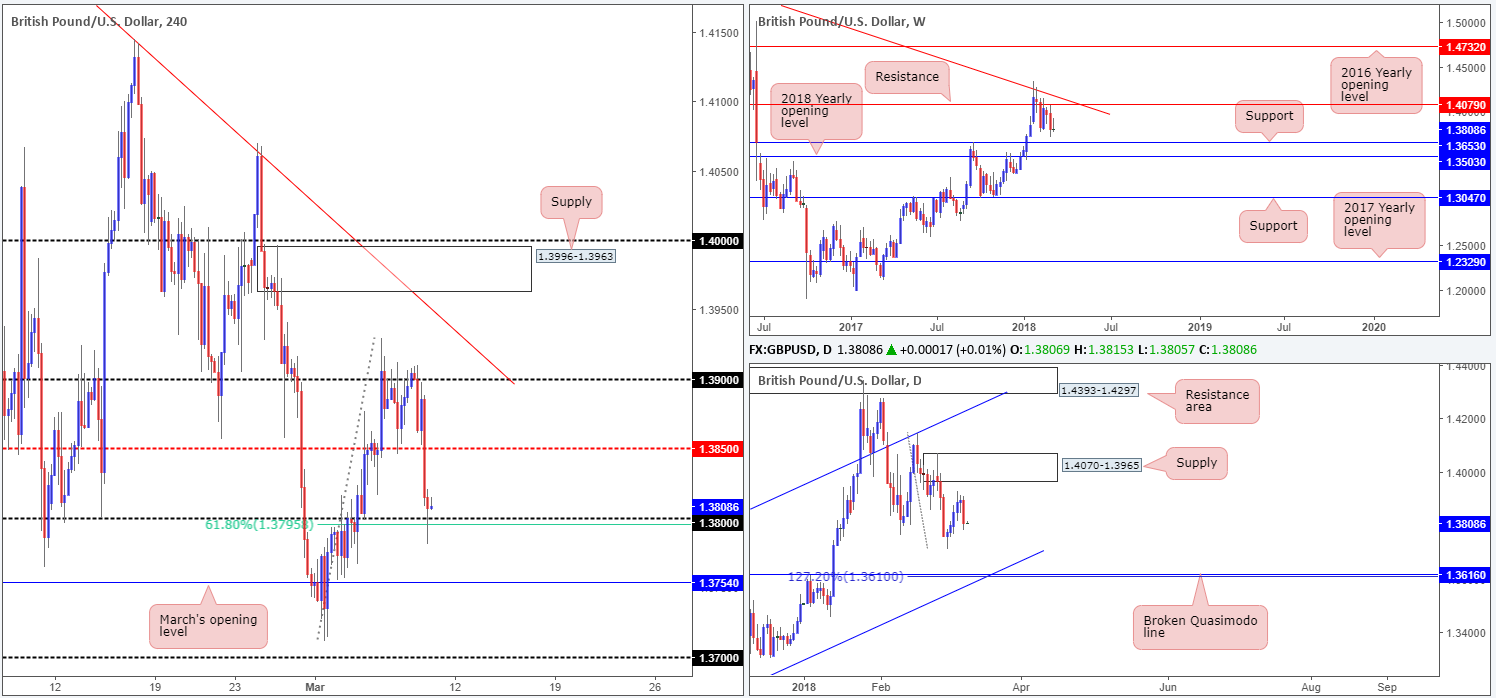
The GBP/USD stamped in a dominant daily bearish candle on Thursday in the shape of a near-full-bodied formation.
The British pound accelerated to the downside in US trade amid USD strength on Thursday, following ECB president Draghi’s dovish message in his post-meeting presser. In addition to this, there were reports saying that UK government officials don’t see a ‘Brexit’ deal being reached until next year, pushing price beyond 1.38. As you can see on the H4 chart, however, the H4 candles defended the 1.38 handle (sited nearby a 61.8% Fib support at 1.3795) going into the closing bell.
Over on the weekly chart, there’s little stopping this market from punching as low as weekly support coming in at 1.3653, followed closely by the 2018 yearly opening line at 1.3503.
Daily price – apart from potential support emanating from the 01/03 low at 1.3711 – shows room to decline down to a daily broken Quasimodo line at 1.3616, which happens to fuse beautifully with a 127.2% daily Fib ext. point at 1.3610.
Potential trading zones:
Short covering will likely continue to bolster H4 action from 1.38, and may even pull the unit up to the 1.3850ish neighborhood today. However, overall direction, according to the bigger picture, remains in a southerly wind.
Should H4 movement close beneath 1.38 and not challenge March’s opening level at 1.3754 (intraday downside target), looking to trade the retest of this number could be an option. Do keep in mind, though, traders that we have high-impacting UK and US news on the docket today, which can disrupt technical setups!
Data points to consider: UK manufacturing production m/m and Goods trade balance at 9.30am; US job’s data at 1.30pm GMT.
Areas worthy of attention:
Supports: 1.38 handle; 1.3795; 1.3616/1.3610; 1.3653/1.3503.
Resistances: 1.3850.
AUD/USD:
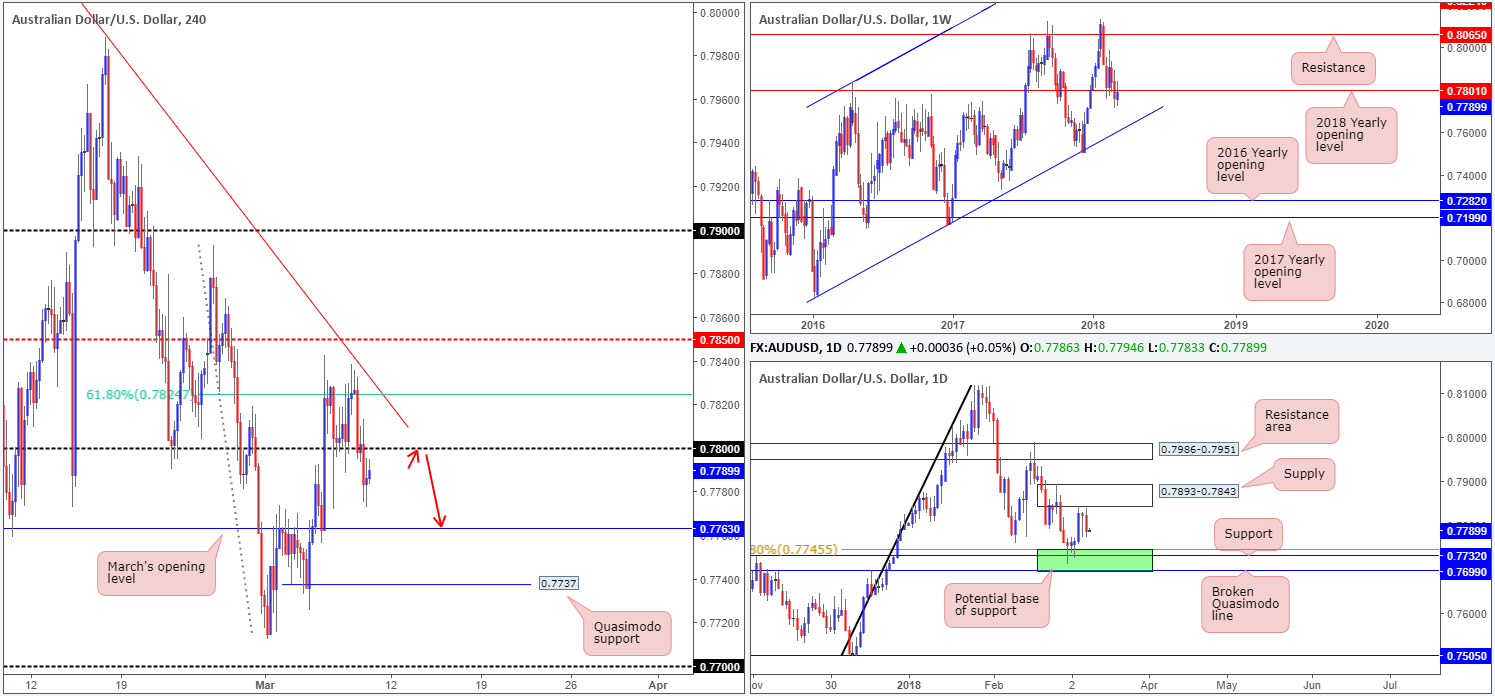
Despite upbeat Australian and Chinese trade balance figures, the AUD/USD was unable to generate much upside. H4 price remained capped by a H4 61.8% Fib resistance at 0.7824 and nearby H4 trendline resistance extended from the high at 0.8116. Moving into the session, we can see that the commodity currency also failed to hold ground above the 0.78 handle, pushing to lows of 0.7772 on strong dollar buying.
Weekly movement is beginning to display a defensive posture from the underside of the 2018 yearly opening level at 0.7801. In the event of a rejection here we could potentially see the unit shake hands with a weekly channel support taken from the low 0.6827. A little lower on the curve, daily price remains sandwiched between daily supply positioned at 0.7893-0.7843 and a daily support area marked in green at 0.7699/0.7745.
Potential trading zones:
Intraday sellers may be interested in a possible retest of the 0.78 band, since there is room to push lower on the H4, daily and weekly scales. The next downside target on the H4 chart can be seen at 0.7763: March’s opening line. Beyond here, we have a H4 Quasimodo support in view at 0.7737 (positioned within the walls of the current daily support area).
Data points to consider: Chinese inflation figures y/y at 1.30am; US job’s data at 1.30pm GMT.
Areas worthy of attention:
Supports: 0.7699/0.7745; 0.7763; 0.7737; weekly channel support.
Resistances: 0.7801; 0.78 handle; 0.7893-0.7843; 0.7824; H4 trendline resistance.
USD/JPY:
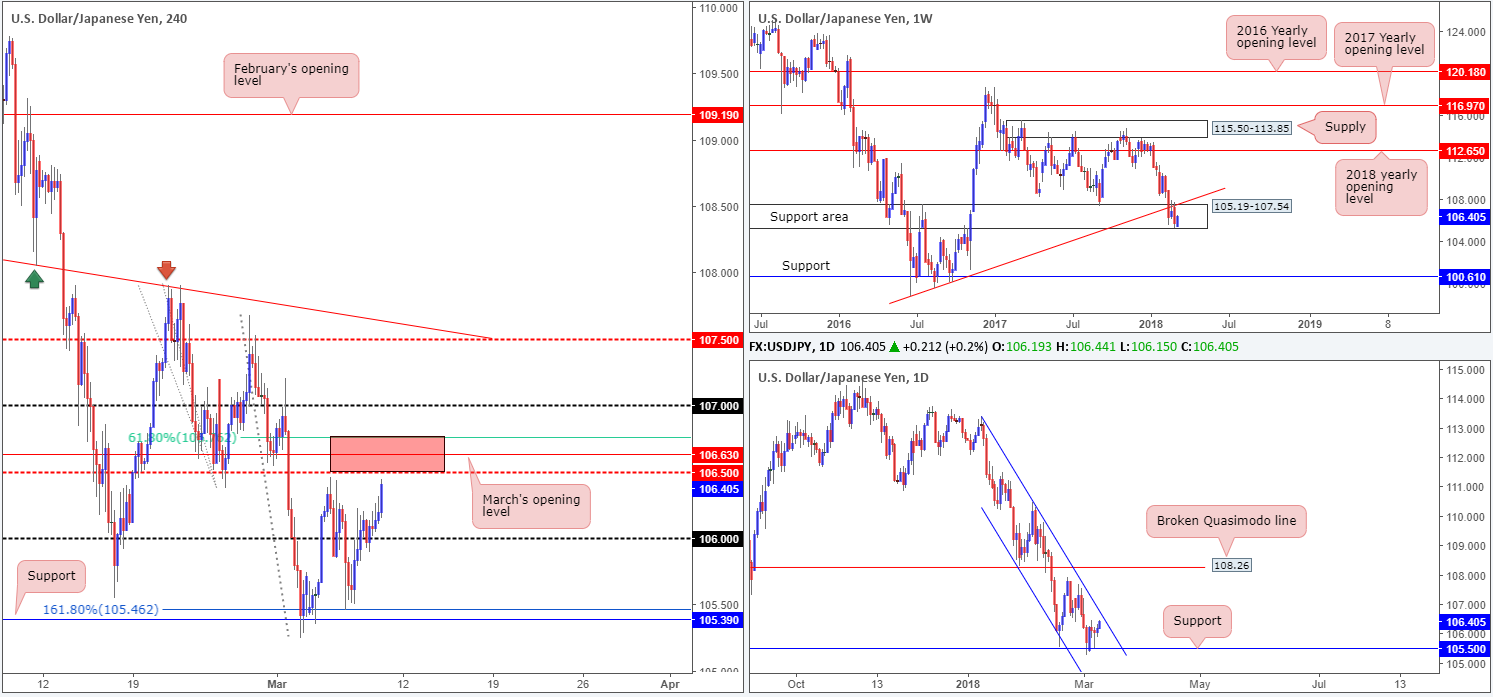
The USD/JPY largely stayed out of trouble on Thursday, refusing to participate in the choppy FX trade, patrolling a range between 105.90/106.25. In recent hours, however, the US dollar advanced against its Japanese counterpart. This, as far as we can see, is due to President Trump confirming tariffs but exempting Canada and Mexico.
As is evident from the H4 timeframe, this movement has brought the candles up to a particularly interesting zone painted in red. Comprised of a 61.8% H4 Fib resistance at 106.76, March’s opening level at 106.63 and a H4 mid-level resistance at 106.50, this area could potentially hold prices lower today.
The latest from the higher timeframes show daily price extending gains from daily support at 105.50, potentially eyeing a daily channel resistance taken from the high 113.38. Weekly price action also shows promise within the walls of a weekly support area at 105.19-107.54. The next upside hurdle from this point can be seen in the form of a weekly trendline support-turned resistance extended from the low 98.78.
Potential trading zones:
The red zone noted on the H4 timeframe is likely to produce a bounce. However, traders will want to keep an eye on stop-loss placement here since the 107 handle above could act as a magnet to price.
Also, traders may want to note that we have both the BoJ taking to the stage today, as well as the mighty NFP announcement today, which tends to stir price action!
Data points to consider: US job’s data at 1.30pm; BoJ policy rate, monetary policy statement and BoJ press conference (timing is tentative).
Areas worthy of attention:
Supports: 106 handle; 105.50; 105.19-107.54.
Resistances: 106.76/106.50; 107 handle; daily channel resistance.
USD/CAD:
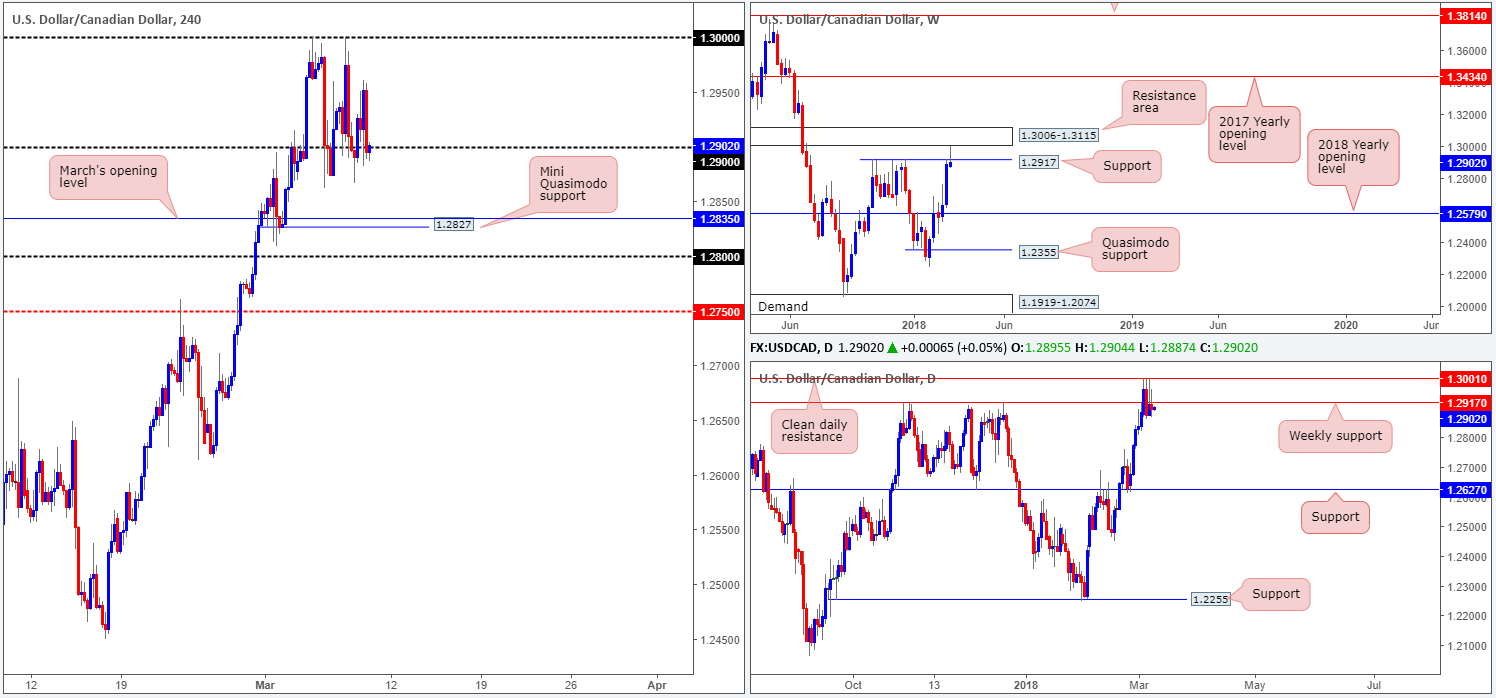
Kicking things off with a look on the weekly timeframe, we can see that price remains trading beneath 1.2917 after coming within a couple of pips of connecting with a weekly resistance area printed at 1.3006-1.3115. Higher-timeframe downside exhibits a healthy range from this point, with the closest support target seen on the daily timeframe at 1.2627.
As of current price, H4 movement is seen testing the underside of 1.29. Should the unit hold ground here the next port of call can be seen at March’s opening level at 1.2835, shadowed closely by a H4 mini Quasimodo support placed at 1.2827.
Potential trading zones:
With weekly price showing signs of a possible downturn in the midst, shorting the underside of 1.29 could be an option today. A solid bearish H4 retest of 1.29 would, in our humble view, be enough to warrant further selling down to at least March’s opening level.
Data points to consider: US job’s data and CAD job’s figures at 1.30pm GMT.
Areas worthy of attention:
Supports: 1.2835/27; 1.2627.
Resistances: 1.29 handle; 1.3006-1.3115; 1.2917.
USD/CHF:
The USD/CHF is trading with a reasonably strong upside bias this morning, with the pair clearly benefiting from easing fears of a trade war and the latest ECB movements.
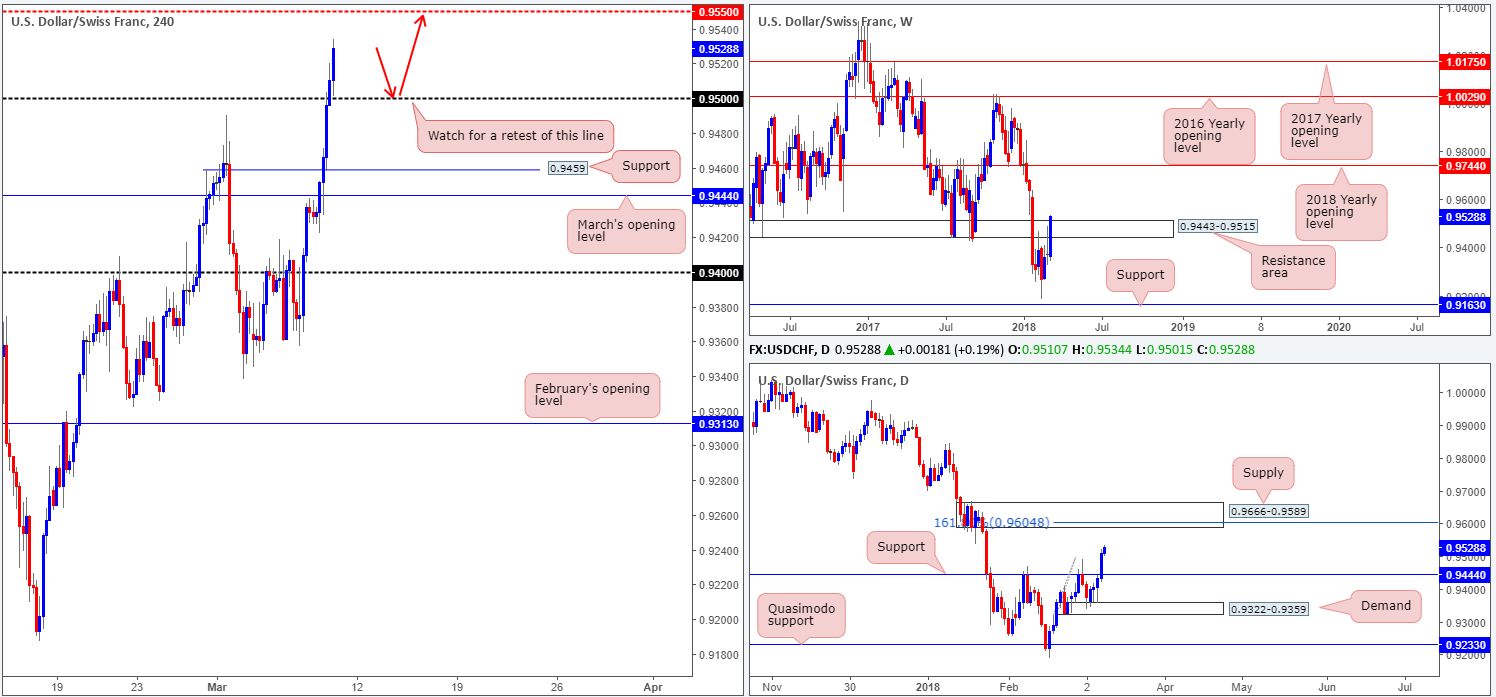
The move cleared several H4 tech resistances on Thursday, ending the day closing above the 0.95 handle. The next upside objective from this point is the H4 mid-level resistance at 0.9550. Also notable was a strong close above daily resistance at 0.9444 (which is now acting support), and a slight breach of the topside base of a weekly resistance area at 0.9443-0.9515. Continued buying on the bigger picture will likely bring daily action into the jaws of a solid daily supply coming in at 0.9666-0.9589, which houses a 161.8% daily Fib ext. point at 0.9604.
Potential trading zones:
What really stands out this morning is the 0.95 handle. A strong retest of this line could, as far as our technical drawings show, provide a platform to buy from today, targeting 0.9550, followed then by the underside of the daily supply mentioned above at 0.9666-0.9589.
Data points to consider: US job’s data at 1.30pm GMT.
Areas worthy of attention:
Supports: 0.95 handle; 0.9444.
Resistances: 0.9443-0.9515; 0.9666-0.9589; 0.9550.
DOW 30:
US stocks bounced to fresh session highs in late trade on Thursday after reports that Canada and Mexico would be indefinitely exempt from Trump’s steel/aluminium tariffs, spurring risk sentiment as traders welcomed a watered-down version of trade wars.
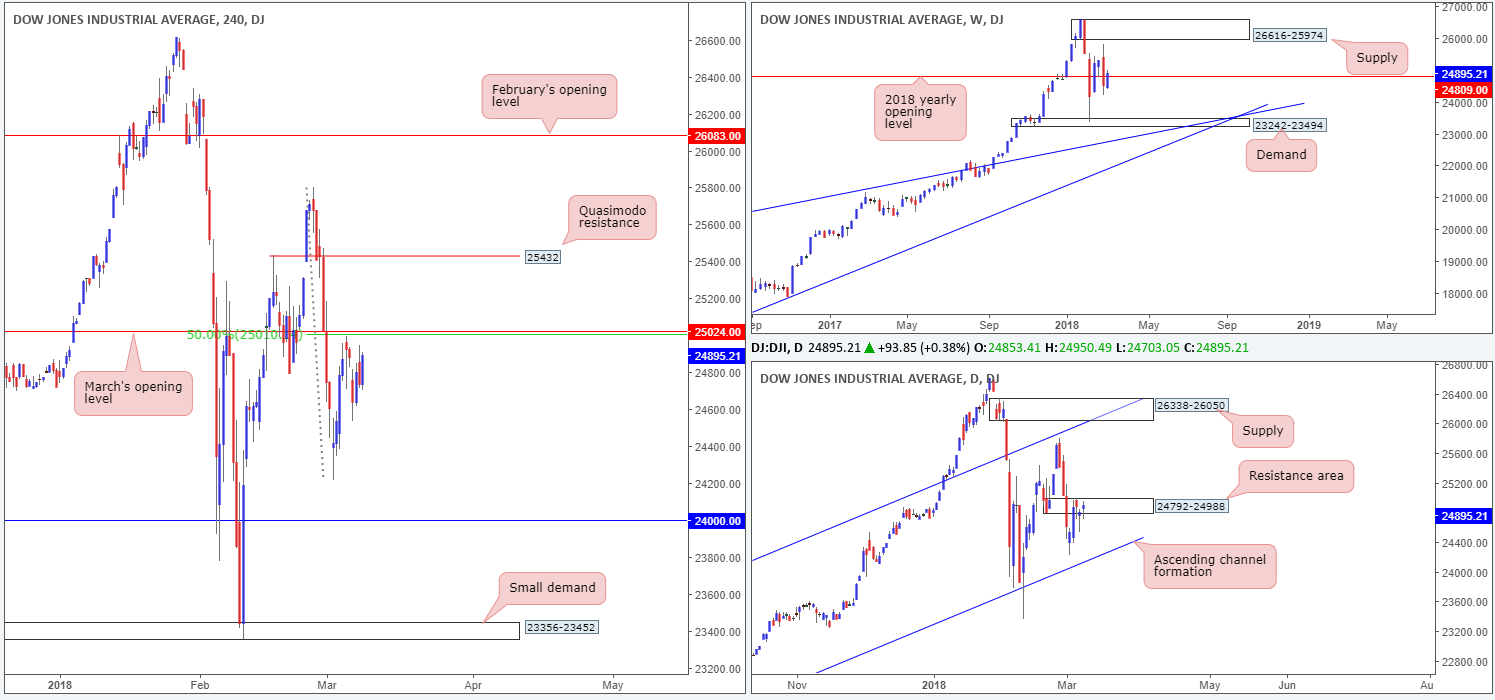
Technically speaking, H4 price remains beneath March’s opening level at 25024, which, as you can see, is bolstered by a 50.0% H4 resistance value at 25010. In view of these H4 barriers positioned within the confines of a daily resistance area at 24792-24988, there’s still a healthy chance of another bounce lower from here, despite weekly price showing little signs of rejecting the 2018 yearly opening level at 24809.
Potential trading zones:
Besides March’s opening base line at 25024, we also have an eyeball on the H4 Quasimodo resistance line at 25432 as this could also be an area where sellers may look to become active. Nevertheless, do keep in mind that this H4 level boasts absolutely no higher-timeframe convergence.
Data points to consider: US job’s data at 1.30pm GMT.
Areas worthy of attention:
Supports: 24000; daily channel support.
Resistances: 25024; 24792-24988; 24809.
GOLD:
With the US dollar advancing against the majority of its trading peers on Thursday, the gold market suffered additional losses.
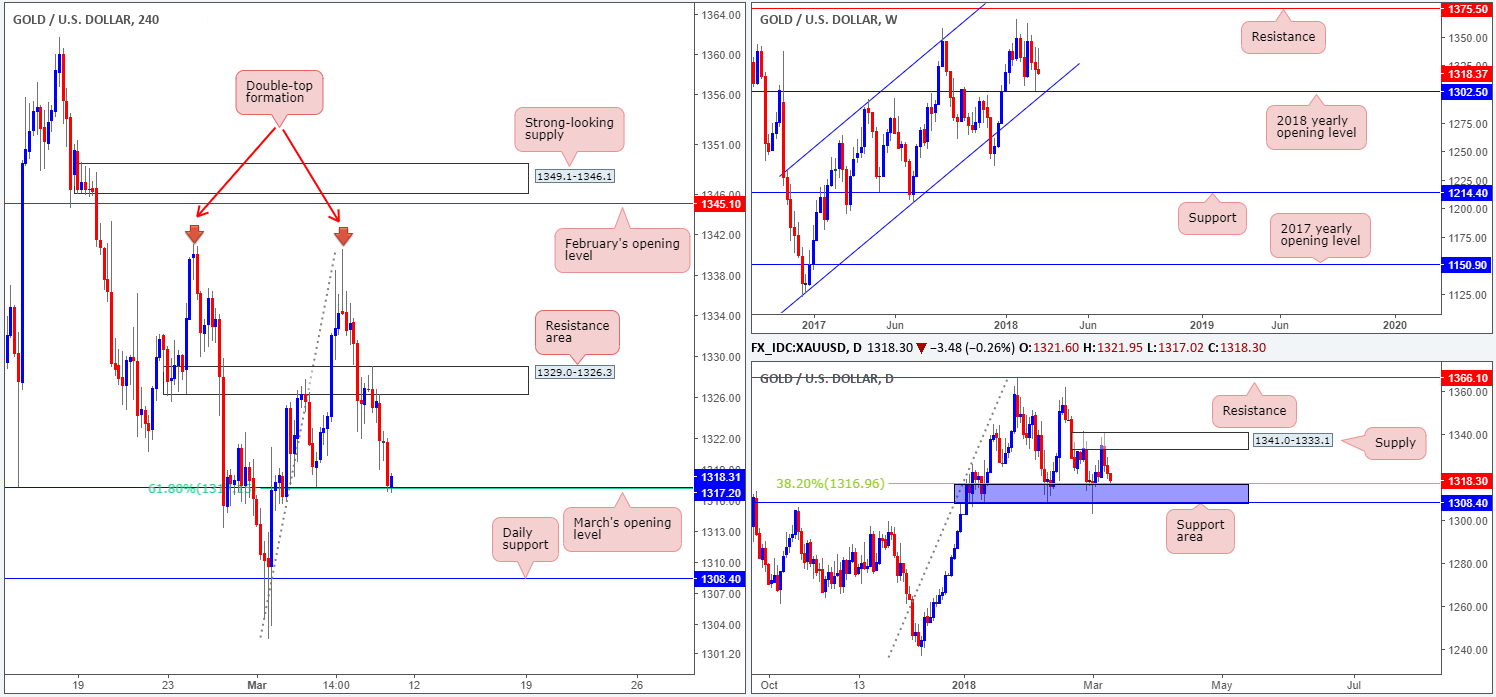
H4 flow, as you can see, is currently toying with March’s opening level at 1317.2, which is reinforced by a 61.8% H4 Fib support band. Having seen a daily support area at 1308.4-1316.9 lurking just beneath this line, however, traders who have initiated long positions from this angle will need to be prepared for a possible fakeout lower. Should the bulls continue to lift prices higher, nevertheless, then the next port of call on the H4 timeframe can be seen at 1329.0-1326.3: a H4 resistance area.
Potential trading zones:
Although H4 price is holding at 1317.2 at the moment, the daily support area is likely going to act as a magnet for price and pull the piece lower. An ideal scenario here would be a nice-looking H4 pin-bar formation that pierces through 1317.2 and touches the top edge of the noted daily support area. This, technically speaking, would be a high-probability long setup, with take-profit targets set at 1329.0-1326.3, followed closely by the underside of daily supply at 1341.0-1333.1.
Areas worthy of attention:
Supports: 1317.2; 1308.4/1316.9.
Resistances: 1341.0-1333.1; 1329.0-1326.3.
This site has been designed for informational and educational purposes only and does not constitute an offer to sell nor a solicitation of an offer to buy any products which may be referenced upon the site. The services and information provided through this site are for personal, non-commercial, educational use and display. IC Markets does not provide personal trading advice through this site and does not represent that the products or services discussed are suitable for any trader. Traders are advised not to rely on any information contained in the site in the process of making a fully informed decision.
This site may include market analysis. All ideas, opinions, and/or forecasts, expressed or implied herein, information, charts or examples contained in the lessons, are for informational and educational purposes only and should not be construed as a recommendation to invest, trade, and/or speculate in the markets. Any trades, and/or speculations made in light of the ideas, opinions, and/or forecasts, expressed or implied herein, are committed at your own risk, financial or otherwise.
The use of the site is agreement that the site is for informational and educational purposes only and does not constitute advice in any form in the furtherance of any trade or trading decisions.
The accuracy, completeness and timeliness of the information contained on this site cannot be guaranteed. IC Markets does not warranty, guarantee or make any representations, or assume any liability with regard to financial results based on the use of the information in the site.
News, views, opinions, recommendations and other information obtained from sources outside of www.icmarkets.com.au, used in this site are believed to be reliable, but we cannot guarantee their accuracy or completeness. All such information is subject to change at any time without notice. IC Markets assumes no responsibility for the content of any linked site. The fact that such links may exist does not indicate approval or endorsement of any material contained on any linked site.
IC Markets is not liable for any harm caused by the transmission, through accessing the services or information on this site, of a computer virus, or other computer code or programming device that might be used to access, delete, damage, disable, disrupt or otherwise impede in any manner, the operation of the site or of any user’s software, hardware, data or property.