EUR/USD:
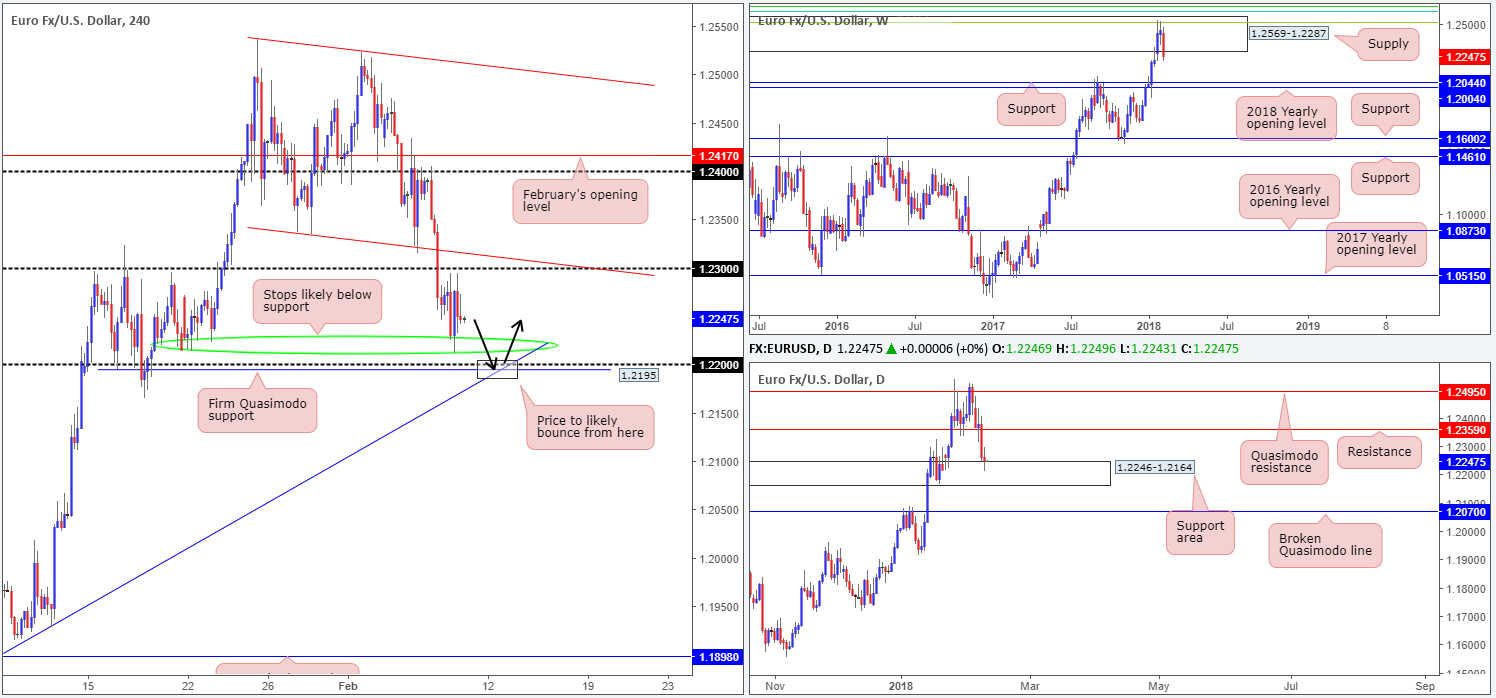
For the most part, Thursday’s session exhibited a somewhat directionless tone. As can be seen from the H4 timeframe, the candles spent the day fluctuating between H4 support marked with a green circle at 1.2220ish and the 1.23 handle.
Directly above 1.23 look out for a H4 channel support-turned resistance taken from the low 1.2336, whereas below 1.2220 we have a nice-looking H4 Quasimodo positioned at 1.2195. Notice that the Quasimodo also brings together a H4 trendline support extended from the low 1.1736 and the 1.22 handle.
Meanwhile, over on the bigger picture we can see that weekly sellers are making their presence felt from weekly supply marked at 1.2569-1.2287. Continued selling from this point could lead to price action challenging the weekly support at 1.2044, followed closely by the 2018 yearly opening line at 1.2004. On the other side of the coin, however, daily price is currently seen shaking hands with the top edge of a daily support area printed at 1.2246-1.2164 formed back in late 2014.
Potential trading zones:
The H4 Quasimodo support has ‘bounce’ written all over it this morning. Apart from it merging with the noted H4 support structures, there are likely a truckload of stop-loss orders lurking beneath the 1.2220 H4 support (green circle mentioned above) that when filled will become sell orders, and therefore provide liquidity for traders to lift prices from the 1.2195 neighborhood. One final point worth addressing is that the H4 Quasimodo is also seen plotted within the lower limits of the aforementioned daily support area, thus adding weight to the H4 levels.
The only grumble to entering long this market, as you can probably imagine, is the fact that weekly price is trading southbound, hence why we are only expecting a bounce at the highlighted supports.
Data points to consider: No high-impacting events on the docket today.
Areas worthy of attention:
Supports: 1.2195; H4 trendline support; 1.22 handle; 1.2220; 1.2246-1.2164; 1.2044; 1.2004.
Resistances: 1.2569-1.2287; 1.2359; H4 channel resistance; 1.23 handle.
GBP/USD:
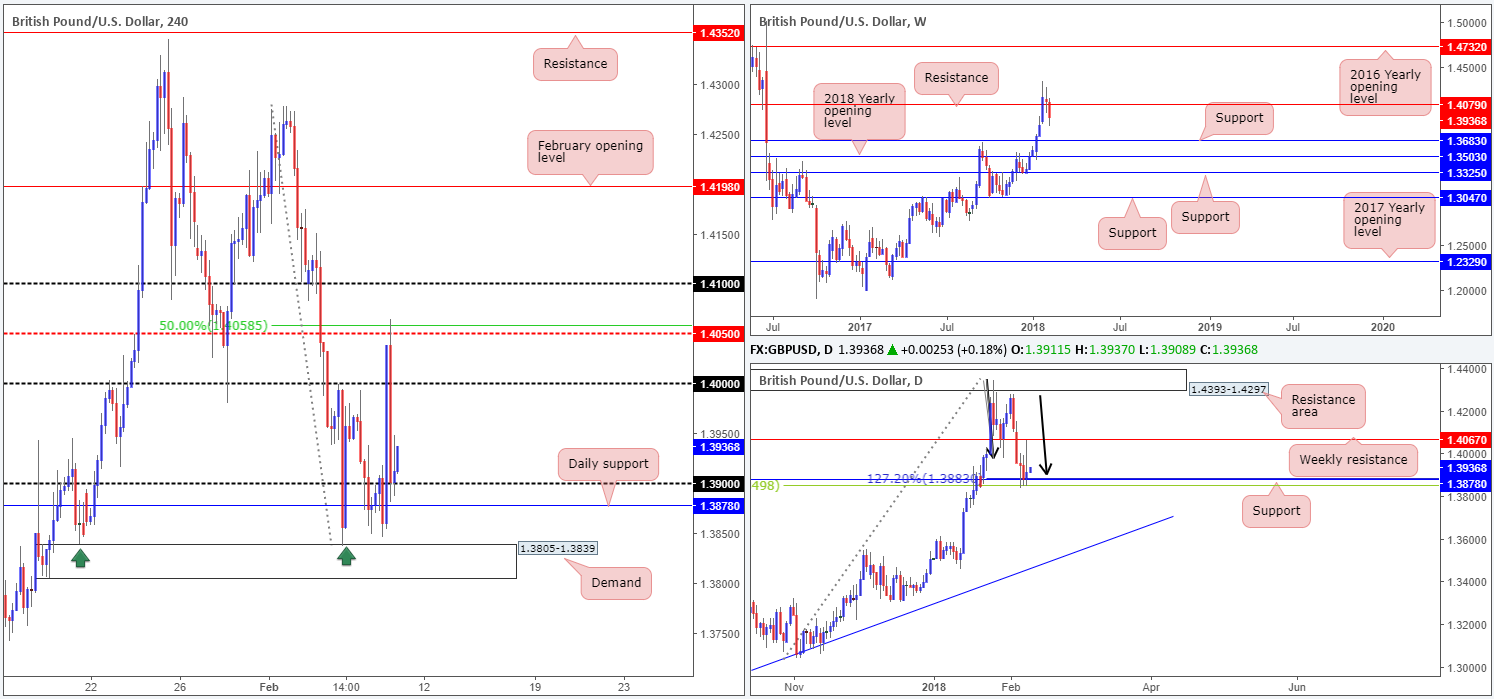
Amid European trade on ‘Super Thursday’, the British pound strengthened in aggressive fashion and touched a session high of 1.4063. This followed the BoE’s monetary policy decision (interest rates left unchanged) and BoE Gov. Carney’s speech.
Despite the strong bout of buying, though, the unit swiftly gave up its BoE-inspired gains during the US segment, aggressively dropping down as far as the 1.39 handle.
The technical picture on the weekly timeframe shows us that weekly movement has the room to press as low as the weekly support level coming in at 1.3683. The daily timeframe, on the other hand, reveals that daily support at 1.3878 remains in motion. This level also brings together a daily AB=CD (see black arrows) 127.2% correction point at 1.3883 and a 38.2% daily Fib support at 1.3849. Therefore, although weekly price shows little support nearby, the sellers may still have their work cut out for them should they intend on hunting lower prices today.
Potential trading zones:
Despite cable ranging more than 200 pips yesterday, there is little change seen to the overall structure of this market. As a result, we still feel that neither a long nor shorts seems attractive at this time.
Not only do we have conflicting opinions coming in from the higher timeframes, we also, in our technical opinion, have limited trade confluence seen on the H4 scale.
Data points to consider: UK manufacturing production m/m and Goods trade balance at 9.30am; MPC member Cunliffe speaks at 4.45pm GMT.
Areas worthy of attention:
Supports: 1.3878; 1.3883; 1.3849; 1.3683; 1.39 handle.
Resistances: 1.40 handle.
AUD/USD:
Since the commodity-linked currency peaked at 0.8135 on Jan 26, the Aussie has suffered consecutive daily losses.
In early trading on Thursday, the pair took a hit following less-than-stellar Chinese trade balance data. After driving through the 0.78 handle, the day ended with price bottoming around the top edge of a H4 demand base drawn from 0.7762-0.7779, which, as you can see, is holding firm at this time.
Weekly flow marginally surpassed the 2018 yearly opening level at 0.7801, but remains far too early to tell whether bids have dried up here yet. On the daily timeframe, demand at 0.7807-0.7841 was taken out during yesterday’s downside move (now acting resistance area), consequently exposing a daily support level penciled in at 0.7732.
Potential trading zones:
Despite the response seen from the current H4 demand, this is not a buyers’ market. Yes, the 2018 yearly opening level may still contain active buyers, but with the 0.78 handle, a H4 resistance at 0.7812 and the daily resistance area mentioned above at 0.7807-0.7841 potentially hindering upside, we’d avoid entering into any buy transactions for now.
How about a short beyond the current H4 demand? This could be a viable approach as long as you remain cognizant of the nearby daily support level plotted at 0.7732. Between these two levels one has 30 or so pips to play with. So not really a lot to work with here!
Data points to consider: RBA monetary policy statement at 12.30am; Chinese inflation figures at 1.30am GMT.

Areas worthy of attention:
Supports: 0.7762-0.7779; 0.7732; 0.7801.
Resistances: 0.78 handle; 0.7812; 0.7807-0.7841.
USD/JPY:
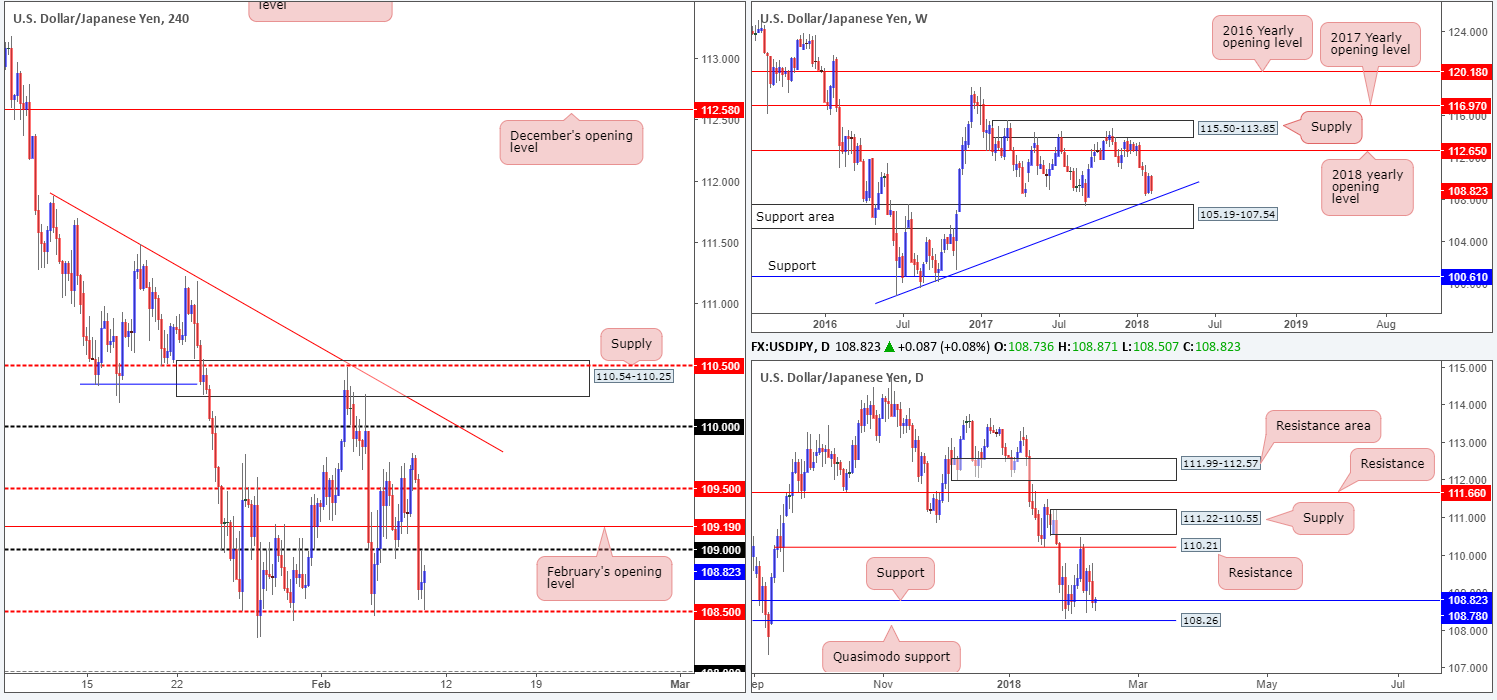
Failing to sustain gains above the H4 mid-level resistance at 109.50, the USD/JPY aggressively turned to the downside amid yesterday’s US session on a bout of risk aversion. Following the Dow Jones Industrial Average, which ended the day down 4.15%, the pair concluded trade closing just ahead of a H4 mid-level support at 108.50, down 0.55%.
In recent hours, H4 price struck the 108.50 base and has so far responded positively, bringing the unit up to within striking distance of the 109 handle.
Weekly price continues to float ahead of a weekly trendline support etched from the low 98.78 and a nearby weekly support area coming in at 105.19-107.54. Daily price, at the time of writing, is seen shaking hands with a daily support level at 108.78. Should this level fail to hold, there’s another layer of support seen just below it at 108.26 in the form of a daily Quasimodo.
Potential trading zones:
In a nutshell, this is what we have to work with right now:
- Weekly price could potentially drive down to 1.08ish to connect with the aforementioned weekly trendline support.
- Daily support still in play at 108.78, but looks fragile – expect a move down to 108.26: the daily Quasimodo support.
- H4 action somewhat restricted. Upside limited by the 109 handle and February’s opening line at 109.19.
Should you be looking to long this market, between 108.26 (the daily Quasimodo) and the 1.08 handle is an area to consider, given its connection with the noted weekly trendline support.
Data points to consider: No high-impacting events on the docket today.
Areas worthy of attention:
Supports: 108.50; 1.08 handle; 108.78; 108.26; Weekly trendline support; 105.19-107.54.
Resistances: 109 handle; 109.19.
USD/CAD:
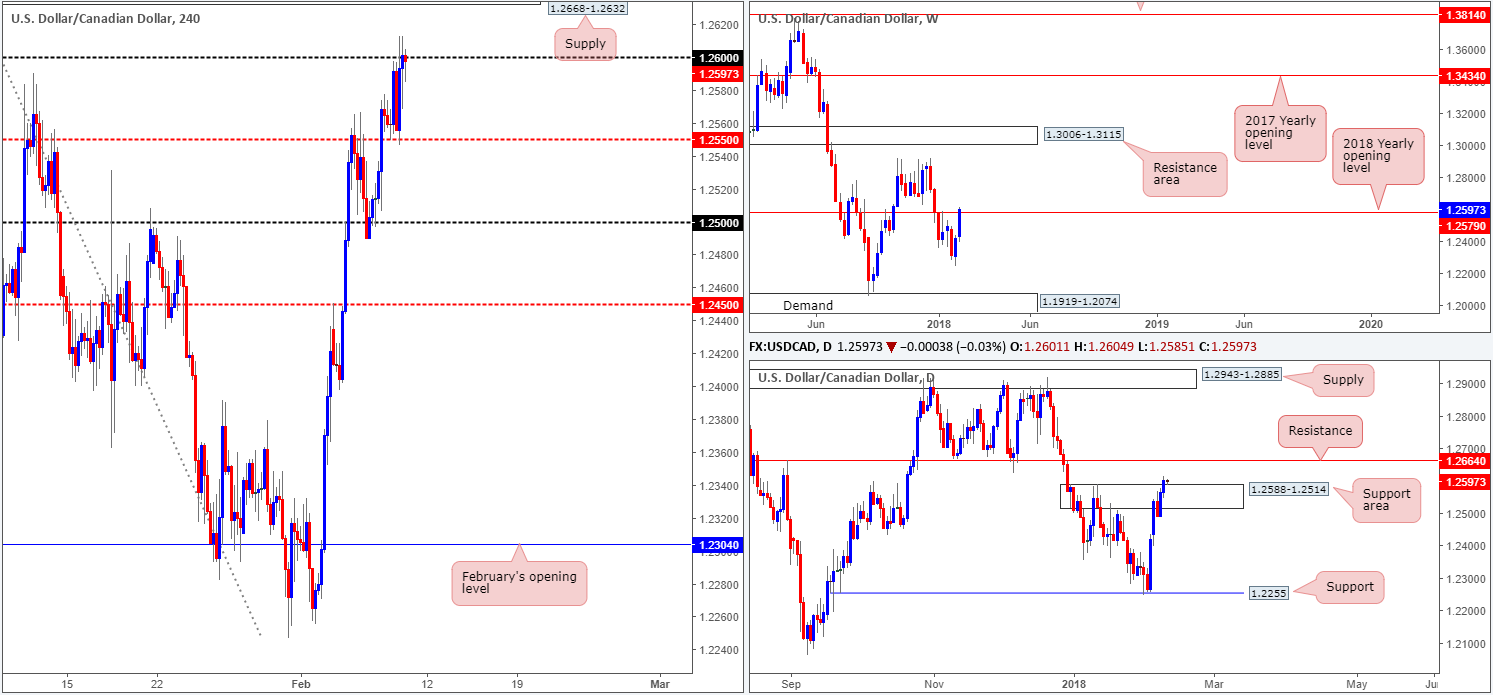
During the course of Thursday’s trade, the US dollar pushed higher against its Canadian counterpart as the greenback continues to outperform. As we hope is demonstrated clearly on the H4 timeframe, the pair put in a top around the 1.26 handle going into the London close. A violation of this number may call for a move up to a H4 supply seen at 1.2668-1.2632. Although not seen on the H4 chart, this area houses a H4 61.8% Fib resistance at 1.2663, a H4 mid-level resistance at 1.2650 and a daily resistance level plotted at 1.2664. This daily level came into view after price engulfed a daily supply at 1.2588-1.2514 (now acting support area). Also worthy of note is weekly action recently bumped heads with the 2018 yearly opening level at 1.2579.
Potential trading zones:
The H4 supply noted above at 1.2668-1.2632 is, we believe, a potential reversal zone due to the resistance structures it houses. Also important to note here is the potential stop-loss orders planted above 1.26. These orders, once filled, will become buy orders and therefore provide liquidity for those looking to sell the H4 supply.
Data points to consider: Canadian employment data at 1.30pm GMT.
Areas worthy of attention:
Supports: 1.2588-1.2514.
Resistances: 1.26 handle; 1.2668-1.2632; 1.2664; 1.2579.
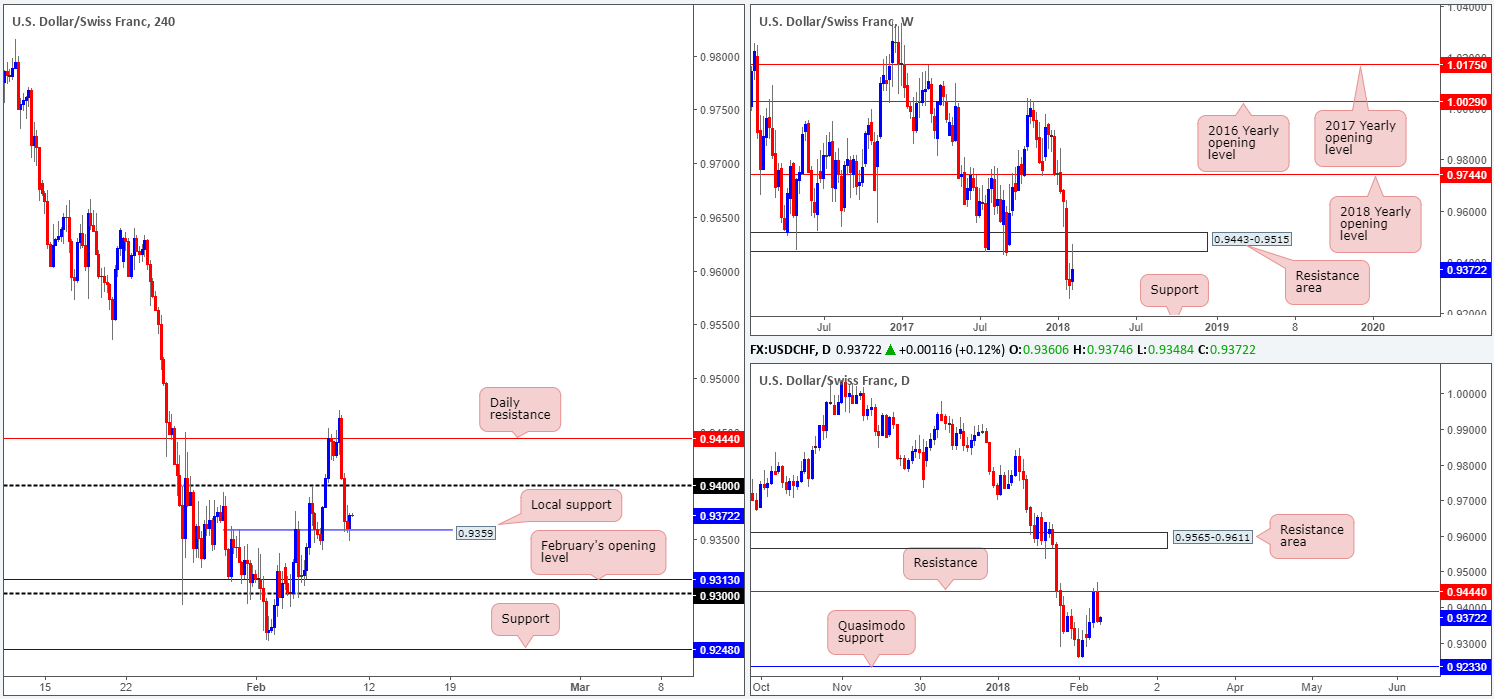
USD/CHF:
The USD/CHF spent the majority of Thursday’s session fading a daily resistance level at 0.9444. The move, likely exacerbated by an influx of safe-haven CHF buying, stormed through bids at the 0.94 handle and ended the segment colliding with a local H4 support sited at 0.9359.
As this daily level also represented the underside of a weekly resistance area at 0.9443-0.9515, yesterday’s move to the downside was of little surprise to us technicians.
According to weekly flow, the unit could press as far south as the weekly support (not seen on the screen) at 0.9163. Daily price, on the other hand, shows support could come into the picture a little earlier than this at 0.9233: a daily Quasimodo support base.
Potential trading zones:
In light of both weekly and daily price portending further downside, buying from the current local H4 support is not really something we’d label a high-probability move. Therefore, we feel that further selling could be on the cards as we enter the more liquid sessions today, targeting February’s opening line at 0.9313, shadowed closely by the 0.93 handle.
Intraday shorts beyond 0.9359 are a possibility. However, one may want to consider waiting for a solid retest of 0.9359 to take place before pulling the trigger, as this will help avoid the dreaded fakeout!
Data points to consider: No high-impacting events on the docket today.
Areas worthy of attention:
Supports: 0.9359; 0.9313; 0.93 handle; 0.9233; 0.9163.
Resistances: 0.94 handle; 0.9444; 0.9443-0.9515.
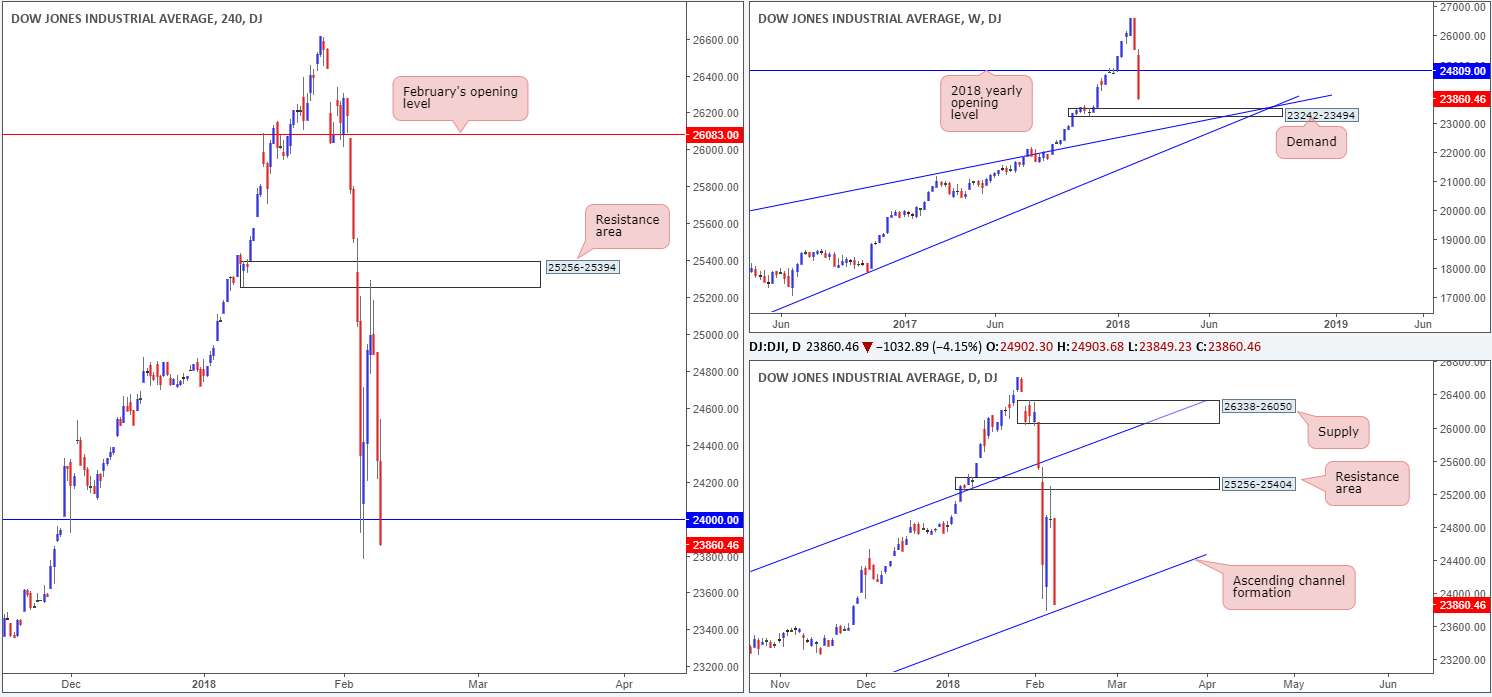
DOW 30:
Despite a healthy correction from the $24K mark, equity markets plunged on concerns that rising interest rates will damper down economic growth.
After basing around the underside of a H4 resistance area at 25256-25394 (located within a daily resistance area at 25256-25404) in the shape of two back-to-back H4 selling wicks, the DJIA index tumbled over 4% in recent trading. The unit concluded the day printing a near-full-bodied daily bearish candle that crossed below $24K, and placed daily action ahead of a daily channel support extended from the low 17883 as well as weekly price ahead of a weekly demand area at 23242-23494.
Potential trading zones:
Selling sub $24K is likely to bring on drawdown, given the daily/weekly structures seen just ahead. Therefore, we’d avoid selling this market, although every man and his dog may be attempting to now!
A fakeout through the current daily channel support could be something to look for, since traders may run stops beyond this point and use these orders to buy from the aforementioned weekly demand. How do we confirm if a fakeout has taken place? Simply view how price action behaves. A clear-cut buying tail that penetrates through the daily line and taps the weekly area, along with a positive close, is what we generally look for.
Data points to consider: No high-impacting events on the docket today.
Areas worthy of attention:
Supports: Daily channel support; 23242-23494.
Resistances: 24000; 25256-25394; 25256-25404.
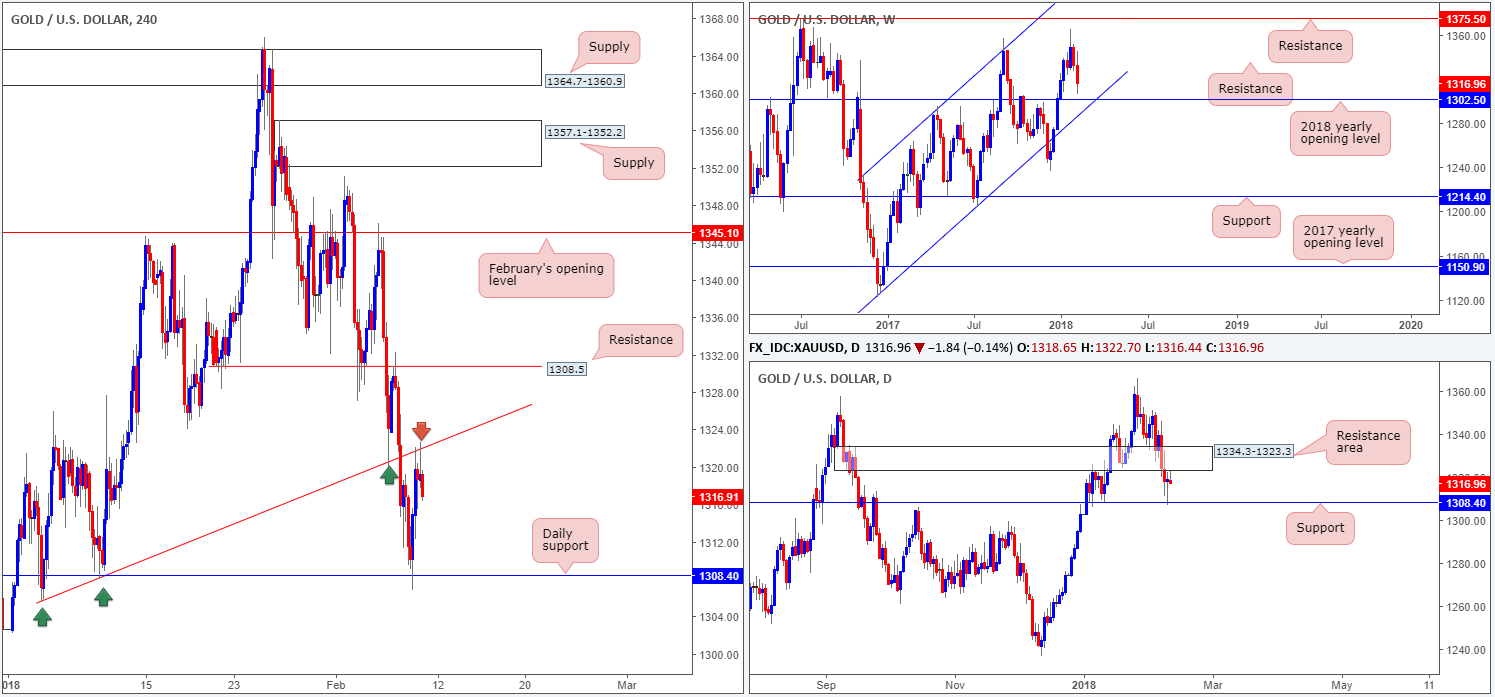
GOLD:
Using a top-down approach this morning, it is clear to see that the price of gold has been under pressure of late. According to weekly movement further selling could still be in store, too. The next downside target on this scale can be seen at the 2018 yearly opening level at 1302.5.
Turning the focus down to the daily timeframe, we can see that over the past few sessions, the yellow metal has been consolidating between a daily support level coming in at 1308.4 and a daily resistance area printed at 1334.3-1323.3. A violation of the current support would likely give an early indication that we’re heading to the 2018 mark mentioned above.
Looking across to the H4 candles, however, price recently shook hands with the underside of a recently broken H4 trendline support-turned resistance taken from the low 1305.6. This, considering it intersects beautifully with the aforementioned daily resistance area, could prompt a move back down to the daily support mentioned above at 1308.4.
Potential trading zones:
A short from the H4 trendline, given the landscape set on the higher timeframes right now, is a high-probability sell, according to the technicals. However, it appears as though that ship may have already sailed!
In the event that H4 price retraces and pays another visit to the noted H4 trendline, a sell from this region is attractive as long as H4 proves seller intent beforehand. What we mean by this is price simply printing a H4 full or near-full-bodied bearish candle from the line.
Areas worthy of attention:
Supports: 1308.4; 1302.5.
Resistances: H4 trendline resistance; 1334.3-1323.3.
This site has been designed for informational and educational purposes only and does not constitute an offer to sell nor a solicitation of an offer to buy any products which may be referenced upon the site. The services and information provided through this site are for personal, non-commercial, educational use and display. IC Markets does not provide personal trading advice through this site and does not represent that the products or services discussed are suitable for any trader. Traders are advised not to rely on any information contained in the site in the process of making a fully informed decision.
This site may include market analysis. All ideas, opinions, and/or forecasts, expressed or implied herein, information, charts or examples contained in the lessons, are for informational and educational purposes only and should not be construed as a recommendation to invest, trade, and/or speculate in the markets. Any trades, and/or speculations made in light of the ideas, opinions, and/or forecasts, expressed or implied herein, are committed at your own risk, financial or otherwise.
The use of the site is agreement that the site is for informational and educational purposes only and does not constitute advice in any form in the furtherance of any trade or trading decisions.
The accuracy, completeness and timeliness of the information contained on this site cannot be guaranteed. IC Markets does not warranty, guarantee or make any representations, or assume any liability with regard to financial results based on the use of the information in the site.
News, views, opinions, recommendations and other information obtained from sources outside of www.icmarkets.com.au, used in this site are believed to be reliable, but we cannot guarantee their accuracy or completeness. All such information is subject to change at any time without notice. IC Markets assumes no responsibility for the content of any linked site. The fact that such links may exist does not indicate approval or endorsement of any material contained on any linked site.
IC Markets is not liable for any harm caused by the transmission, through accessing the services or information on this site, of a computer virus, or other computer code or programming device that might be used to access, delete, damage, disable, disrupt or otherwise impede in any manner, the operation of the site or of any user’s software, hardware, data or property.