EUR/USD:
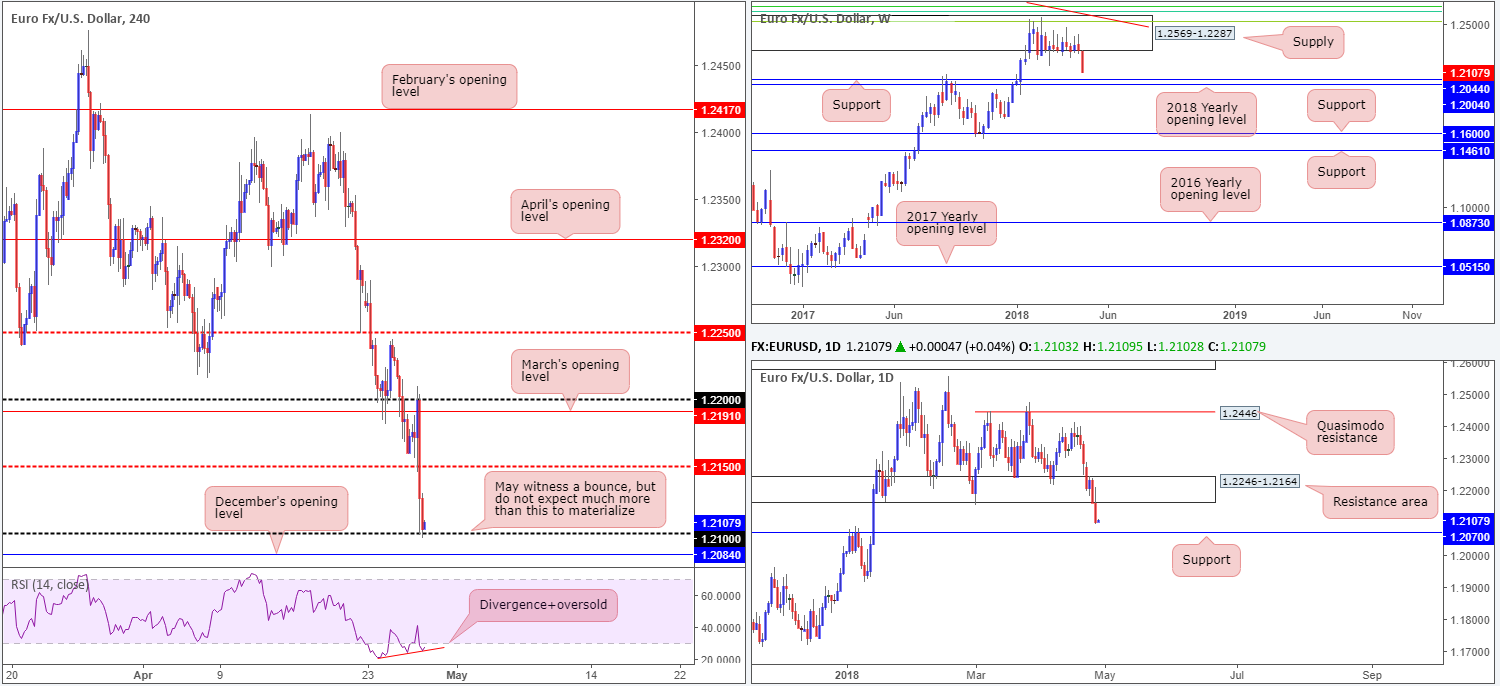
Unable to sustain gains beyond the 1.22 handle, the single currency aggressively turned lower on Thursday amid a combination of dollar-positive economic events and an on-hold ECB. As is shown on the H4 timeframe, the pair snapped through orders at the H4 mid-level support drawn from 1.2150 and swiftly bumped heads with 1.21, which remained firm into the close.
Weekly price continues to reflect a bearish tone from its major-league weekly supply seen at 1.2569-1.2287. According to this timeframe, further selling could be seen toward weekly support drawn from 1.2044, shadowed closely by the 2018 yearly opening level at 1.2004. In conjunction with this movement, daily price similarly shows room to stretch lower after breaching a significant daily support area at 1.2246-1.2164 (now acting resistance zone). The next port of call falls in around daily support penciled in at 1.2070.
Potential trading zones:
1.21 is a dicey long, in our view, despite observing the H4 RSI’s divergence and overbought readings. We feel a fakeout beneath this number is highly likely due to nearby H4 support at 1.2084 in the shape of December’s opening level. Further to this, downside remains favored on the bigger picture until we connect with the daily support mentioned above at 1.2070.
Between 1.2070 and the aforementioned weekly supports is an area where we anticipate the bulls to make an appearance. Therefore, keep eyeballs on 1.2004/1.2070 for potential medium-term long positions. Traders may also want to note that bolstering this buy zone is a monthly resistance printed on the US dollar index at 91.92.
Data points to consider today: Spanish inflation and growth figures; US advance GDP Q/Q; US employment cost index q/q; Revised UoM consumer sentiment.
GBP/USD:
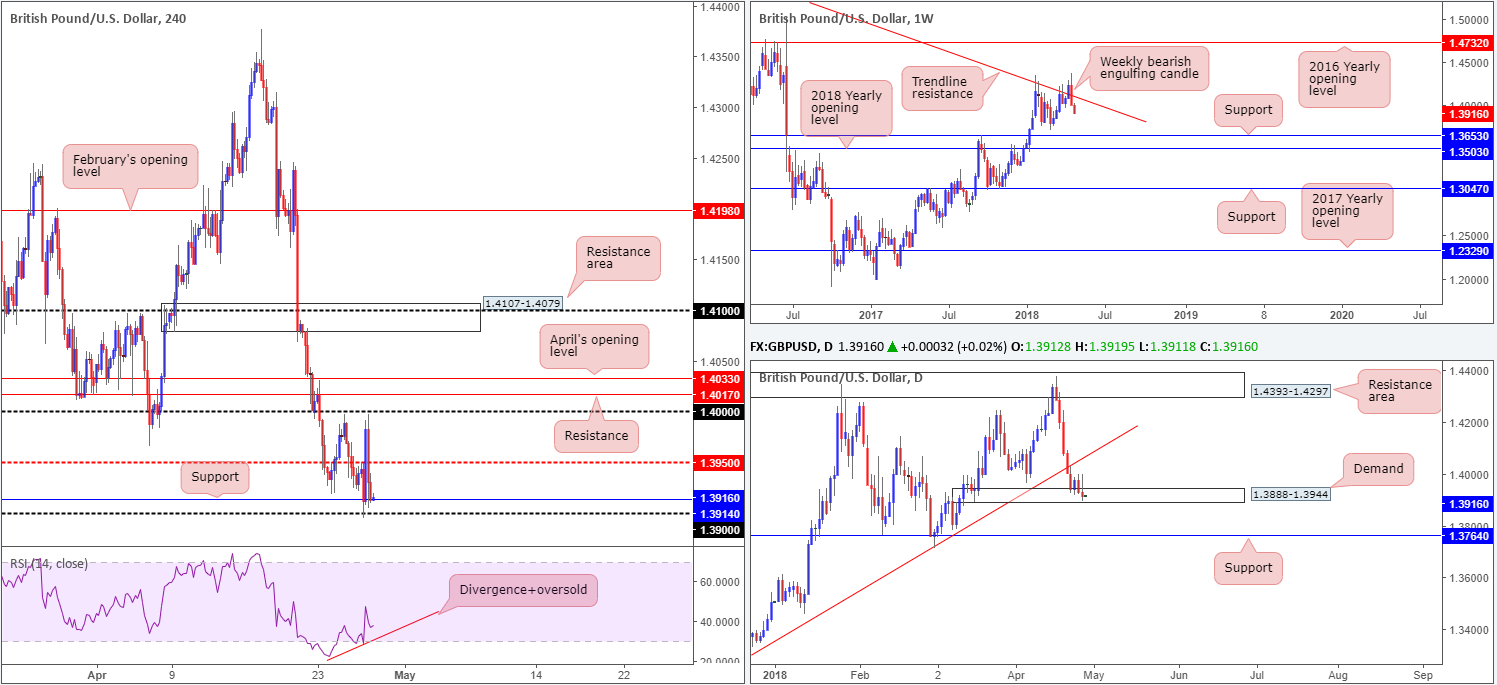
Although the British pound squeezed out a marginal loss on Thursday, trade concluded the day pretty much unchanged in terms of technical structure.
Amid the early hours of London, the H4 candles whipsawed through H4 support at 1.3914 and tested active bids around the 1.39 vicinity. This lifted the currency beyond H4 mid-level resistance at 1.3950 and back up to 1.40 territory which, as you can see, remained on the defensive.
Looking higher up, the daily candles remain trading within the walls of a daily demand base coming in at 1.3888-1.3944. Judging by the limited response seen from this zone the area appears somewhat fragile. A break of this zone would likely place the spotlight on daily support plotted at 1.3764. Weekly price also continues to echo bearish vibes, according to our technicals. Last week’s action formed a striking weekly bearish engulfing candle that nose-dived back beneath a long-term weekly trend line resistance taken from the high 1.5930. The next support target from this range can be seen at 1.3653!
Potential trading zones:
Although we’re seeing weakness, attempting to sell on this action is problematic at the moment. Not only do we have the aforementioned H4 support to contend with, there’s also 1.39 as well as the noted daily demand. Should one witness a decisive H4 close beneath 1.39, however, shorts on the retest of this number down to 1.38, followed by the daily support mentioned above at 1.3764, could be an option. The idea behind this is a H4 close beyond 1.39 would likely trigger stop-loss orders beneath the current daily demand and therefore weaken buyers further.
Data points to consider today: UK prelim GDP q/q; BoE Gov. Carney speaks; US advance GDP Q/Q; US employment cost index q/q; Revised UoM consumer sentiment.
AUD/USD:
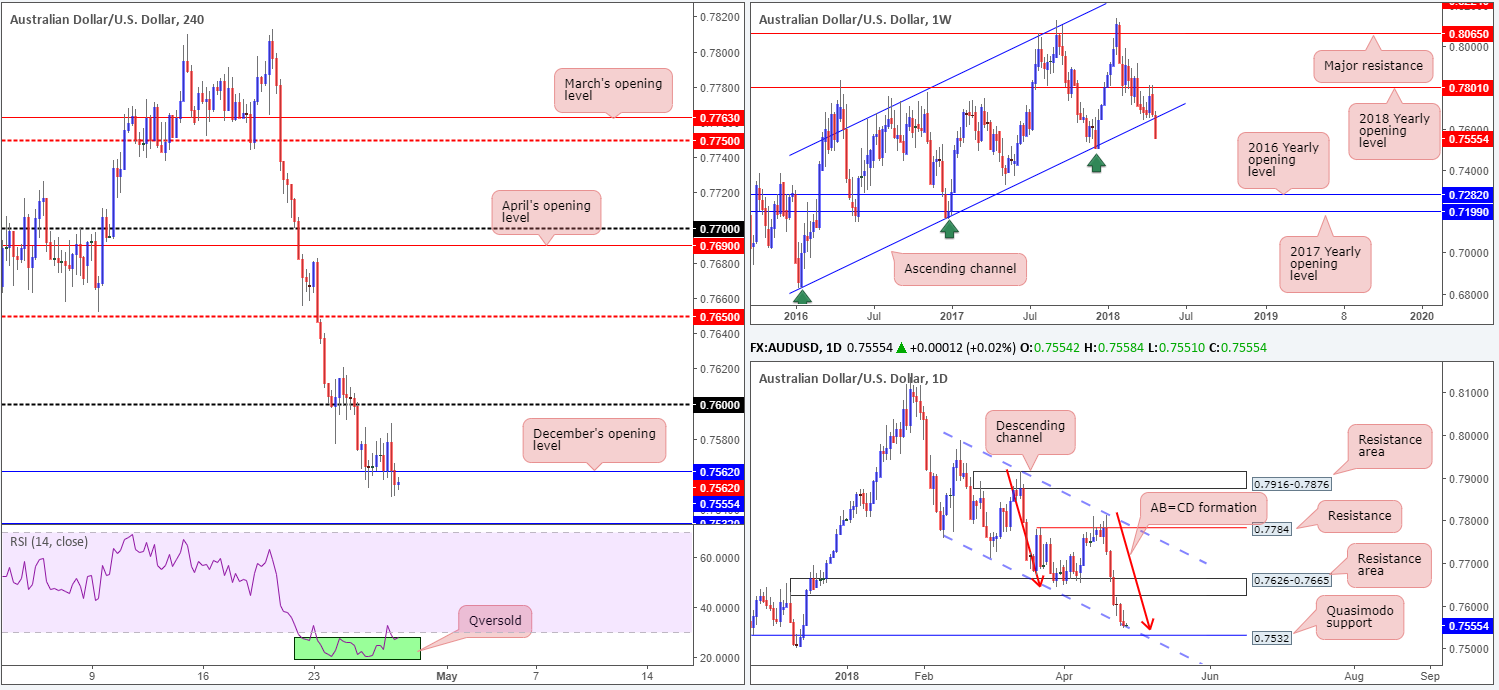
Using a top-down approach this morning, we can see that weekly price recently broke out of a long-term weekly ascending channel formation (taken from the low 0.6827) and is on track to register a strong close to the downside! A breach of the weekly low 0.7502 would, as far as we can see, likely trigger further downside on this scale. Daily movement, on the other hand, recently checked in with a daily channel support drawn in from the low 0.7758, which is positioned just ahead of a daily Quasimodo support at 0.7532.
December’s opening level at 0.7562, as is evident from the H4 timeframe, held firm for the majority of the day on Thursday. It was only as we entered into US hours did we see things turn sour and close lower (likely influenced by dollar-positive economic news). With 0.7562 now likely to act as a resistance, we do not see much stopping the H4 candles from driving lower and challenging the daily Quasimodo support mentioned above at 0.7532.
Potential trading zones:
On account of the above information, the team has noted to expect a fakeout below the current daily channel support into orders surrounding the noted daily Quasimodo support. To our way of seeing things, this makes logical sense since H4 price also shows room to challenge the daily zone, plus we can also see a daily AB=CD correction that terminates just ahead of the daily Quasimodo level (see red arrows) as well! To that end, keep eyes on 0.7532ish for potential longs today.
Data points to consider today: US advance GDP Q/Q; US employment cost index q/q; Revised UoM consumer sentiment.
USD/JPY:
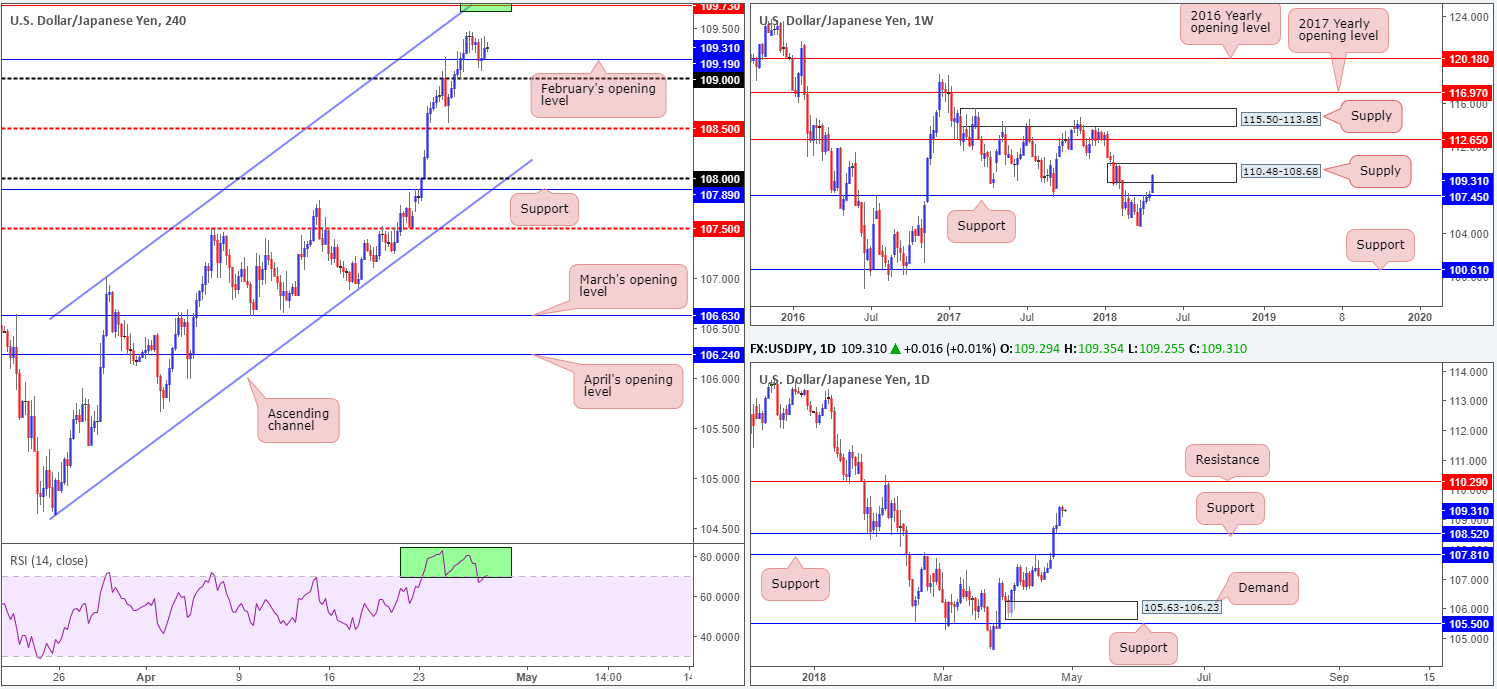
Positive US economic data, coupled with a robust USD and rising US equities, was not enough to lift the USD/JPY higher on Thursday as it trades around multi-month highs. US Treasury yields, however, particularly the 10- year yield, pared recent gains and crunched its way back beneath the 3% mark.
Despite the above, February’s opening line seen on the H4 timeframe at 109.19 remained firm. As highlighted in yesterday’s report, overhead there’s a potential H4 sell zone at 109.73: a H4 resistance level – could also be labeled a Quasimodo resistance – that fuses closely with a H4 channel resistance etched from the high 107.01 (not seen on the screen). In addition to this, we can also see weekly supply at 110.48-108.68 encapsulating the H4 levels.
Daily movement, on the other hand, highlights room to potentially climb as high as daily resistance seen at 110.29 (seen within the upper limits of the current weekly supply). This comes after breaching daily resistance at 108.52 in strong fashion on Monday.
Potential trading zones:
Trading this market medium-term may be a challenge, given we have daily price holding above support and weekly action trading from supply.
Intraday, nonetheless, offers potential long opportunities off of February’s opening level at 109.19 (remain cognizant of a potential fakeout below here to 109), targeting the aforementioned H4 resistance at 109.73. 109.73, given the H4 confluence merging with this resistance and the fact that it’s positioned within weekly supply, is not only considered a take-profit target to the upside, but also, as highlighted above, a potential sell zone going into today’s segment.
Data points to consider today: US advance GDP Q/Q; US employment cost index q/q; Revised UoM consumer sentiment; BoJ Monetary policy statement, Policy rate, Outlook report and Press conference.
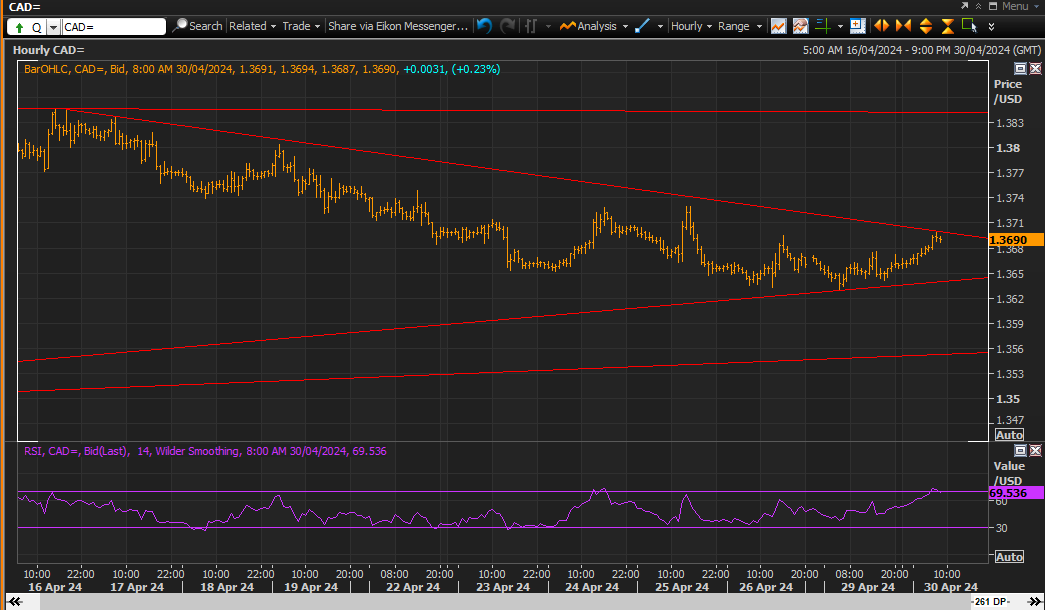
USD/CAD:
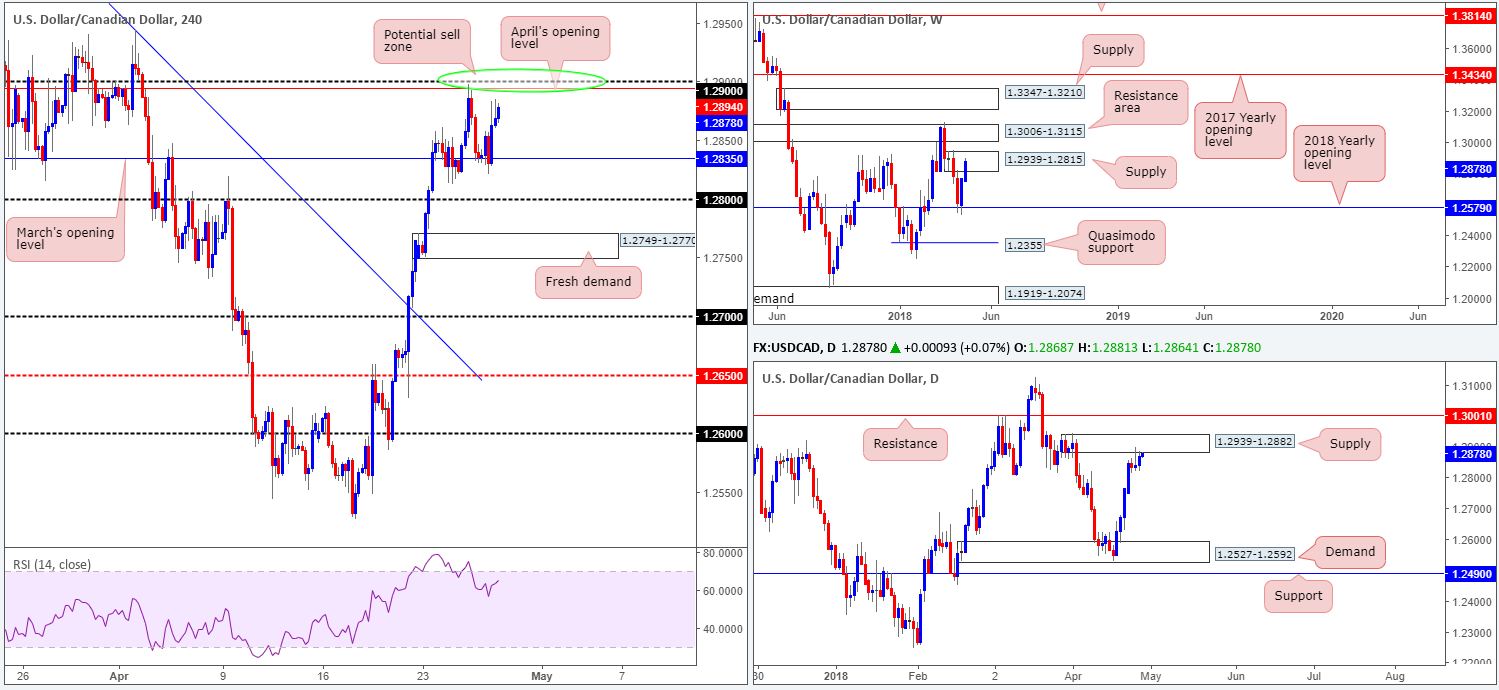
The pullback off April’s opening level seen on the H4 timeframe at 1.2894 was a relatively short-lived move. Supported by a strong USD across the board, as well as March’s opening level seen on the H4 scale at 1.2835, the USD/CAD punched higher on Thursday.
This has repositioned the H4 candles within shouting distance of the noted April’s open line and 1.29 handle. In addition to this, daily action is also, once again, seen teasing the underside of a daily supply zone printed at 1.2939-1.2882, which happens to be sited within the upper limits of a weekly supply seen at 1.2939-1.2815.
Potential trading zones:
In view of the higher-timeframe supplies in play, shorting 1.29/1.2894 on the H4 timeframe is a possibility. Considering that 1.2894 has already been tested (and could likely be weak), waiting for a full or near-full-bodied H4 bearish candle to from before pulling the trigger is advised. This will not only help avoid an unnecessary loss, but also help sidestep a fakeout above 1.29, which, as we all know, is common viewing around psychological levels. Assuming one pins down a position from 1.29ish, the first-take-profit target should be set at 1.2835.
Data points to consider today: US advance GDP Q/Q; US employment cost index q/q; Revised UoM consumer sentiment.
USD/CHF:
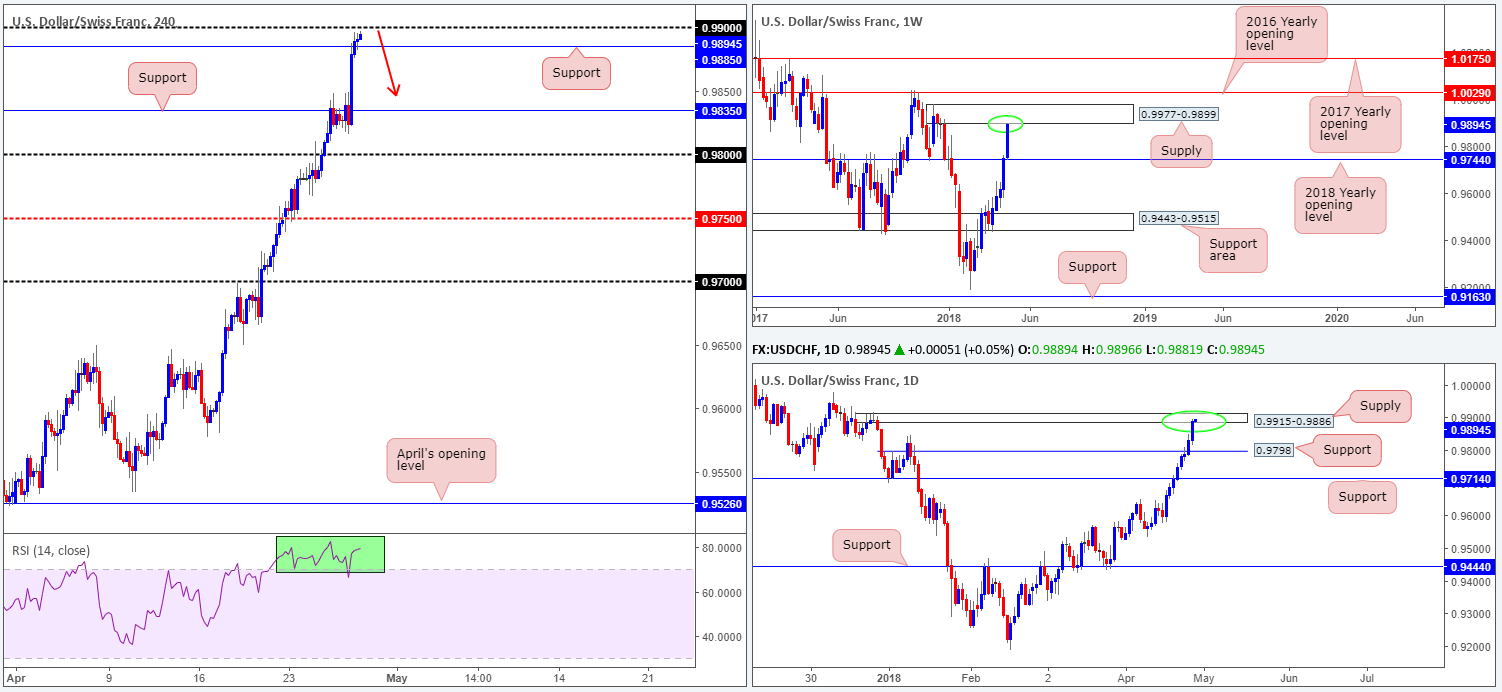
In recent dealings, the USD/CHF extended gains, registering its eighth consecutive daily gain. Bolstered by a robust USD across the board and a weakening EUR/USD as a result of an on-hold ECB, the market concluded the day conquering a H4 Quasimodo resistance at 0.9885 (now acting support), and closing just south of 0.99. Meanwhile, higher up on the curve we have a daily supply zone pictured at 0.9915-0.9886, which happens to be glued to the underside of a weekly supply zone at 0.9977-0.9899.
Potential trading zones:
Keeping it simple, we feel shorts from 0.99 could be an option today. We do not expect the level to hold to the pip, given that there’s 15 pips of space above it within the current daily supply zone. For that reason, the team has noted to keep an eye on the behavior of H4 price once 0.99 is ion the frame. A H4 bearish pin-bar formation that closes beneath H4 support at 0.9885 would, in our view, be enough evidence to short this market, targeting H4 support marked at 0.9835.
Data points to consider today: US advance GDP Q/Q; US employment cost index q/q; Revised UoM consumer sentiment; SNB Chairman Jordan speaks.
DOW 30:
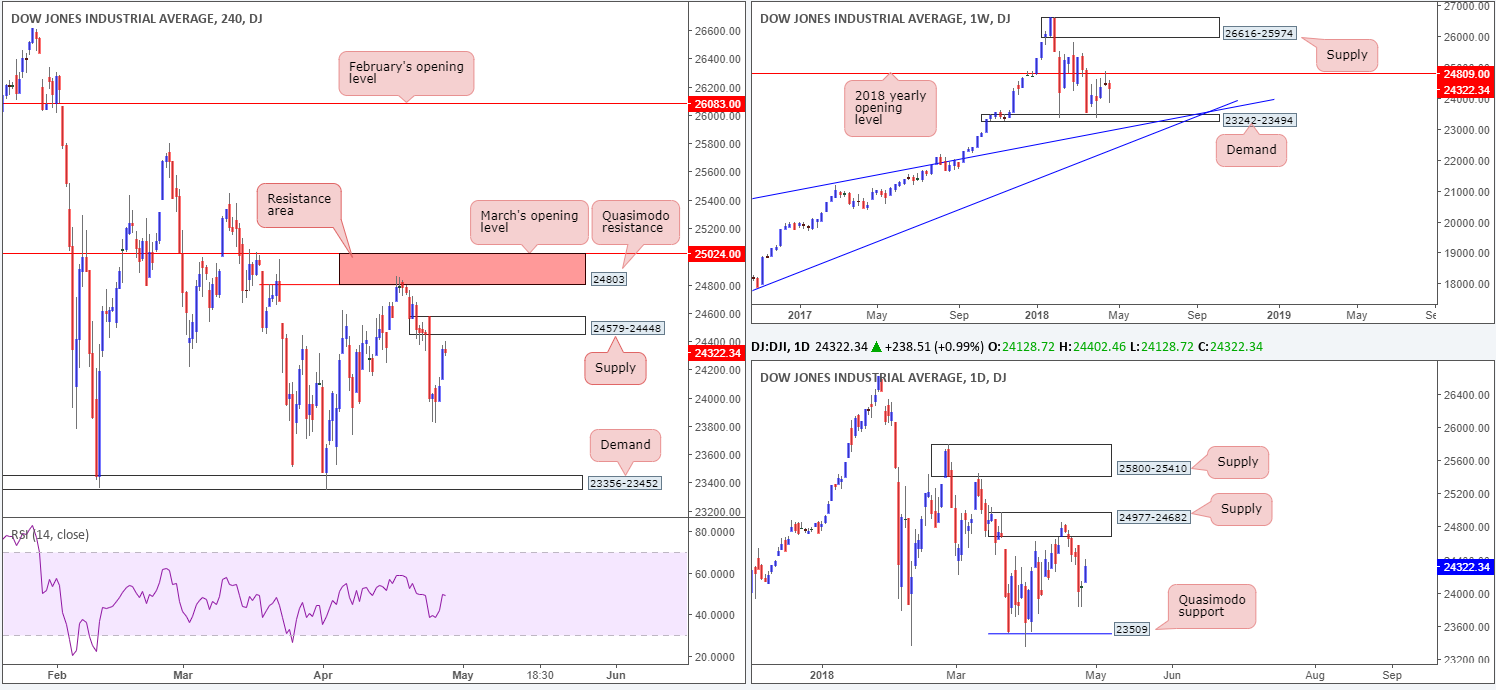
US equities recovered in reasonably strong form on Thursday, after bottoming just north of 23800.Quartely earnings came in higher than expected and the 10-year Treasury yield plunged back beneath the 3% barrier, consequently erasing the prior day’s gains.
Through the lens of a technical trader, this has positioned the H4 candles just ahead of a H4 supply zone penciled in at 24579-24448. Traders might also want to note that above this area is a H4 resistance zone drawn from 25024/24803 (comprised of March’s opening level and a H4 Quasimodo resistance). Also notable is the fact that the H4 resistance area has strong connections to daily supply pictured at 24977-24682, and also houses the 2018 yearly opening level seen on the weekly timeframe at 24809.
Potential trading zones:
Having seen the confluence surrounding the current H4 resistance area, shorting from the H4 supply below it at 24579-24448 might not be the best path to take!
Therefore, the team has noted to place alerts for potential sell trades at the underside of the H4 resistance area. Stop-loss orders would, technically speaking, be best placed above 25024. That way you clear not only the top edge of daily supply but also the H4 resistance zone as well!
The initial take-profit target will likely be around 24579-24448.
Data points to consider today: US advance GDP Q/Q; US employment cost index q/q; Revised UoM consumer sentiment.
GOLD:
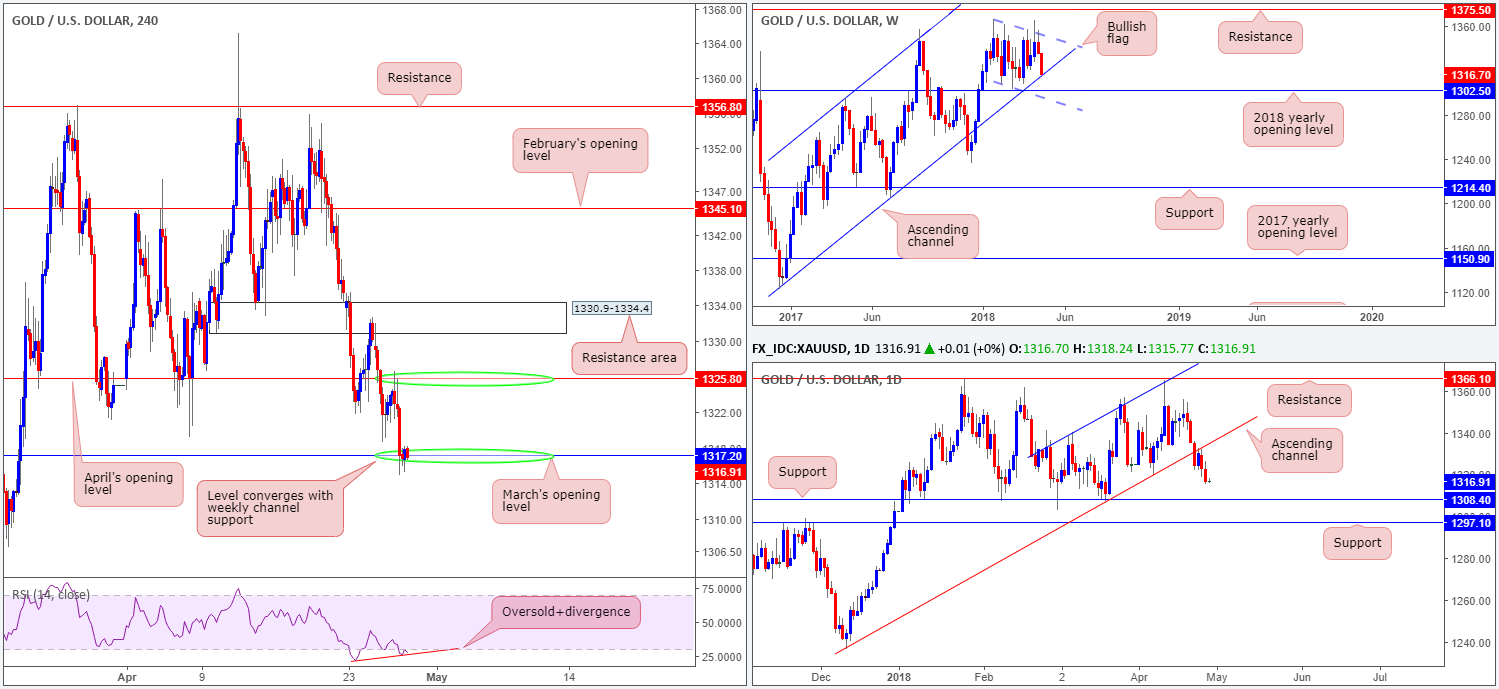
As noted to watch for in Thursday’s report, April’s opening level set on the H4 timeframe at 1325.8 held firm as intraday resistance and hit its support target in the form of March’s opening level at 1317.2, which happens to converge nicely with a weekly channel support taken from the low 1122.8. Well done to those who caught this move!
The question going forward, however, is the weight behind March’s open level as a possible buy zone. Yes, we know it fuses with a weekly channel support along with the H4 RSI signaling oversold/divergence readings, but given that daily price recently broke out of a daily ascending channel and is now poised to drop lower to test daily support at 1308.4, this is a risk. We also don’t like the fact that the DXY has room to pursue higher prices until reaching monthly resistance at 91.92 (remember, a rally in the dollar usually translates to a drop in gold price).
Potential trading zones:
Given the uncertainty surrounding March’s opening level as a viable support, the team has noted to let price action lead the way. What this means is simply wait and see if H4 price can chalk up a reasonably sized H4 full or near-full-bodied bull candle. This way, at least one knows there are interested buyers present before pulling the trigger.
Upside targets from this angle can be set at 1325.8, followed then by a proven H4 resistance zone at 1330.9-1334.4.
This site has been designed for informational and educational purposes only and does not constitute an offer to sell nor a solicitation of an offer to buy any products which may be referenced upon the site. The services and information provided through this site are for personal, non-commercial, educational use and display. IC Markets does not provide personal trading advice through this site and does not represent that the products or services discussed are suitable for any trader. Traders are advised not to rely on any information contained in the site in the process of making a fully informed decision.
This site may include market analysis. All ideas, opinions, and/or forecasts, expressed or implied herein, information, charts or examples contained in the lessons, are for informational and educational purposes only and should not be construed as a recommendation to invest, trade, and/or speculate in the markets. Any trades, and/or speculations made in light of the ideas, opinions, and/or forecasts, expressed or implied herein, are committed at your own risk, financial or otherwise.
The use of the site is agreement that the site is for informational and educational purposes only and does not constitute advice in any form in the furtherance of any trade or trading decisions.
The accuracy, completeness and timeliness of the information contained on this site cannot be guaranteed. IC Markets does not warranty, guarantee or make any representations, or assume any liability with regard to financial results based on the use of the information in the site.
News, views, opinions, recommendations and other information obtained from sources outside of www.icmarkets.com.au, used in this site are believed to be reliable, but we cannot guarantee their accuracy or completeness. All such information is subject to change at any time without notice. IC Markets assumes no responsibility for the content of any linked site. The fact that such links may exist does not indicate approval or endorsement of any material contained on any linked site.
IC Markets is not liable for any harm caused by the transmission, through accessing the services or information on this site, of a computer virus, or other computer code or programming device that might be used to access, delete, damage, disable, disrupt or otherwise impede in any manner, the operation of the site or of any user’s software, hardware, data or property.