EUR/USD:
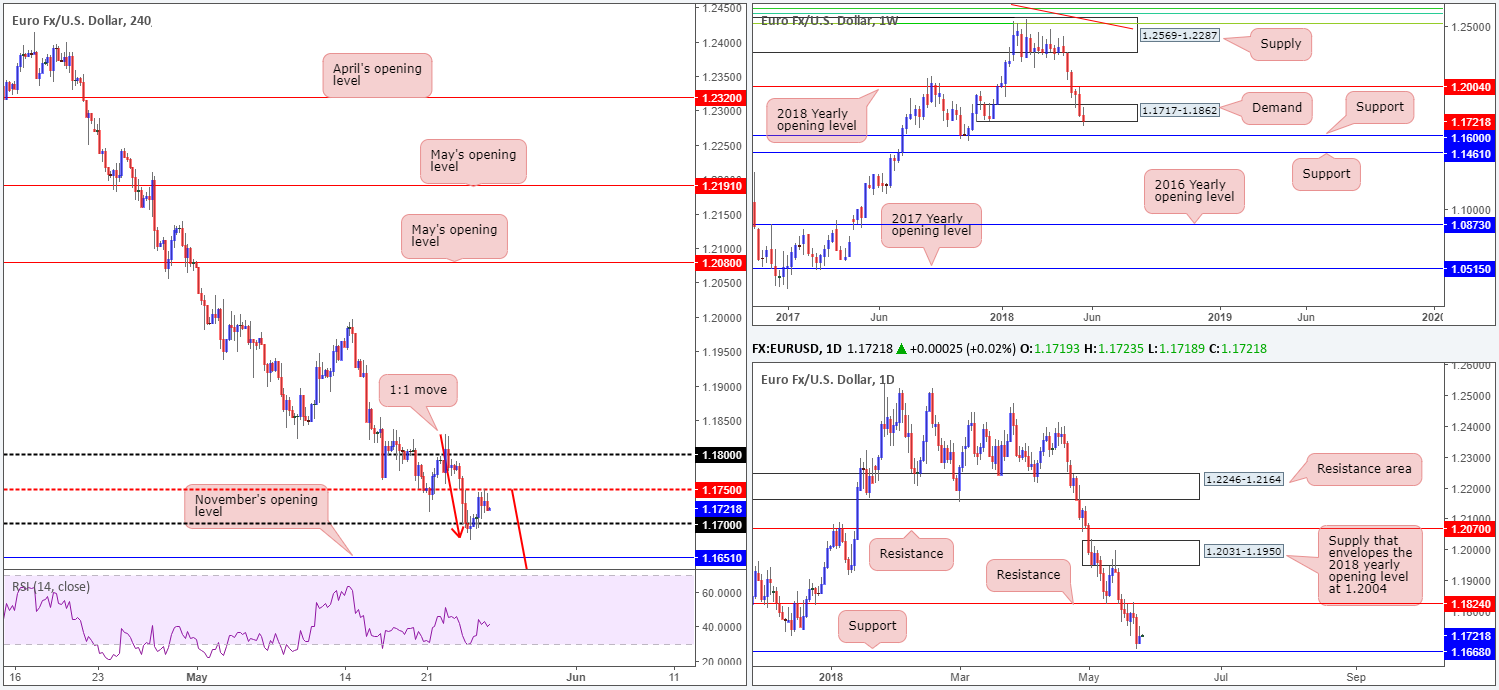
During the course of Thursday’s movement, the single currency staged a modest recovery off the 1.17 handle. Bolstered by mild USD weakness from highs of 94.19 (US dollar index), H4 price shook hands with the H4 mid-level resistance at 1.1750, which, as you can see, has so far held ground. Should the unit continue to defend the underside of 1.1750, a 1:1 move to the 1.16 region could be in store (see red arrows).
While H4 price reflects a somewhat bearish position at present, let’s check out the vibe over on the bigger picture.
Weekly price remains trading within the walls of a demand area coming in at 1.1717-1.1862, despite a recent push lower. From a technical point of view, stop-loss orders beneath here have likely been tripped and possibly opened the path south for a move towards weekly support priced in at 1.1600. Daily flow, on the other hand, shows the unit poised to cross swords with support marked at 1.1668. A violation of this barrier potentially unlocks downside to 1.1574: a daily Quasimodo support (not seen on the screen).
Areas of consideration
Given the overall strength of the sellers right now, and the recent pullback to H4 mid-level resistance at 1.1750 as well as the possible 1:1 H4 move south, shorts at current price could be an option.
Though we expect some bullish activity to be present around the 1.17 neighborhood, the real test for shorts will likely be at the current daily support level drawn in from 1.1668. Therefore, this number, followed by the weekly support mentioned above at 1.1600 are considered take-profit targets for any shorts initiated at current price.
Today’s data points: German IFO business climate; German Buba President Weidmann speaks; US durable goods orders; Fed Chair Powell speaks; US revised UoM consumer sentiment; FOMC member Bostic speaks.
GBP/USD:
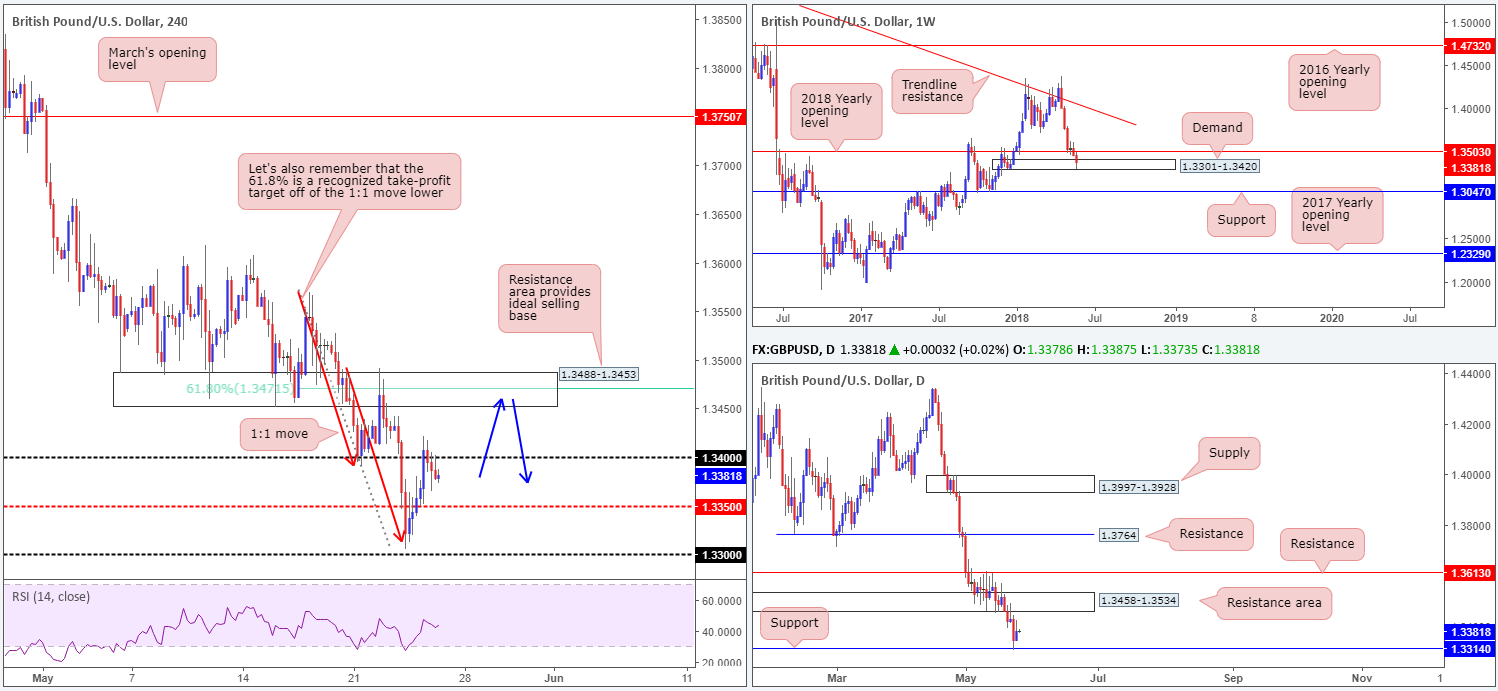
The British pound caught a favorable wind north on Thursday following upbeat UK (Apr) retail sales. Despite this, the market swiftly peaked at 1.3422, to later stabilize back beneath the 1.34 mark. Also worthy of note was reports that UK PM May was to ask the EU for a Brexit transition period extension through 2023 in order to avoid a hard Irish border. A UK government source denied the report, and said the proposed exit remains at the end of 2020.
From a technical standpoint, much of the following will echo thoughts put forward in Thursday’s report.
With sellers potentially weakened around the 1.34 point, focus remains on the H4 resistance area planted above it at 1.3488-1.3453. This area interestingly houses a 61.8% H4 Fib resistance value printed at 1.3471, which happens to be a recognized take-profit target of the recent 1:1 move lower (see red arrows).
Areas of consideration:
We’re particularly fond of the H4 resistance area since it is also sited just south of the 2018 yearly opening level on the weekly timeframe (next upside target on the weekly scale) at 1.3503, and also located within the walls of a daily resistance area planted at 1.3458-1.3534 (next upside target on the daily scale). Therefore, shorts from 1.3488-1.3453, in our humble view, are high probability (see blue arrows), with the first downside target coming in at 1.34ish.
Today’s data points: UK GDP (second estimate) q/q; UK prelim business investment q/q; BoE Gov. Carney speaks. US durable goods orders; Fed Chair Powell speaks; US revised UoM consumer sentiment; FOMC member Bostic speaks.
AUD/USD:
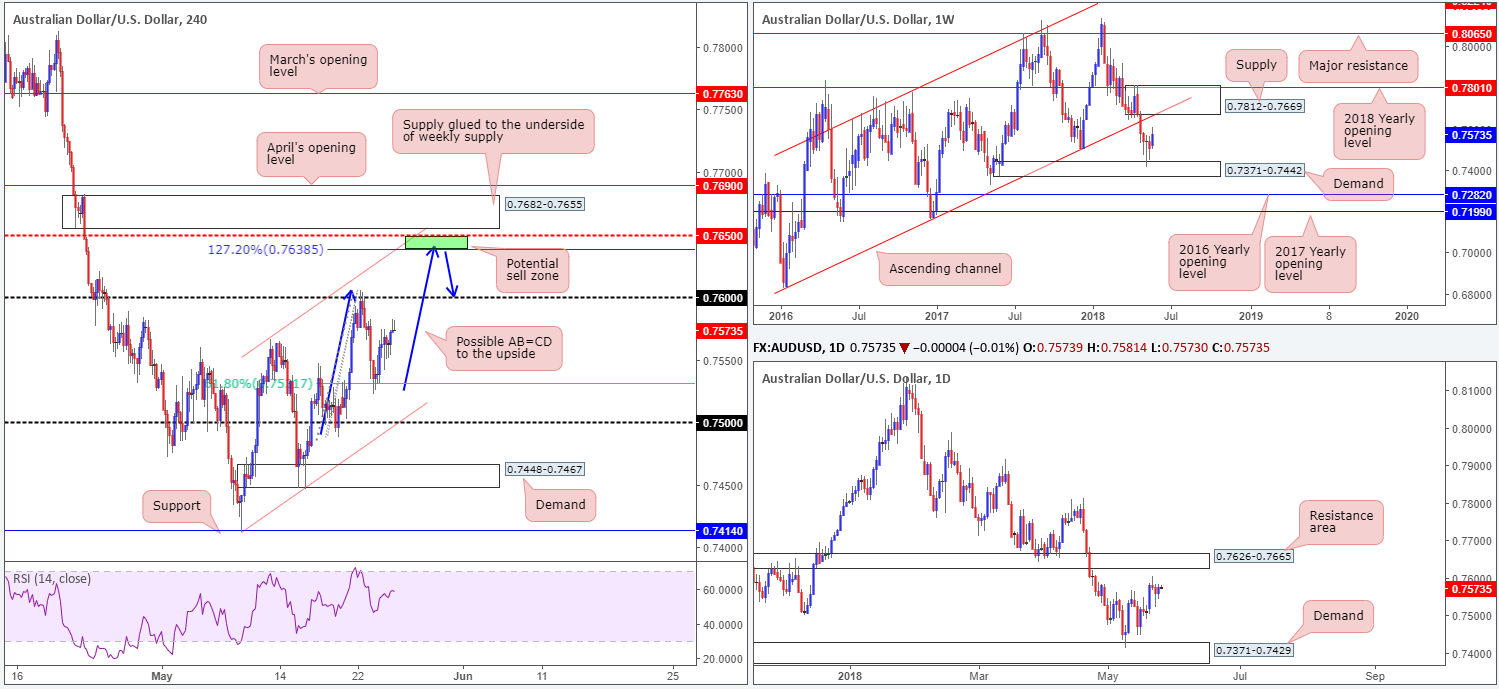
Recent action shows that the commodity currency mildly extended gains off Wednesday’s low 0.7522, lifting 0.21% on the day. A marginally fading USD has, as you can see on the H4 timeframe, helped lift the candles up to within striking distance of the 0.76 boundary.
Further buying in this market could actually bring the piece above 0.76 to 0.7650ish in the shape of a H4 AB=CD move (see blue arrows). 0.7650 not only closely interacts with a H4 channel resistance etched from the high 0.7566, it also is positioned within a daily resistance area seen at 0.7626-0.7665.
Areas of consideration:
In much the same fashion as Thursday’s report, all eyes remain on the 0.7650 point for shorts owing to its surrounding confluence. As for stop-loss placement, we strongly recommend using the H4 supply at 0.7682-0.7655, since it is glued to the underside of weekly supply at 0.7812-0.7669. The first support target from 0.7650 would likely be around the 0.76 neighborhood.
Today’s data points: RBA Assist Gov. Bullock speaks; US durable goods orders; Fed Chair Powell speaks; US revised UoM consumer sentiment; FOMC member Bostic speaks.
USD/JPY:
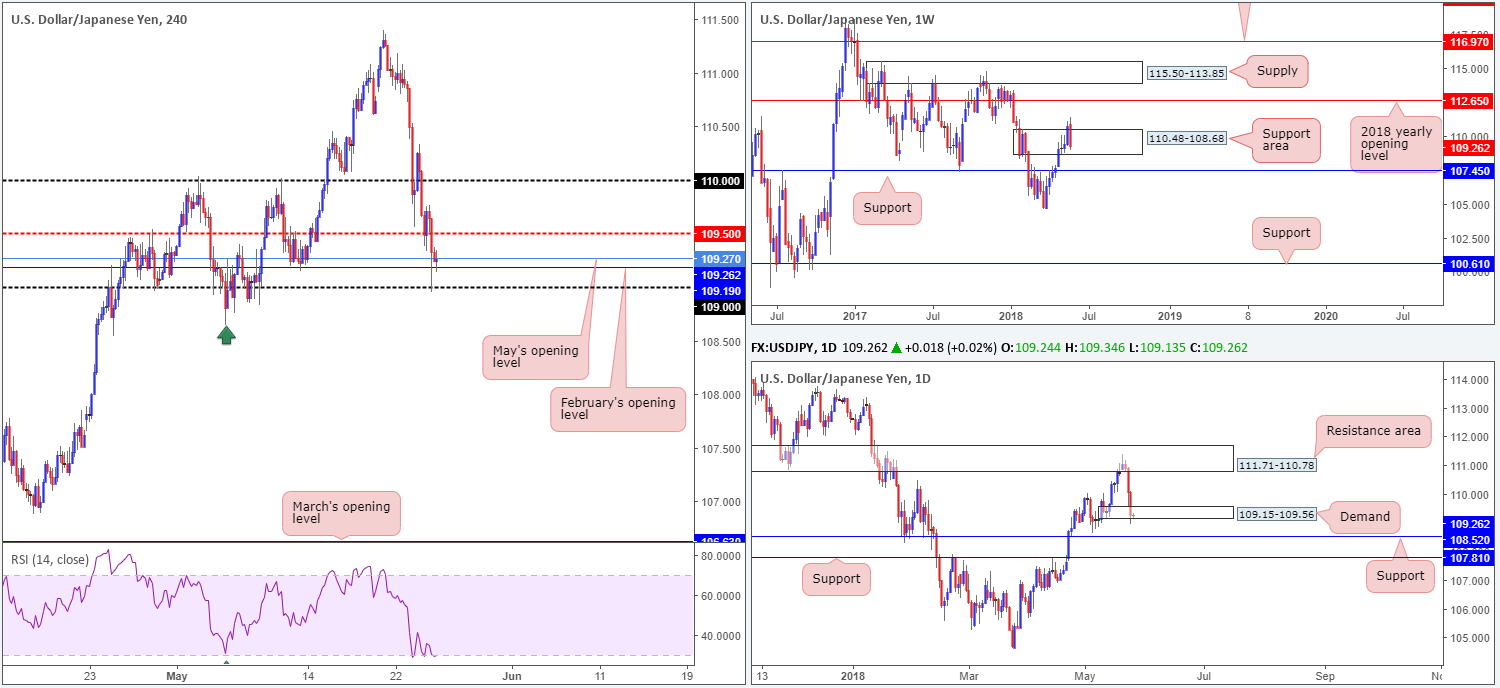
In recent news, US President Trump pulled out of the June 12 summit with North Korea leader Kim, adding that the meeting is inappropriate at this time.
This abruptly sent the USD/JPY to lows of 108.95, whipsawing through both the 109 handle and its closely associated monthly opening levels seen on the H4 timeframe (February and May) at 109.19/109.27. To our way of seeing things, the pair remains bullish UNTIL the swing (H4) low seen marked with a green arrow is taken out at 108.64.
What’s also notable from a technical perspective is yesterday’s move managed to erase all gained ground put up the week prior. Further to this, we can also see that the unit drove deeper into a weekly support area at 110.48-108.68, and also marginally whipsawed through the lower edge of a daily demand base at 109.15-109.56.
Areas of consideration:
109/109.27 on the H4 timeframe may offer an intraday platform for buying opportunities today. Resistance will likely be found off of the nearby H4 mid-level resistance at 109.50, though, so make sure to pencil this in!
Longer term, we do see possible bullish pressure entering the market soon. Below the current weekly support area there’s a strong base emanating from the 107.45 neighborhood. On the daily timeframe, apart from the current daily demand in play, there’s notable support emerging from 108.52.
Today’s data points: US durable goods orders; Fed Chair Powell speaks; US revised UoM consumer sentiment; FOMC member Bostic speaks.
USD/CAD:
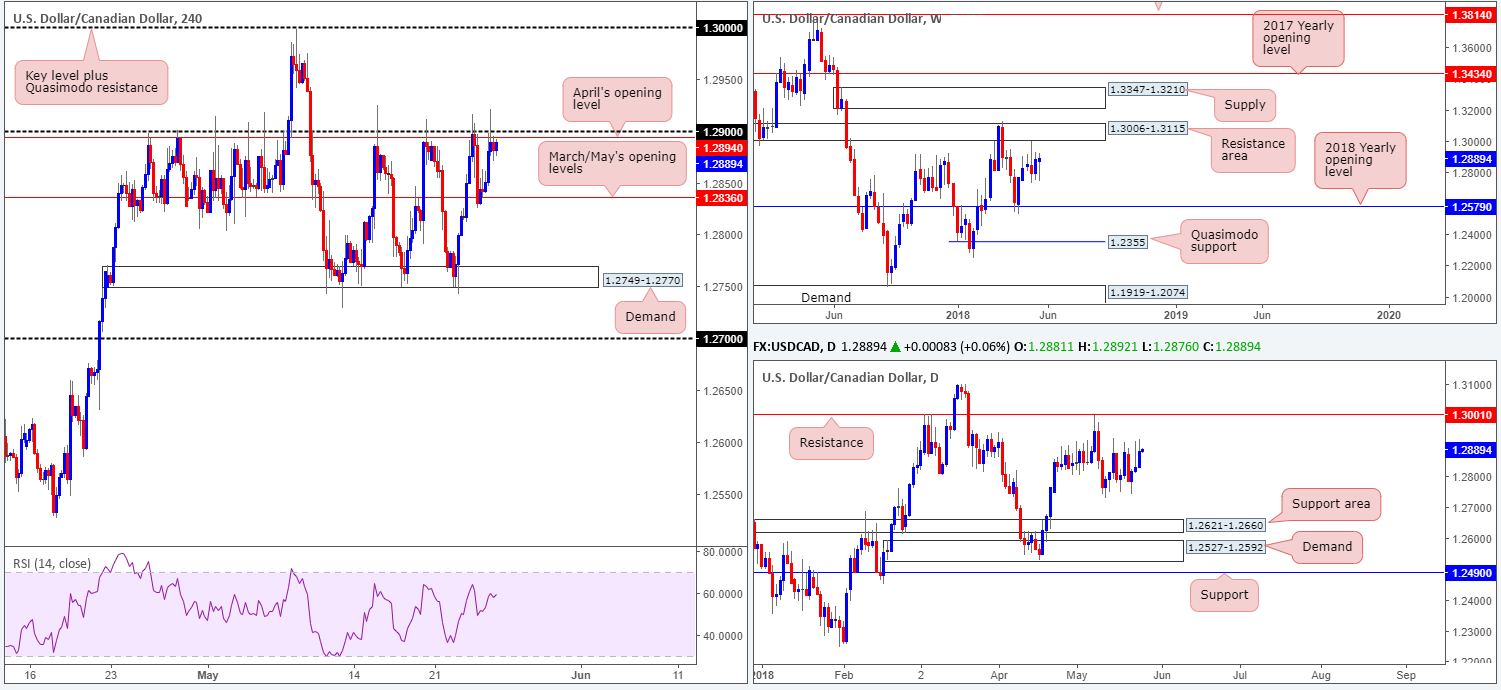
The Canadian dollar appears to have taken a cue from oil amid trade on Thursday, after the USD/CAD found support off March/May’s opening levels at 1.2836 seen on the H4 timeframe. Yesterday’s action saw oil register its second consecutive daily loss.
In spite of the above, structure in this market remains unchanged. Since May 10, the pair has been busy carving out a reasonably well-defined range between H4 demand at 1.2749-1.2770 and the 1.29 handle.
Weekly price continues to reflect a bearish stance. After coming within inches of tapping the underside of a weekly resistance area at 1.3006-1.3115 two weeks ago, further selling is possible at least until the 2018 yearly opening level seen at 1.2579. The story on the daily timeframe, however, shows a possibility that the unit may approach daily resistance plugged in at 1.3001.
Areas of consideration:
As the current H4 range remains intact, opportunities to enter short off 1.29 could be an option going into today’s sessions. To be on the safe side here, though, we recommend waiting and seeing if H4 price can chalk up a full or near-full-bodied bodied bear candle off 1.29 (stop-loss orders best placed beyond the wick of the rejecting candle). This is largely due to the potential threat of further upside on the daily timeframe. The first downside target off 1.29 will, of course, be 1.2836. This is then followed by the lower end of the H4 range at 1.2749-1.2770.
Today’s data points: US durable goods orders; Fed Chair Powell speaks; US revised UoM consumer sentiment; FOMC member Bostic speaks.
USD/CHF:
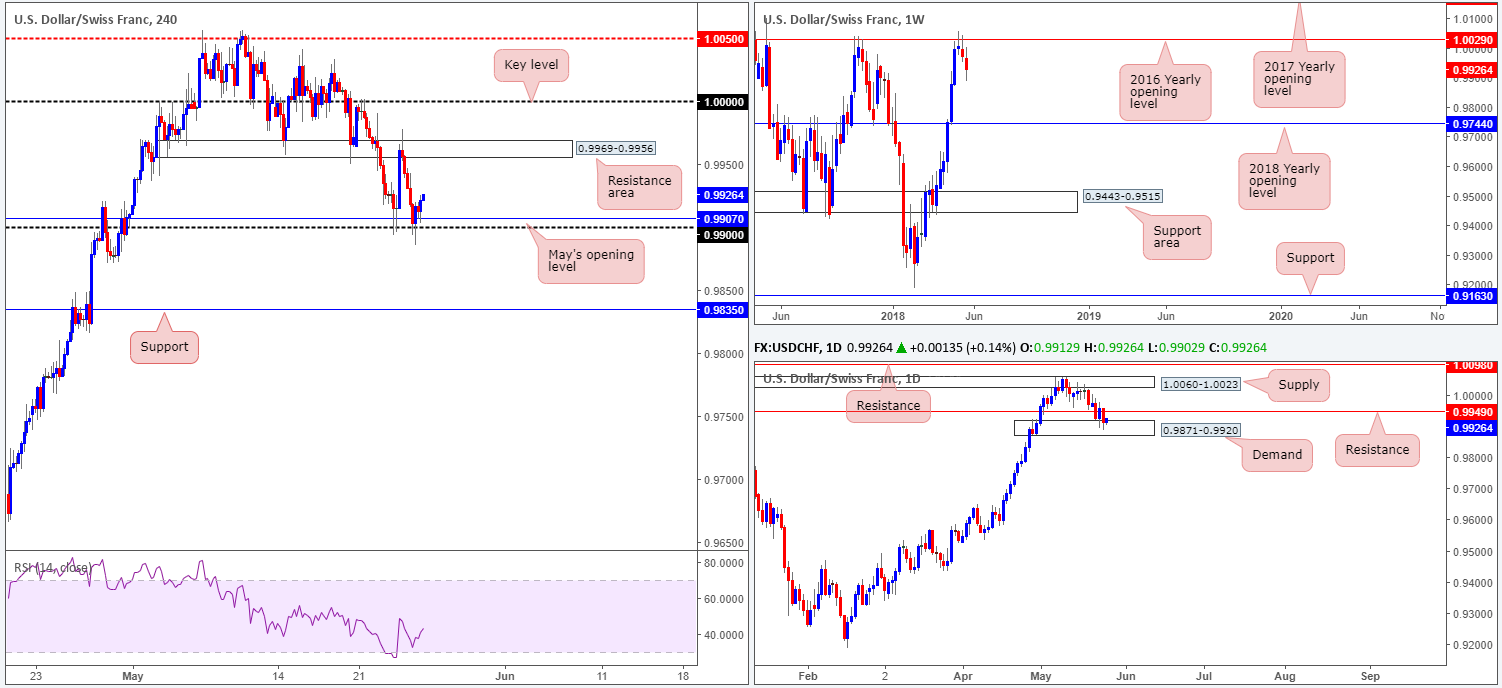
Following a modest bout of selling on Thursday, the USD/CHF settled around the 0.99 neighborhood. Helped by the fact that this number is bolstered by May’s opening level seen on the H4 timeframe at 0.9907, active buyers defended this line into the closing bell. While this could see an influx of buying interest going forward, traders need to remain cognizant of the overall surroundings.
On the daily timeframe, for example, demand at 0.9871-0.9920 is currently in play but has failed to produce anything meaningful to the upside due to nearby resistance coming in from 0.9949. Also notable from a technical perspective is the weekly timeframe. Following a test of the 2016 yearly opening level at 1.0029 two weeks back, price action shows little support on the horizon until connecting with the 2018 yearly opening level marked at 0.9744.
Areas of consideration:
Through the lens of a simple technical trader, entering long in this market is precarious. Not only do we have nearby daily resistance situated at 0.9949, there’s also potential weekly selling pressure to contend with as well.
As an alternative, should H4 price cross below 0.99 we feel this would be a strong enough cue to begin considering shorts. Yes, price would still be engaged with the nearby daily demand at 0.9871-0.9920, but overhead pressure from weekly sellers should be enough to overcome buying around this zone. Therefore, keep eyes out for a H4 close below 0.99 that’s followed up with a retest as resistance. The first take-profit target from this point falls in around H4 support noted at 0.9835.
Today’s data points: US durable goods orders; Fed Chair Powell speaks; US revised UoM consumer sentiment; FOMC member Bostic speaks.
Dow Jones Industrial Average:
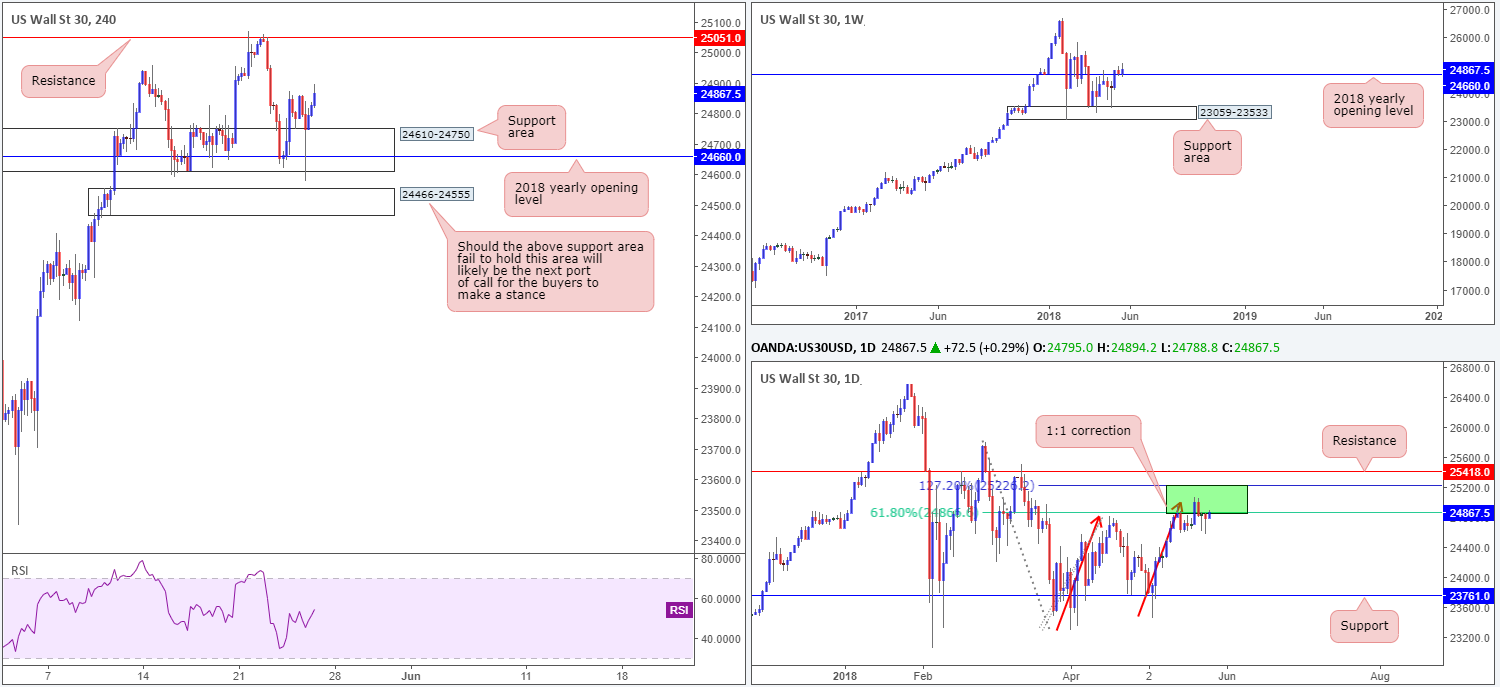
Major US indexes tumbled sharply lower on Thursday as traders responded to US President Trump pulling out of the June 12 summit with North Korea leader Kim Jong Un. The move, however, was a relatively short-lived one, as buyers resurfaced off lows of 24577 and ended the day recording marginal losses.
As can be seen from the H4 timeframe this morning, the H4 support area at 24610-24750 remains intact, despite yesterday’s brief spell of selling. The reason behind this area holding is likely down to it housing the 2018 yearly opening level within at 24660 (weekly timeframe). Regardless of this, though, daily sellers are currently putting up a strong fight from 25229/24866. The area marked in green is comprised of a 61.8% daily Fib resistance value and a 127.2% 1:1 correction (see red arrows) daily Fib ext. point.
Areas of consideration:
In essence we have potential strength emanating from both H4 and weekly structure in this market, and possible bearish activity from daily movement. Therefore, irrespective of the decision one makes, that is from a medium-term trade standpoint, you’ll face competing motion.
Personally, we would not label any form of selling as high probability right now. Going against nearby weekly structure is generally a recipe for disaster. Should you consider entering long based on current support, nevertheless, the next port of call to have on the radar falls in at 25051: a H4 resistance level.
Today’s data points: US durable goods orders; Fed Chair Powell speaks; US revised UoM consumer sentiment; FOMC member Bostic speaks.
GOLD (XAU/USD)
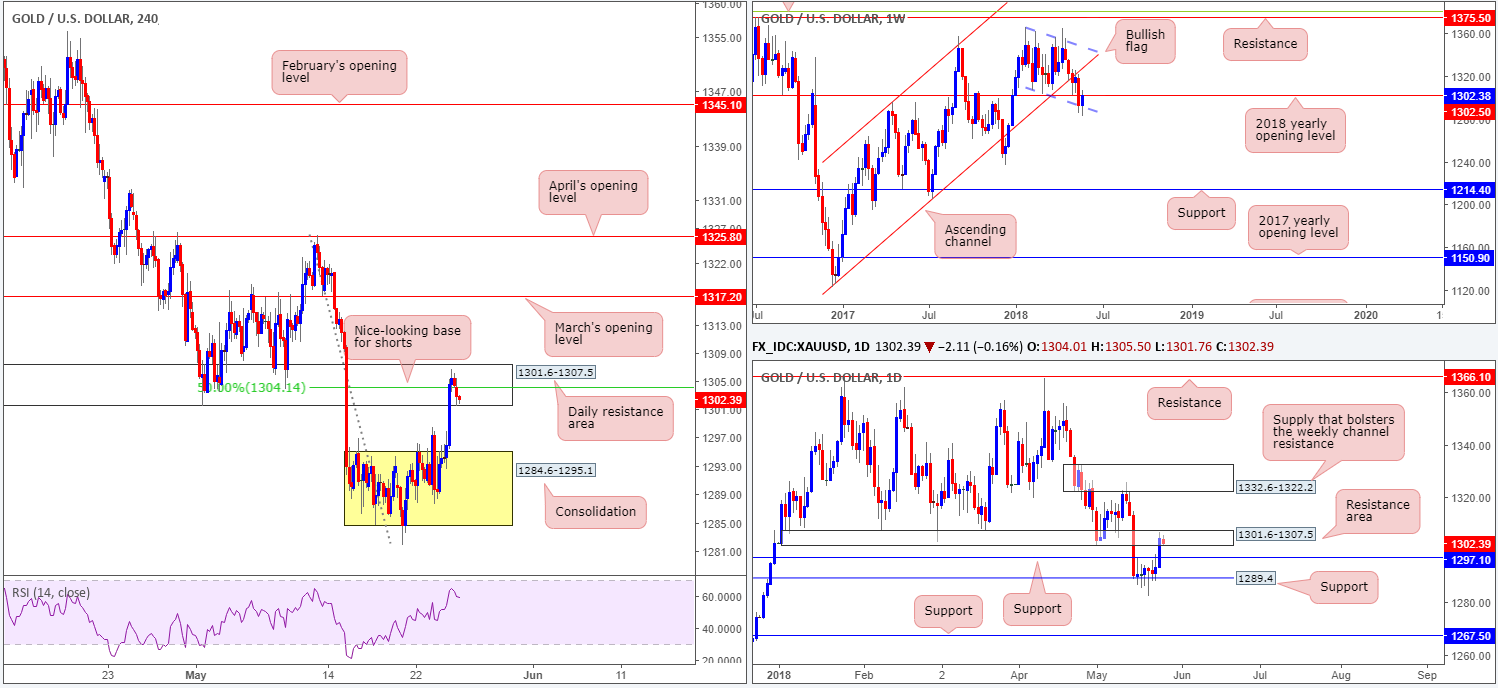
On the back of a mildly fading USD, the price of gold ripped through the top edge of its current H4 range fixed between 1284.6/1295.1 and shook hands with a particularly interesting area of daily resistance at 1301.6-1307.5.
This was a noted move to watch for in Thursday’s report, since this area is prime for selling, according to technical structure. Why this is, simply comes down to the zone fusing with a 2018 yearly opening level at 1302.5 seen planted on the weekly timeframe and a 50.0% H4 resistance value at 1304.1.
Areas of consideration:
Keeping it Simple Simon this morning, the team currently sees evidence of selling activity within the current daily resistance area, and therefore believe it is ripe for a sell, targeting the top edge of the recently broken H4 range at 1295.1. Stop-loss orders are best placed beyond the daily resistance zone (1307.5).
The use of the site is agreement that the site is for informational and educational purposes only and does not constitute advice in any form in the furtherance of any trade or trading decisions.
The accuracy, completeness and timeliness of the information contained on this site cannot be guaranteed. IC Markets does not warranty, guarantee or make any representations, or assume any liability with regard to financial results based on the use of the information in the site.
News, views, opinions, recommendations and other information obtained from sources outside of www.icmarkets.com.au, used in this site are believed to be reliable, but we cannot guarantee their accuracy or completeness. All such information is subject to change at any time without notice. IC Markets assumes no responsibility for the content of any linked site. The fact that such links may exist does not indicate approval or endorsement of any material contained on any linked site.
IC Markets is not liable for any harm caused by the transmission, through accessing the services or information on this site, of a computer virus, or other computer code or programming device that might be used to access, delete, damage, disable, disrupt or otherwise impede in any manner, the operation of the site or of any user’s software, hardware, data or property.


